| Param | Original file | Final file |
|---|---|---|
| Filename | modeM0/AS1A05_012T02_9000002468_16683cztM0_level2.evt | modeM0/AS1A05_012T02_9000002468_16683cztM0_level2_quad_clean.evt |
| Size (bytes) | 567,938,880 | 81,486,720 |
| Size | 541.6 MB | 77.7 MB |
| Events in quadrant A | 4,513,561 | 506,681 |
| Events in quadrant B | 3,076,374 | 534,216 |
| Events in quadrant C | 2,749,679 | 517,011 |
| Events in quadrant D | 6,451,237 | 487,248 |
| Mode M0 | |||
|---|---|---|---|
| Quadrant | BADHDUFLAG | Total packets | Discarded packets |
| A | 0 | 17440 | 2 |
| B | 0 | 12895 | 1 |
| C | 0 | 12251 | 1 |
| D | 0 | 23462 | 1 |
| Mode M9 | |||
|---|---|---|---|
| Quadrant | BADHDUFLAG | Total packets | Discarded packets |
| A | 0 | 9 | 0 |
| B | 0 | 9 | 0 |
| C | 0 | 9 | 0 |
| D | 0 | 9 | 0 |
| Mode SS | |||
|---|---|---|---|
| Quadrant | BADHDUFLAG | Total packets | Discarded packets |
| A | 0 | 122 | 0 |
| B | 0 | 122 | 0 |
| C | 0 | 122 | 0 |
| D | 0 | 122 | 0 |
| Quadrant | Total seconds | Saturated seconds | Saturation percentage |
|---|---|---|---|
| A | 6047 | 397 | 6.565239% |
| B | 6047 | 55 | 0.909542% |
| C | 6047 | 38 | 0.628411% |
| D | 6047 | 686 | 11.344468% |
Noise dominated data is calculated using 1-second bins in cleaned event files. If a bin has >2000 counts, and if more than 50% of those come from <1% of pixels, then it is considered to be noise-dominated and hence unusable.
| Quadrant | # 1 sec bins | Bins with >0 counts | Bins with >2000 counts | High rate bins dominated by noise | Noise dominated (total time) | Noise dominated (detector-on time) | Marked lightcurve |
|---|---|---|---|---|---|---|---|
| A | 6888 | 6049 | 243 | 243 | 3.53% | 4.02% | 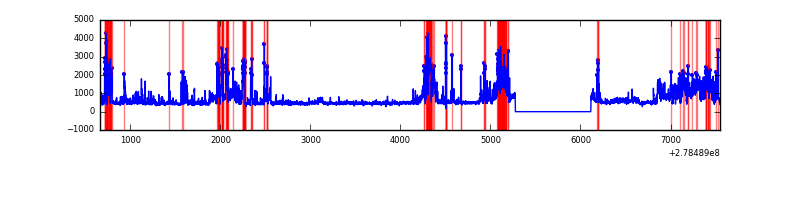 |
| B | 6888 | 6049 | 3 | 3 | 0.04% | 0.05% | 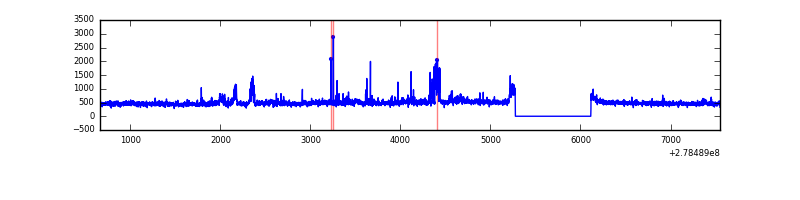 |
| C | 6888 | 6049 | 0 | 0 | 0.00% | 0.00% | 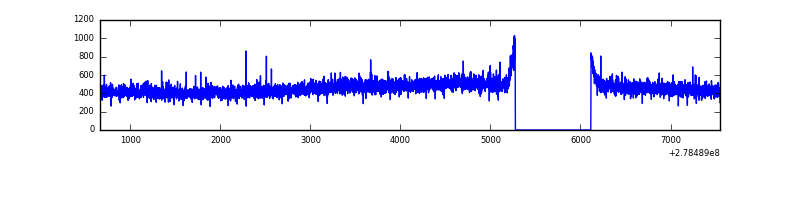 |
| D | 6888 | 6049 | 528 | 528 | 7.67% | 8.73% | 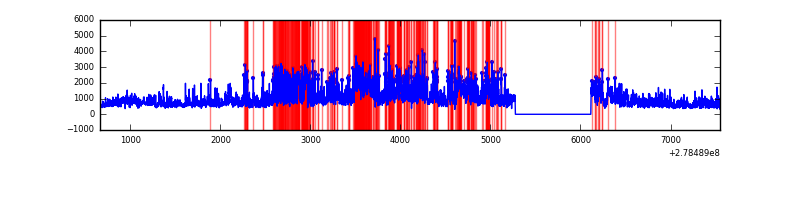 |
Top three noisy pixels from each quadrant. If the there are fewer than three noisy pixels in the level2.evt file, extra rows are filled as -1
| Pixel properties | Quadrant properties | ||||||
|---|---|---|---|---|---|---|---|
| Quadrant | DetID | PixID | Counts | Sigma | Mean | Median | Sigma |
| A | 15 | 174 | 1645911 | 11712.85 | 695 | 681 | 140.5 |
| A | 9 | 143 | 149795 | 1061.58 | 695 | 681 | 140.5 |
| A | 12 | 96 | 36288 | 253.5 | 695 | 681 | 140.5 |
| B | 15 | 35 | 158936 | 1165.63 | 703 | 683 | 135.8 |
| B | 0 | 229 | 98471 | 720.27 | 703 | 683 | 135.8 |
| B | 0 | 189 | 29884 | 215.08 | 703 | 683 | 135.8 |
| C | 14 | 238 | 103932 | 653.44 | 674 | 677 | 158.0 |
| C | 7 | 247 | 11637 | 69.36 | 674 | 677 | 158.0 |
| C | 3 | 233 | 7860 | 45.46 | 674 | 677 | 158.0 |
| D | 1 | 52 | 2562466 | 15733.14 | 663 | 643 | 162.8 |
| D | 2 | 16 | 1097144 | 6734.04 | 663 | 643 | 162.8 |
| D | 10 | 70 | 230876 | 1413.95 | 663 | 643 | 162.8 |
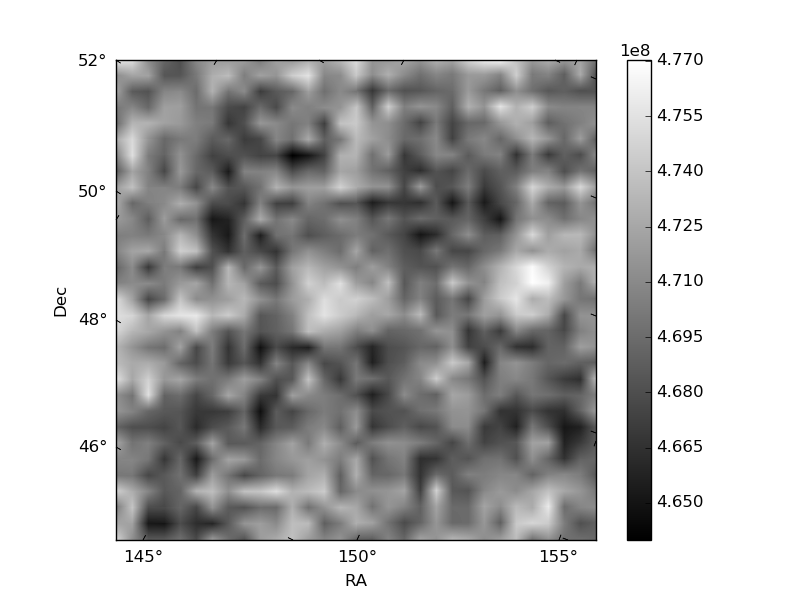
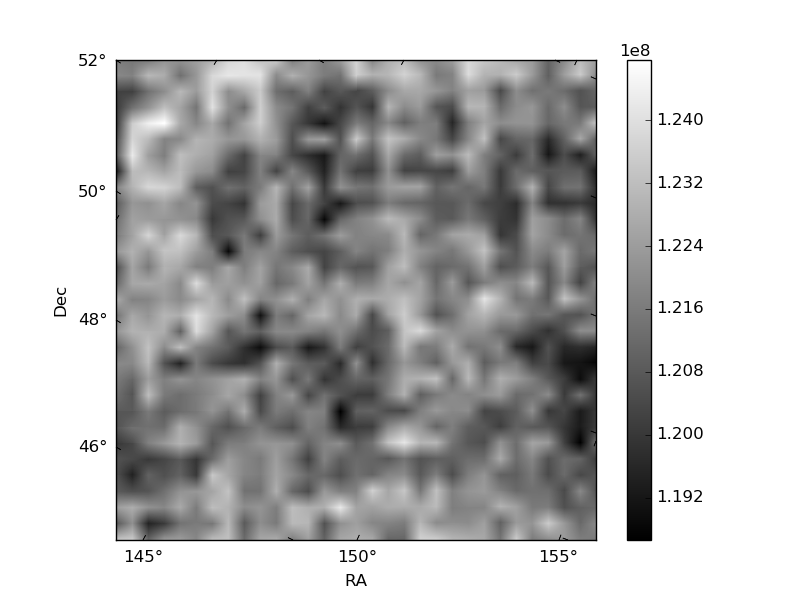
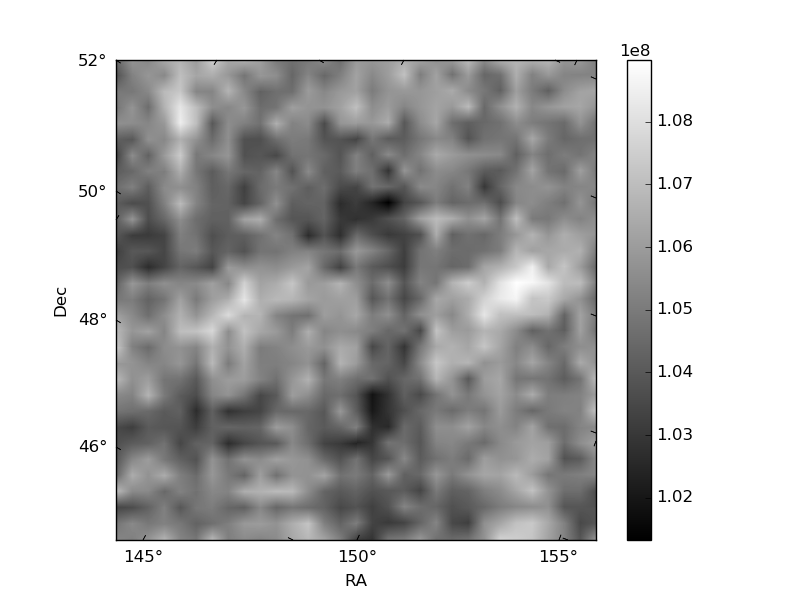
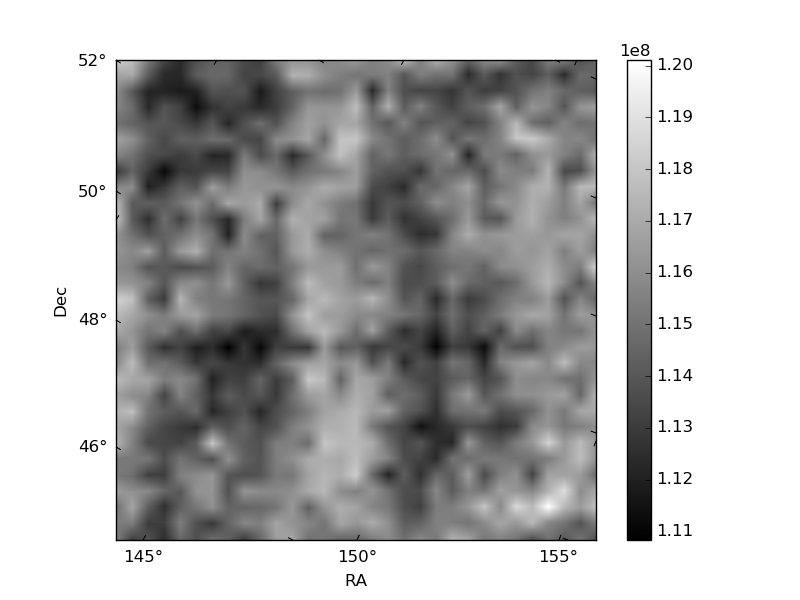
Histogram calculated using DETX and DETY for each event in the final _common_clean file
| Quadrant A | 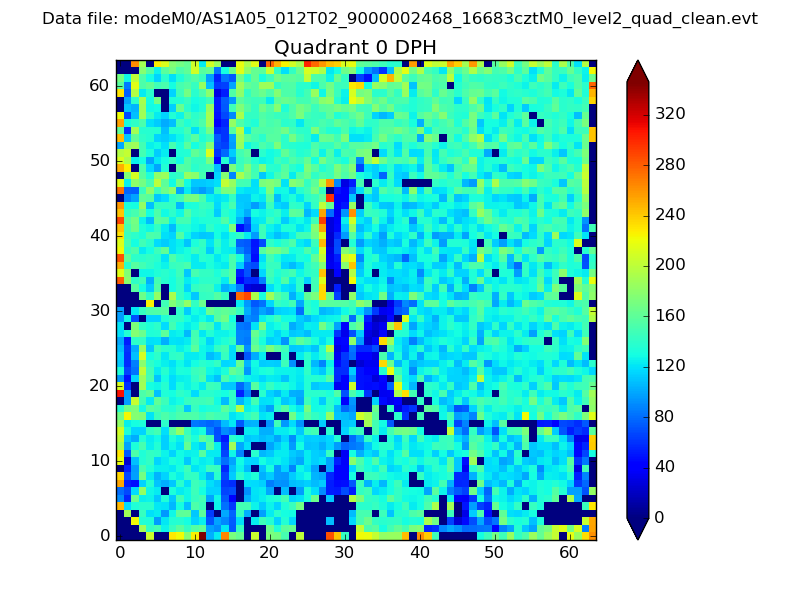 |
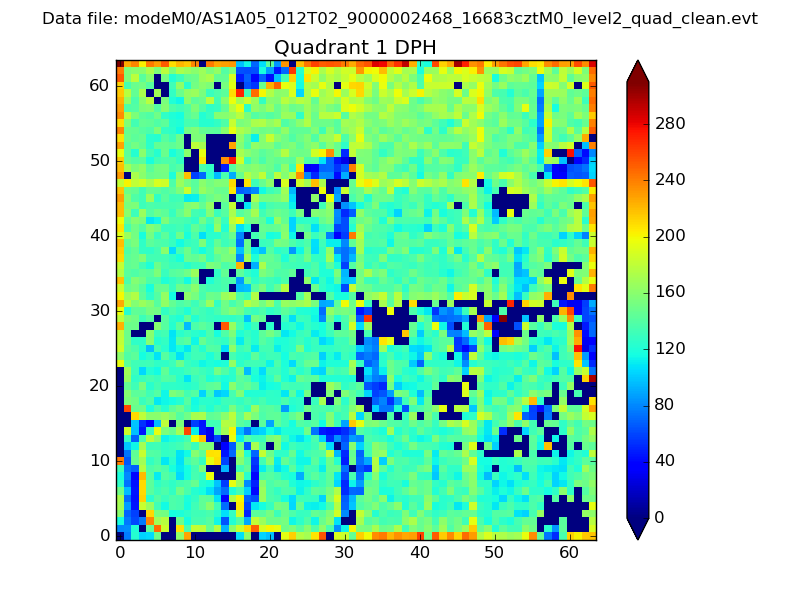 |
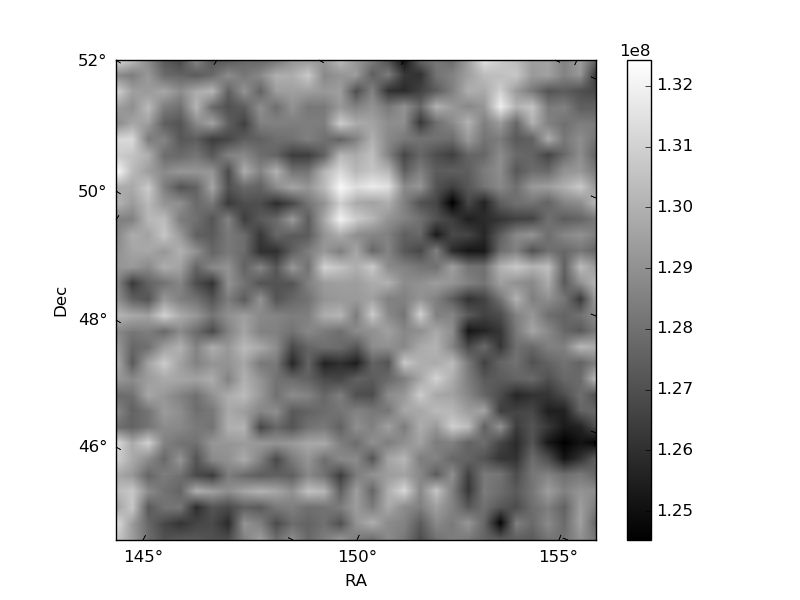
Quadrant B |
|---|---|---|---|
| Quadrant D | 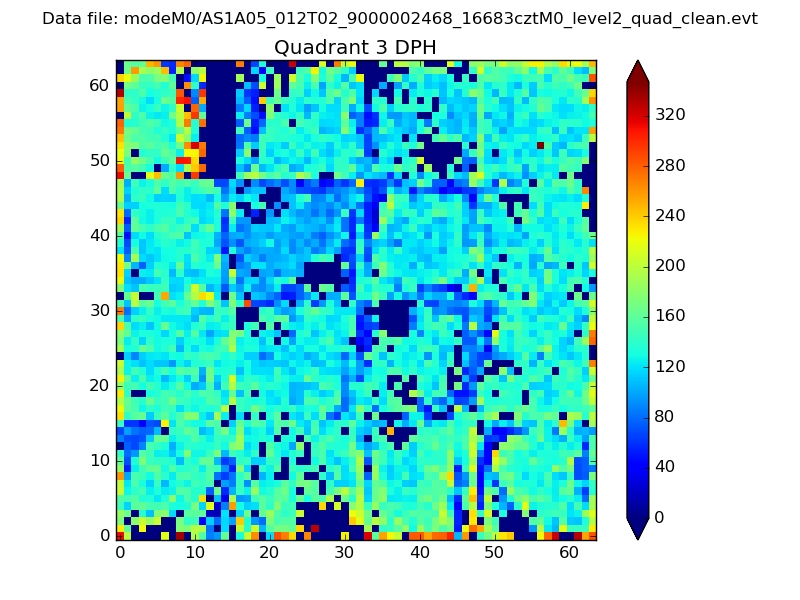 |
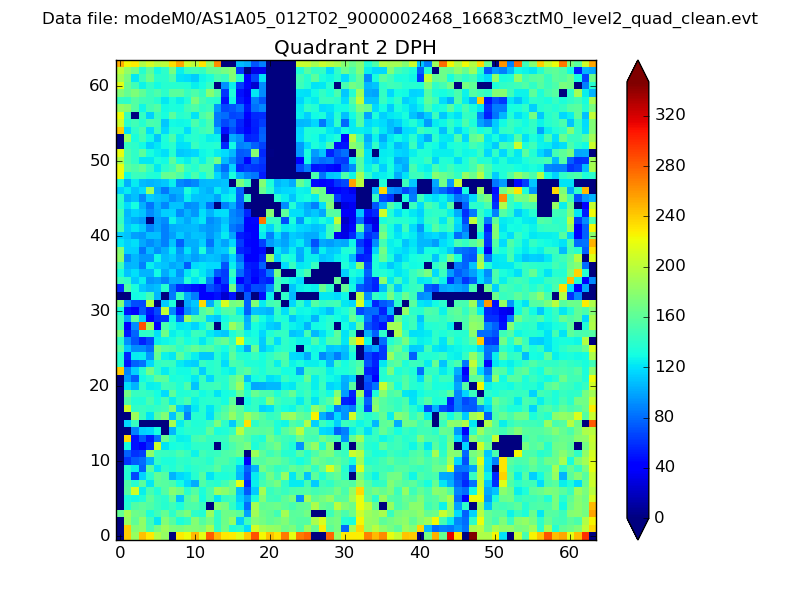 |
Quadrant C |
| Plot type | Count rate plots | Images |
|---|---|---|
| Comparison with Poisson distribution Blue bars denote a histogram of data divided into 1 sec bins. Red curve is a Poisson curve with rate = median count rate of data. |
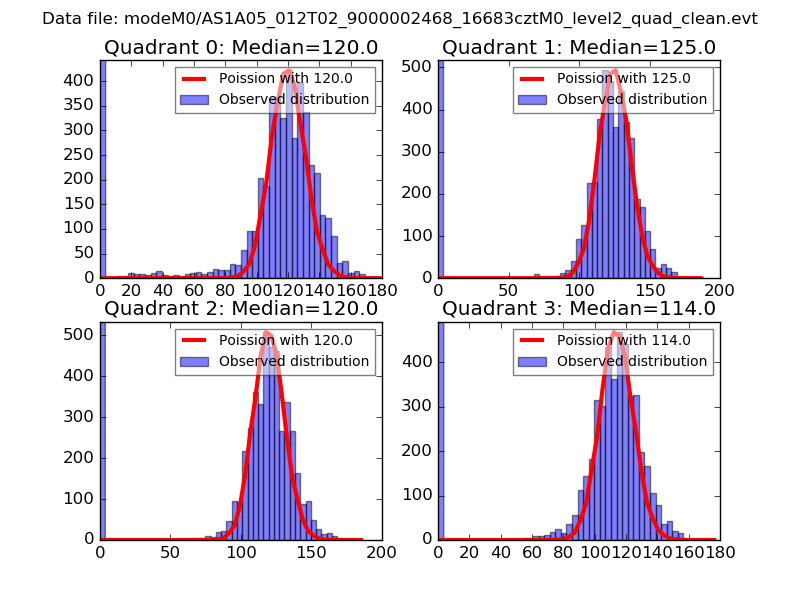 |
 |
| Quadrant-wise count rates Data is divided into 100 sec bins |
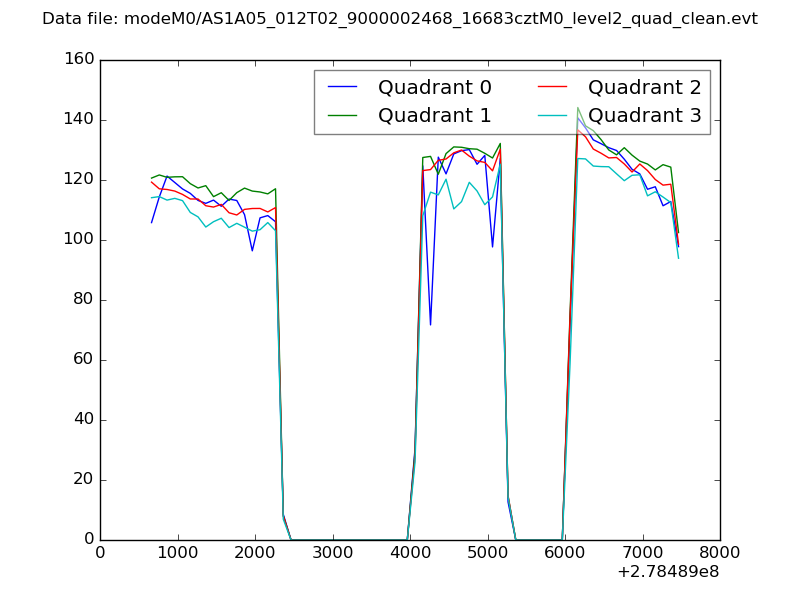 |
|
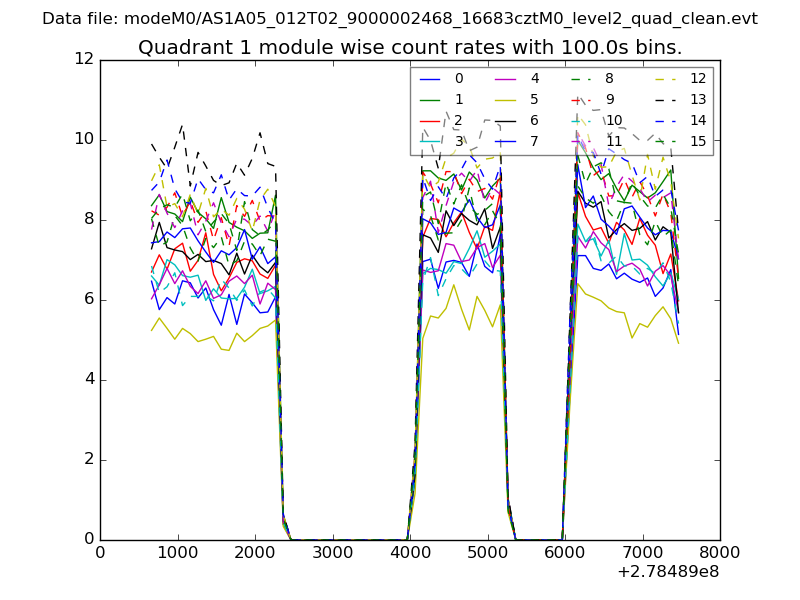
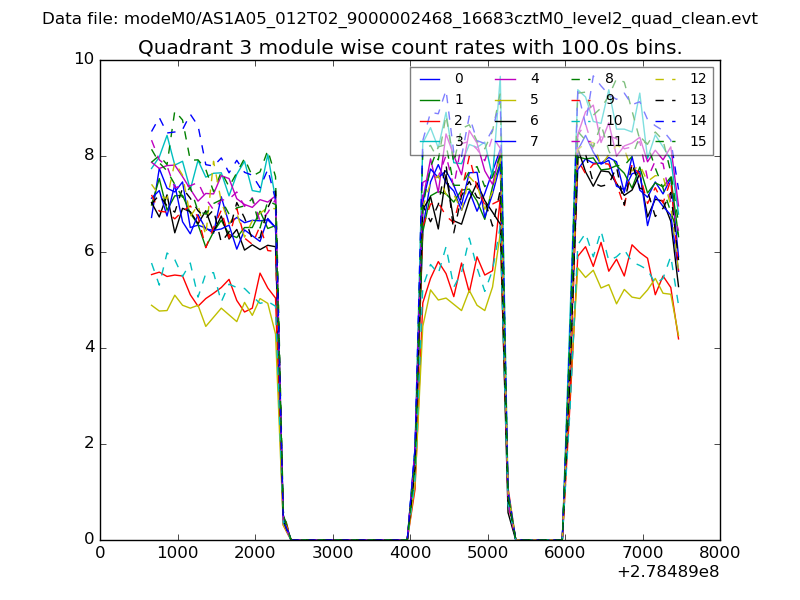
| Module-wise count rates for Quadrant A Data is divided into 100 sec bins |
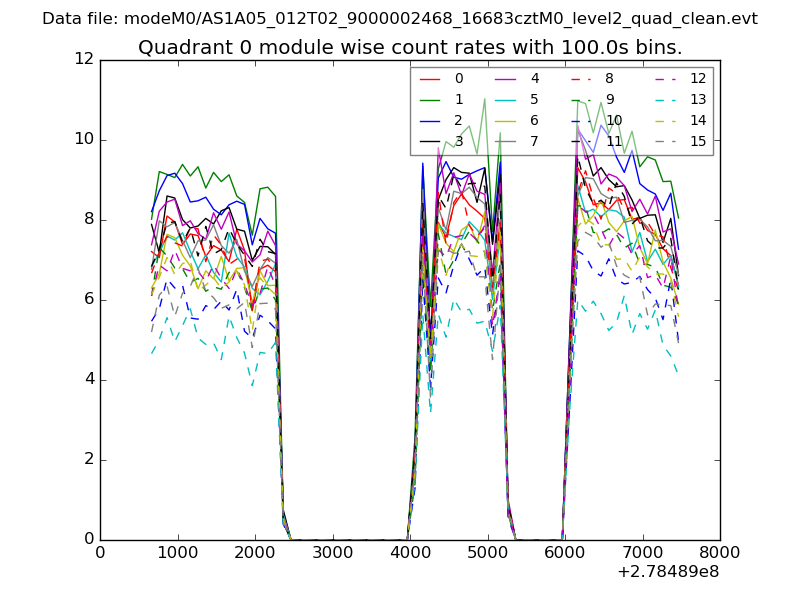 |
 |
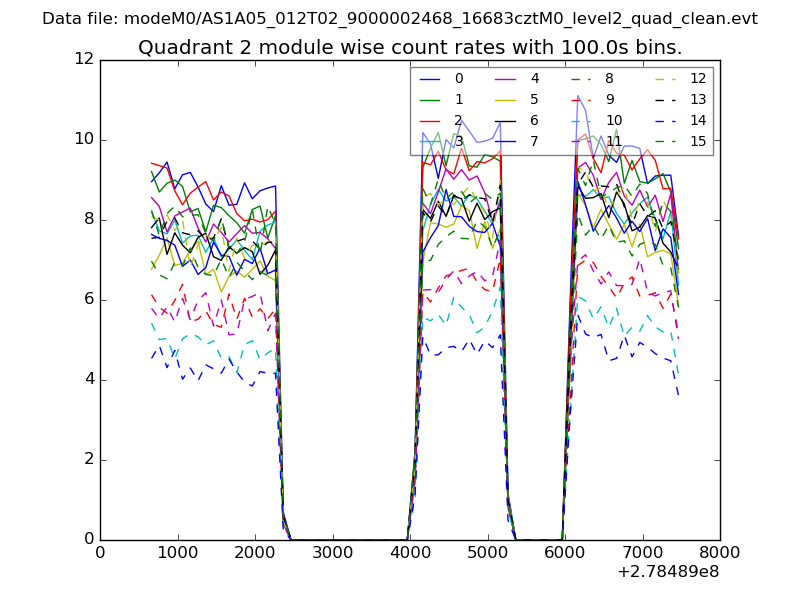
| Module-wise count rates for Quadrant B Data is divided into 100 sec bins |
 |
 |
| Module-wise count rates for Quadrant C Data is divided into 100 sec bins |
 |
 |
| Module-wise count rates for Quadrant D Data is divided into 100 sec bins |
 |
 |
| Parameter | Plot |
|---|---|
| CZT HV Monitor | 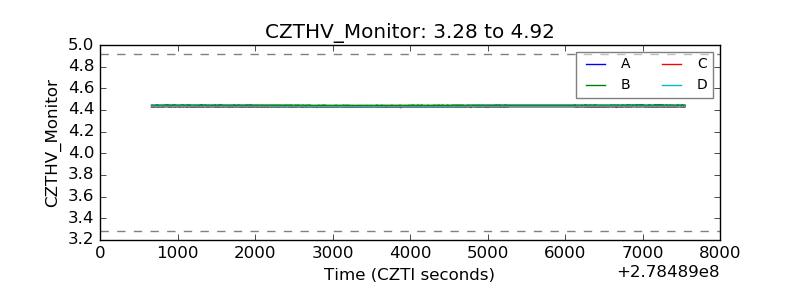 |
| D_VDD | 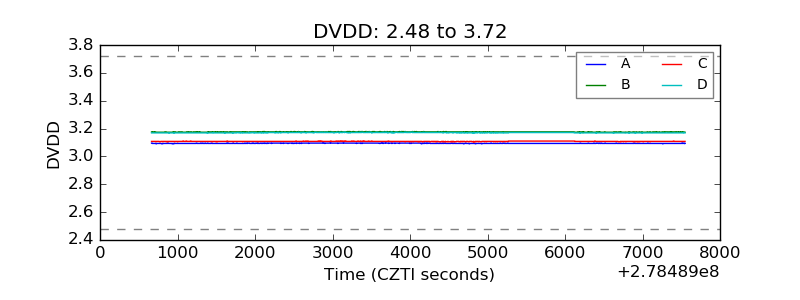 |
| Temperature 1 | 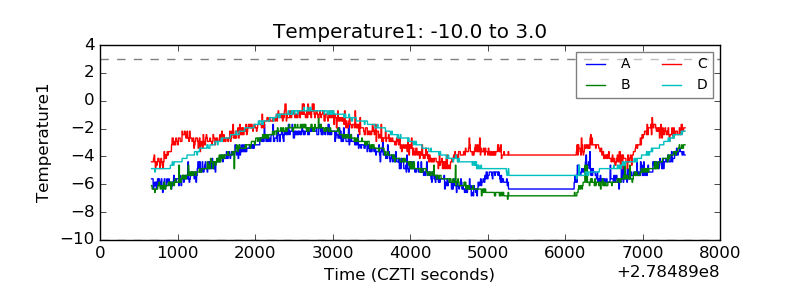 |
| Veto HV Monitor | 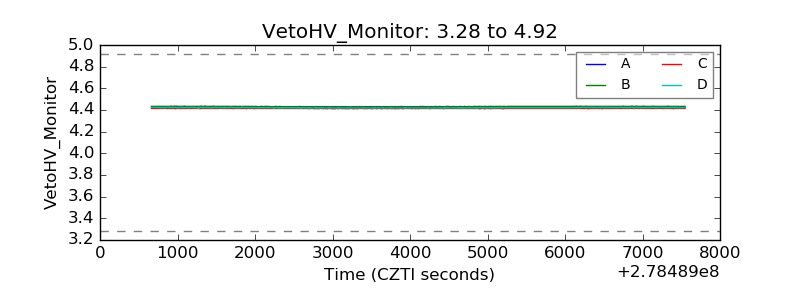 |
| Veto LLD | 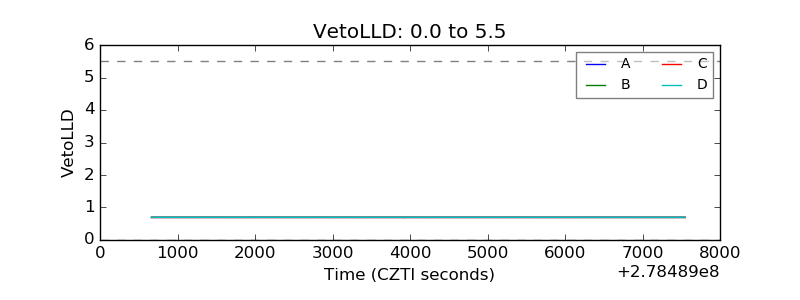 |
| Alpha Counter | 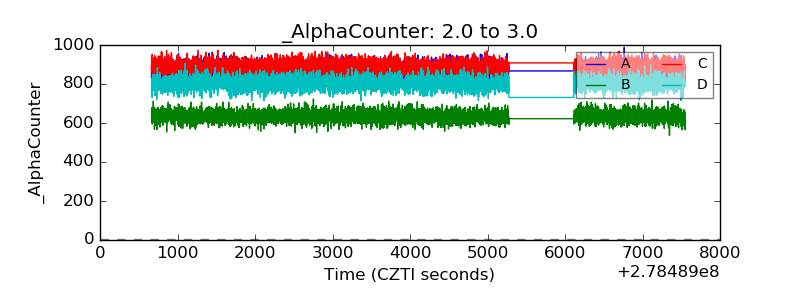 |
| _CPM_Rate | 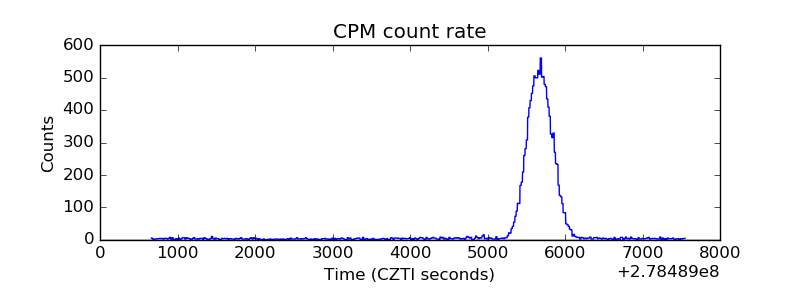 |
| CZT Counter | 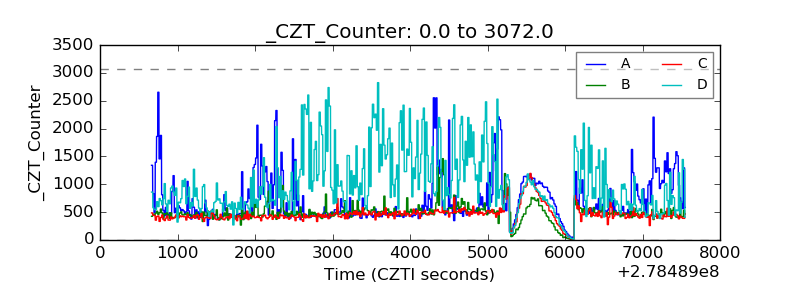 |
| +2.5 Volts monitor |  |
| +5 Volts monitor |  |
| _ROLL_ROT | 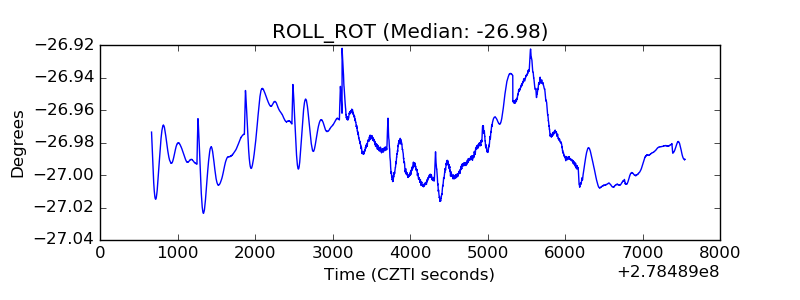 |
| _Roll_DEC |  |
| _Roll_RA | 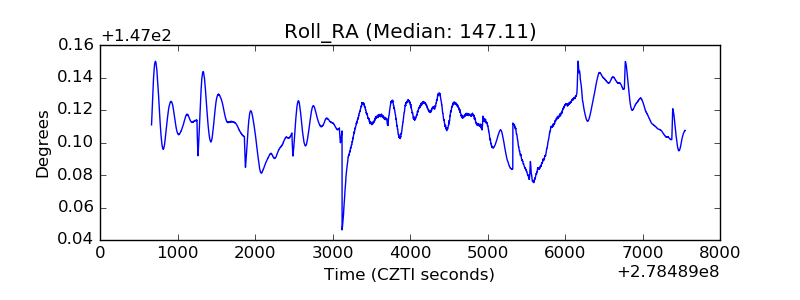 |
| Veto Counter | 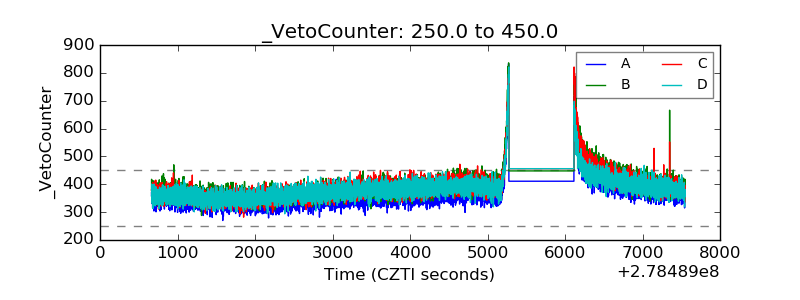 |