| Param | Original file | Final file |
|---|---|---|
| Filename | modeM0/AS1A05_012T02_9000002468_16684cztM0_level2.evt | modeM0/AS1A05_012T02_9000002468_16684cztM0_level2_quad_clean.evt |
| Size (bytes) | 681,984,000 | 87,750,720 |
| Size | 650.4 MB | 83.7 MB |
| Events in quadrant A | 5,097,647 | 545,386 |
| Events in quadrant B | 3,242,478 | 587,548 |
| Events in quadrant C | 2,908,523 | 565,643 |
| Events in quadrant D | 8,982,098 | 520,958 |
| Mode M0 | |||
|---|---|---|---|
| Quadrant | BADHDUFLAG | Total packets | Discarded packets |
| A | 0 | 19250 | 2 |
| B | 0 | 13470 | 1 |
| C | 0 | 12681 | 1 |
| D | 0 | 31062 | 1 |
| Mode M9 | |||
|---|---|---|---|
| Quadrant | BADHDUFLAG | Total packets | Discarded packets |
| A | 0 | 10 | 0 |
| B | 0 | 10 | 0 |
| C | 0 | 10 | 0 |
| D | 0 | 10 | 0 |
| Mode SS | |||
|---|---|---|---|
| Quadrant | BADHDUFLAG | Total packets | Discarded packets |
| A | 0 | 128 | 0 |
| B | 0 | 128 | 0 |
| C | 0 | 128 | 0 |
| D | 0 | 128 | 0 |
| Quadrant | Total seconds | Saturated seconds | Saturation percentage |
|---|---|---|---|
| A | 6262 | 660 | 10.539764% |
| B | 6262 | 69 | 1.101884% |
| C | 6262 | 59 | 0.942191% |
| D | 6262 | 1498 | 23.922070% |
Noise dominated data is calculated using 1-second bins in cleaned event files. If a bin has >2000 counts, and if more than 50% of those come from <1% of pixels, then it is considered to be noise-dominated and hence unusable.
| Quadrant | # 1 sec bins | Bins with >0 counts | Bins with >2000 counts | High rate bins dominated by noise | Noise dominated (total time) | Noise dominated (detector-on time) | Marked lightcurve |
|---|---|---|---|---|---|---|---|
| A | 7278 | 6264 | 464 | 464 | 6.38% | 7.41% | 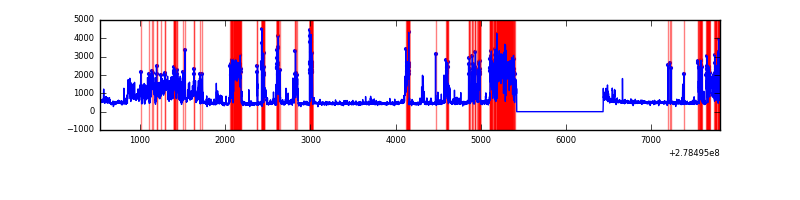 |
| B | 7278 | 6264 | 11 | 11 | 0.15% | 0.18% | 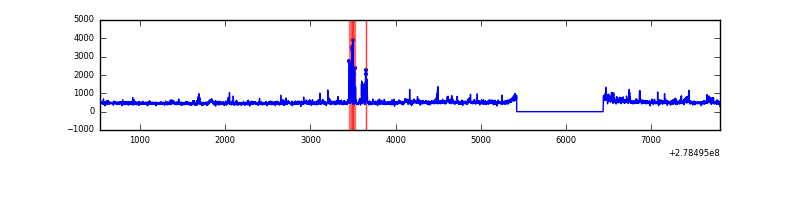 |
| C | 7278 | 6264 | 0 | 0 | 0.00% | 0.00% | 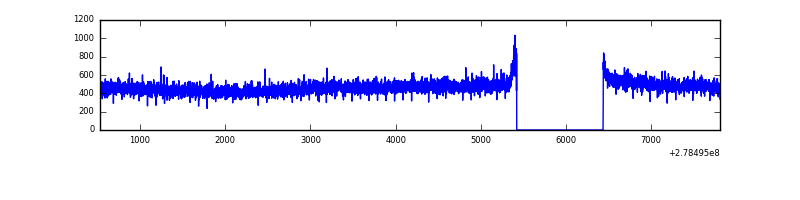 |
| D | 7278 | 6264 | 1277 | 1277 | 17.55% | 20.39% | 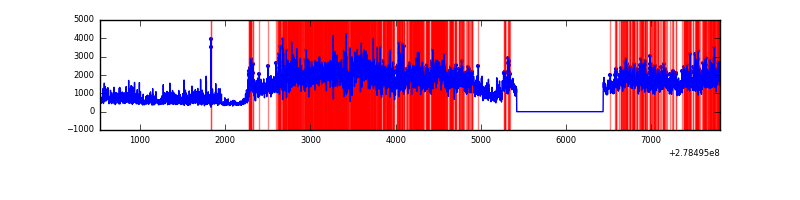 |
Top three noisy pixels from each quadrant. If the there are fewer than three noisy pixels in the level2.evt file, extra rows are filled as -1
| Pixel properties | Quadrant properties | ||||||
|---|---|---|---|---|---|---|---|
| Quadrant | DetID | PixID | Counts | Sigma | Mean | Median | Sigma |
| A | 15 | 174 | 2278969 | 15766.56 | 715 | 699 | 144.5 |
| A | 12 | 96 | 52284 | 356.99 | 715 | 699 | 144.5 |
| A | 3 | 1 | 19736 | 131.74 | 715 | 699 | 144.5 |
| B | 15 | 35 | 151427 | 1061.19 | 741 | 722 | 142.0 |
| B | 0 | 229 | 106614 | 745.64 | 741 | 722 | 142.0 |
| B | 0 | 189 | 63301 | 440.65 | 741 | 722 | 142.0 |
| C | 14 | 238 | 110222 | 660.9 | 710 | 713 | 165.7 |
| C | 3 | 233 | 26596 | 156.21 | 710 | 713 | 165.7 |
| C | 13 | 61 | 5022 | 26.01 | 710 | 713 | 165.7 |
| D | 1 | 52 | 4086038 | 24620.59 | 683 | 662 | 165.9 |
| D | 2 | 16 | 2031085 | 12236.38 | 683 | 662 | 165.9 |
| D | 10 | 70 | 218962 | 1315.59 | 683 | 662 | 165.9 |
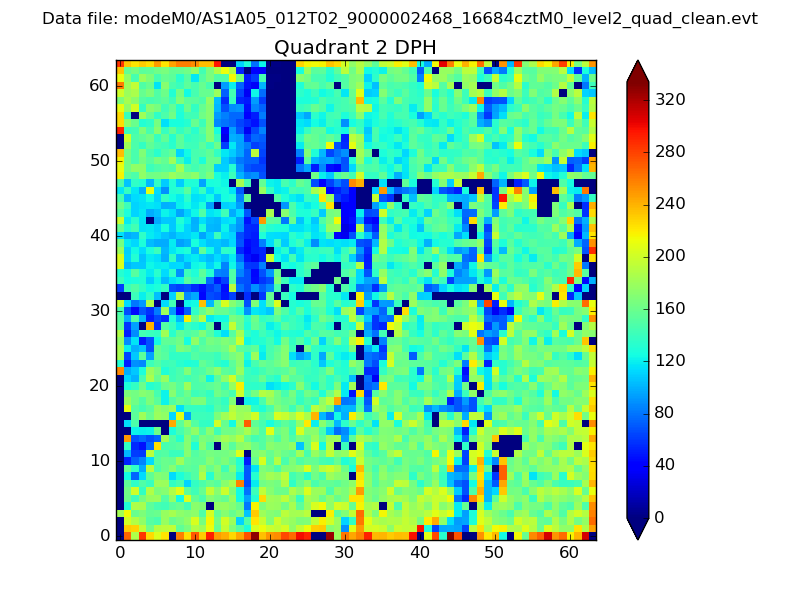
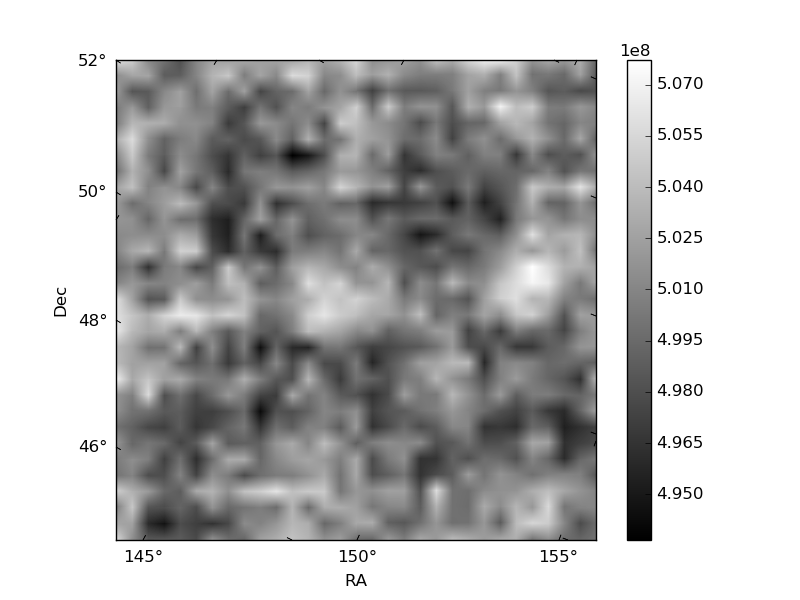
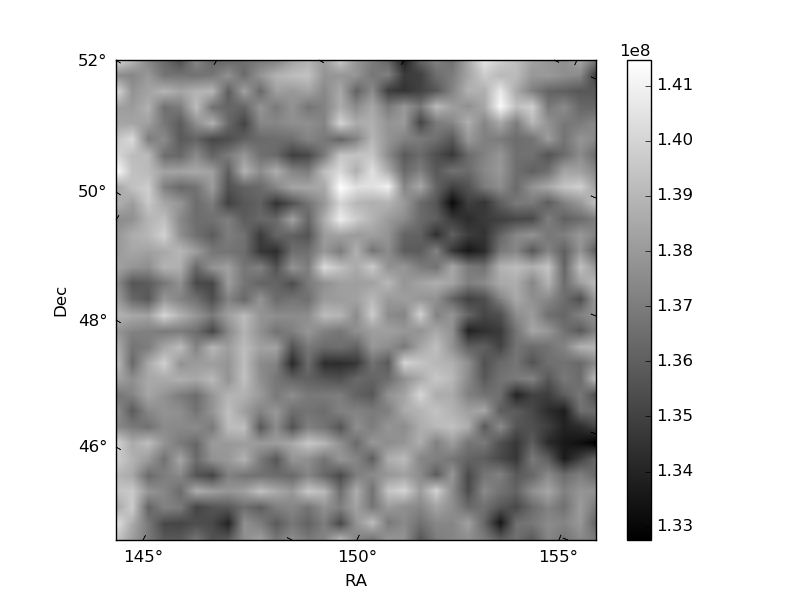
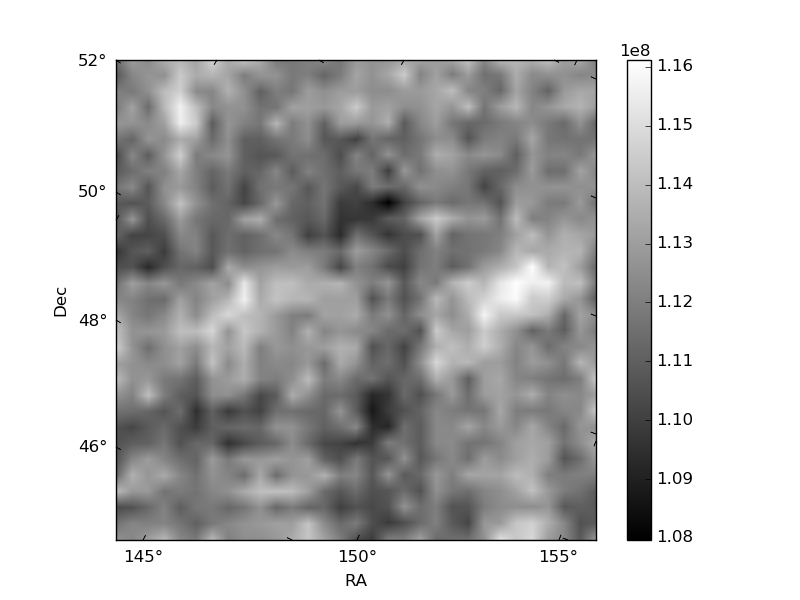
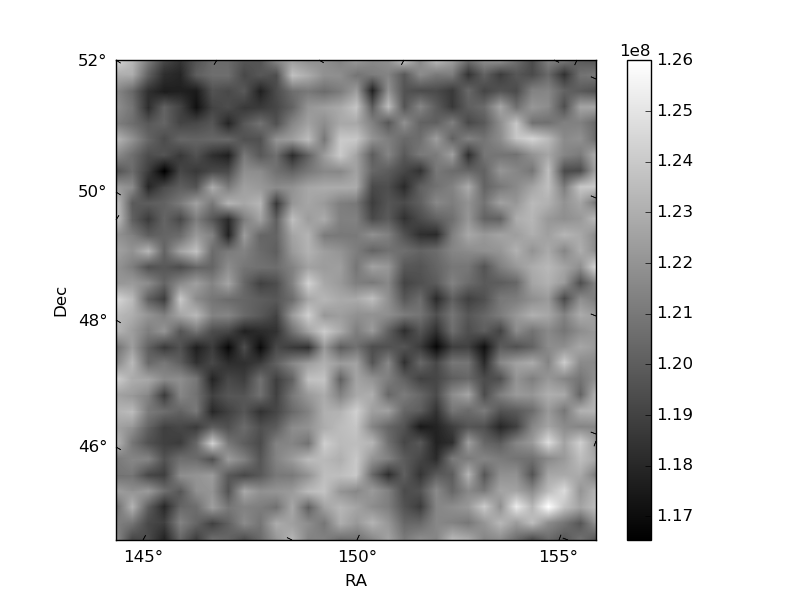
Histogram calculated using DETX and DETY for each event in the final _common_clean file
| Quadrant A | 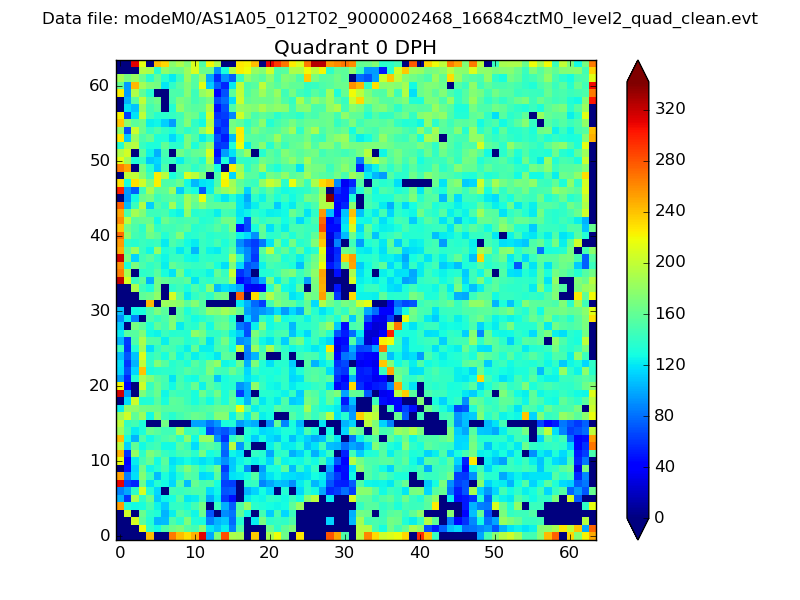 |
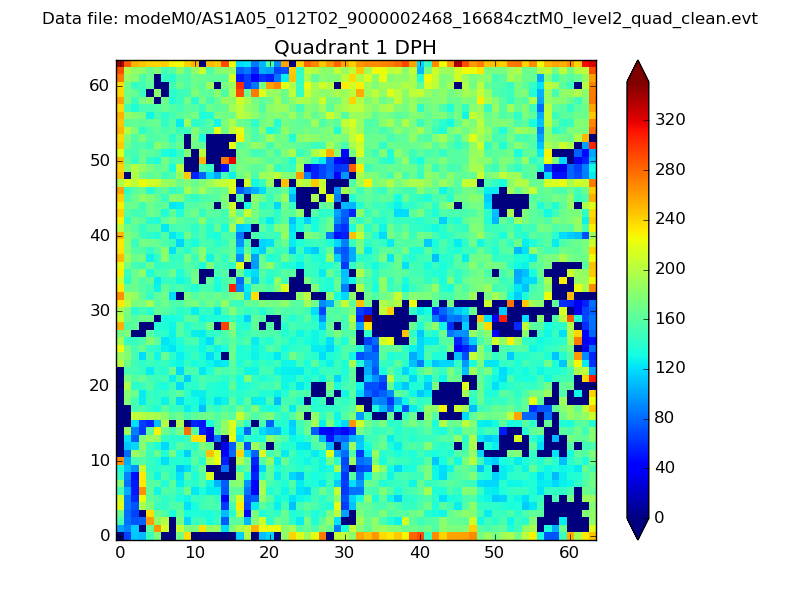 |
Quadrant B |
|---|---|---|---|
| Quadrant D | 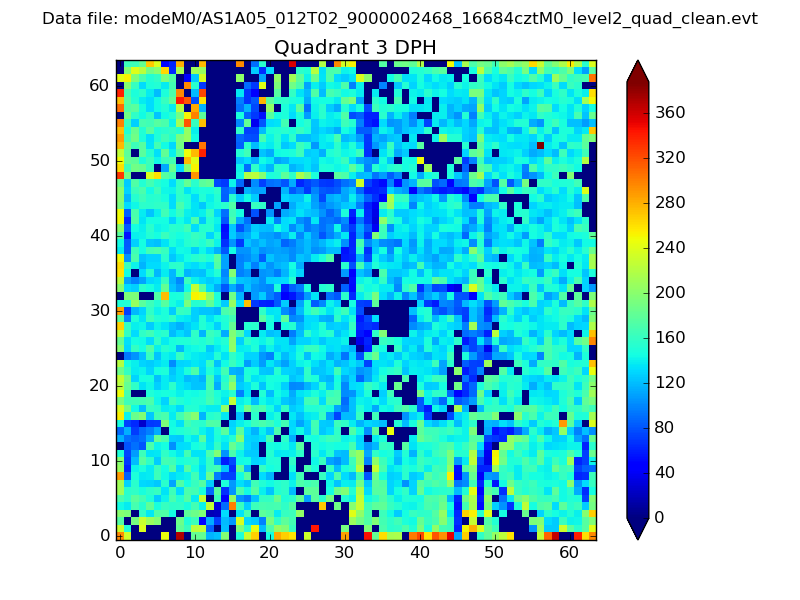 |
 |
Quadrant C |
| Plot type | Count rate plots | Images |
|---|---|---|
| Comparison with Poisson distribution Blue bars denote a histogram of data divided into 1 sec bins. Red curve is a Poisson curve with rate = median count rate of data. |
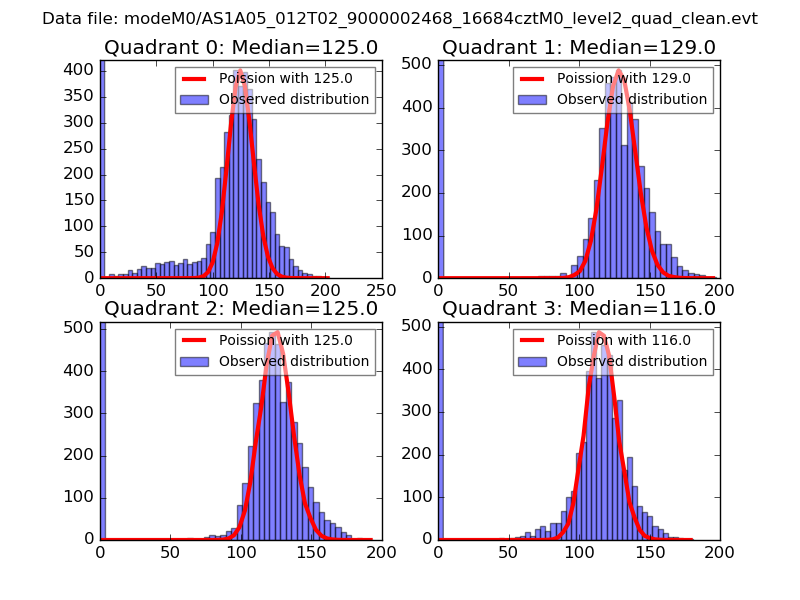 |
 |
| Quadrant-wise count rates Data is divided into 100 sec bins |
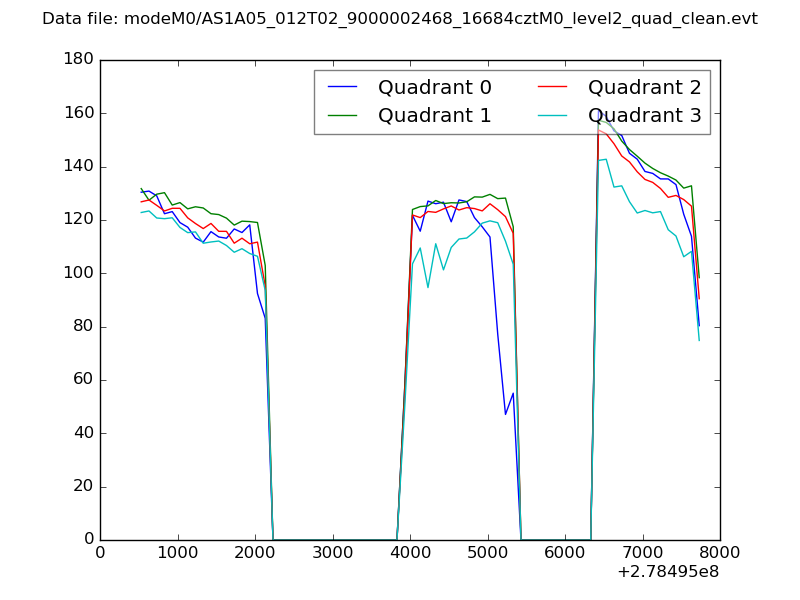 |
|
| Module-wise count rates for Quadrant A Data is divided into 100 sec bins |
 |
 |
| Module-wise count rates for Quadrant B Data is divided into 100 sec bins |
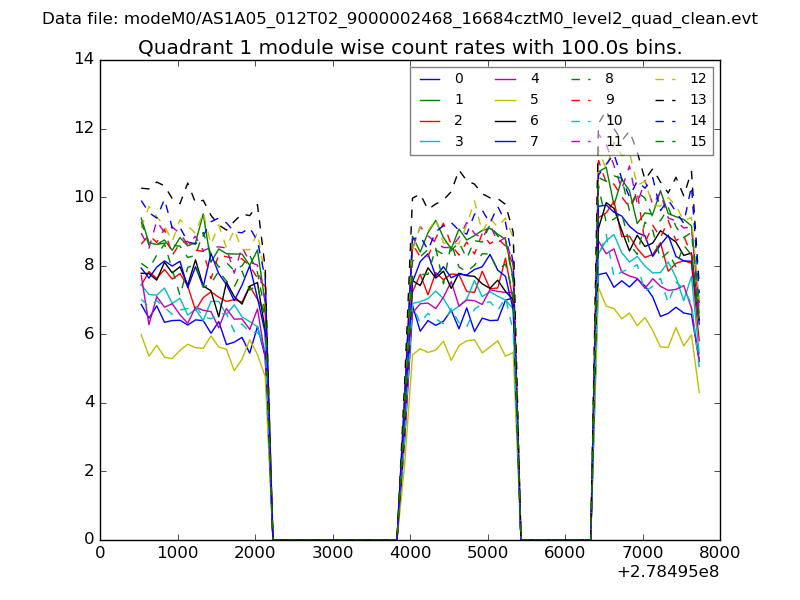 |
 |
| Module-wise count rates for Quadrant C Data is divided into 100 sec bins |
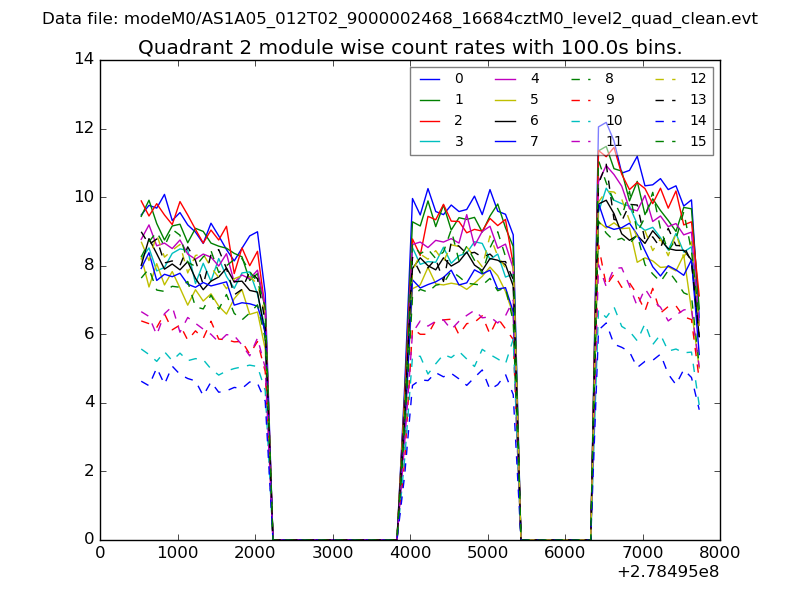 |
 |
| Module-wise count rates for Quadrant D Data is divided into 100 sec bins |
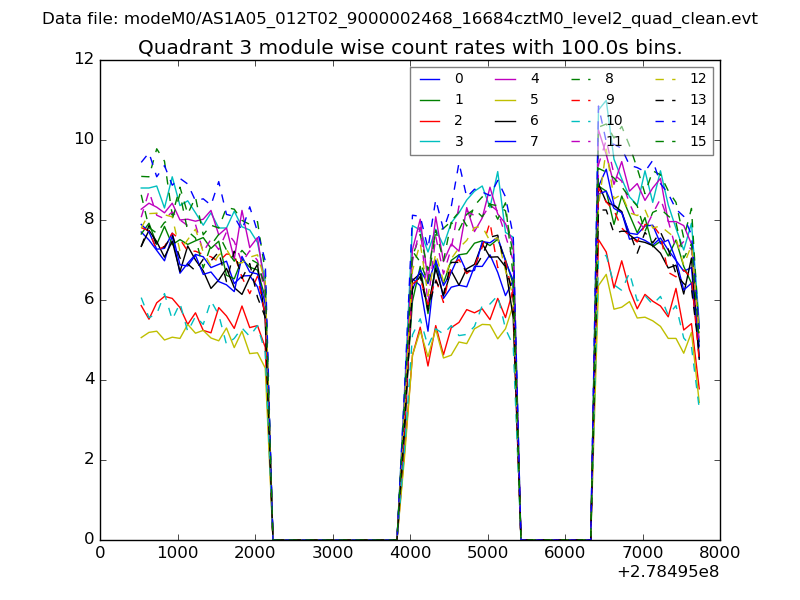 |
 |
| Parameter | Plot |
|---|---|
| CZT HV Monitor | 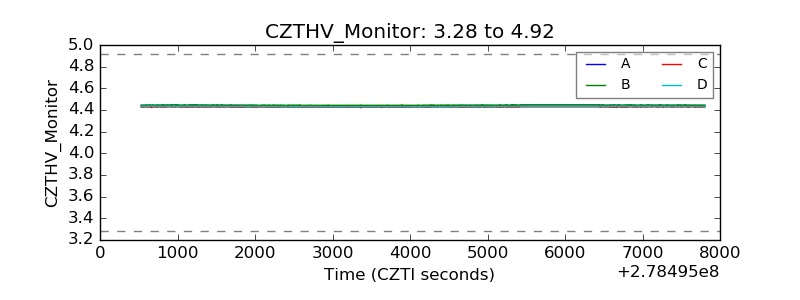 |
| D_VDD |  |
| Temperature 1 |  |
| Veto HV Monitor | 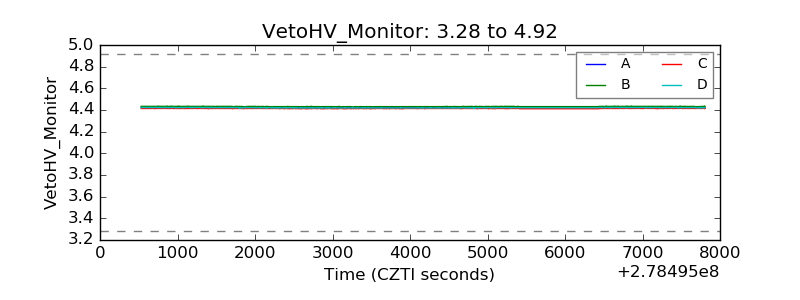 |
| Veto LLD | 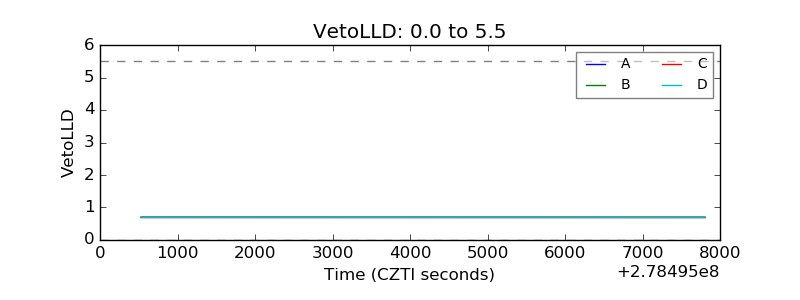 |
| Alpha Counter | 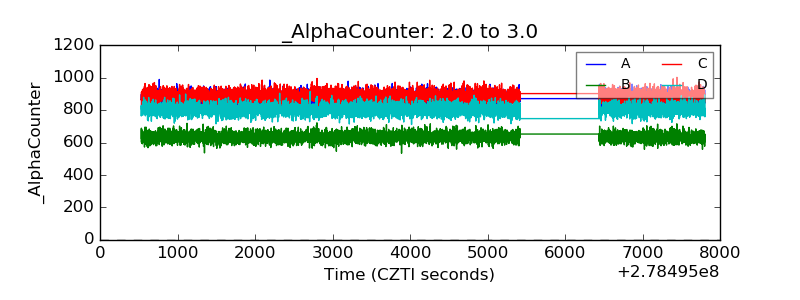 |
| _CPM_Rate | 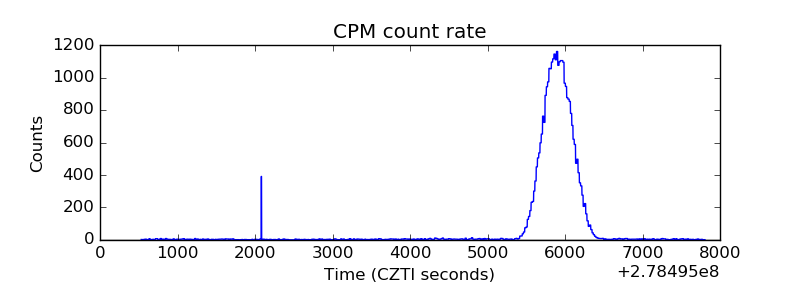 |
| CZT Counter | 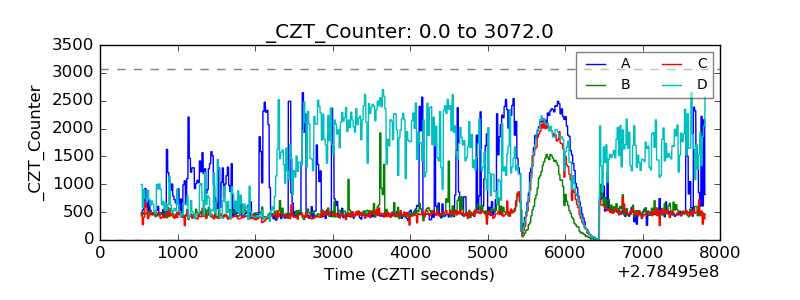 |
| +2.5 Volts monitor |  |
| +5 Volts monitor |  |
| _ROLL_ROT | 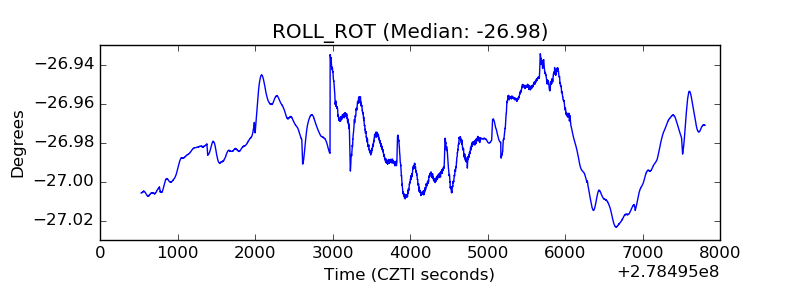 |
| _Roll_DEC |  |
| _Roll_RA | 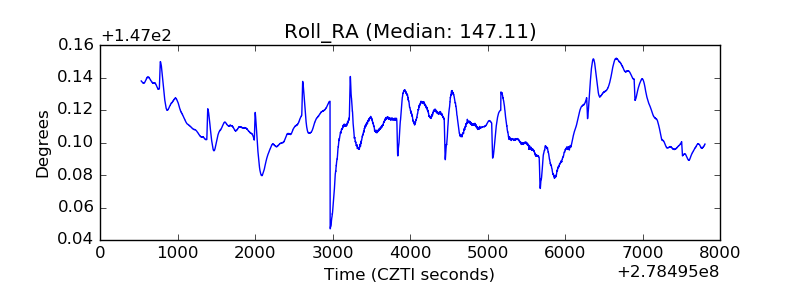 |
| Veto Counter | 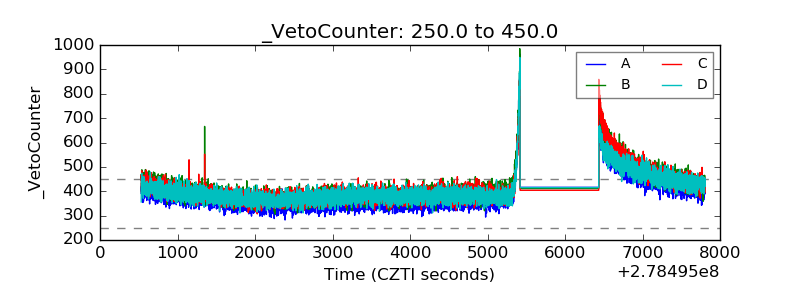 |