| Param | Original file | Final file |
|---|---|---|
| Filename | modeM0/AS1A05_012T02_9000002468_16686cztM0_level2.evt | modeM0/AS1A05_012T02_9000002468_16686cztM0_level2_quad_clean.evt |
| Size (bytes) | 629,763,840 | 81,383,040 |
| Size | 600.6 MB | 77.6 MB |
| Events in quadrant A | 4,886,327 | 502,411 |
| Events in quadrant B | 3,091,512 | 546,112 |
| Events in quadrant C | 2,798,195 | 525,569 |
| Events in quadrant D | 7,908,825 | 488,905 |
| Mode M0 | |||
|---|---|---|---|
| Quadrant | BADHDUFLAG | Total packets | Discarded packets |
| A | 0 | 18249 | 2 |
| B | 0 | 12674 | 1 |
| C | 0 | 11852 | 1 |
| D | 0 | 27543 | 1 |
| Mode M9 | |||
|---|---|---|---|
| Quadrant | BADHDUFLAG | Total packets | Discarded packets |
| A | 0 | 12 | 0 |
| B | 0 | 12 | 0 |
| C | 0 | 12 | 0 |
| D | 0 | 12 | 0 |
| Mode SS | |||
|---|---|---|---|
| Quadrant | BADHDUFLAG | Total packets | Discarded packets |
| A | 0 | 116 | 0 |
| B | 0 | 116 | 0 |
| C | 0 | 116 | 0 |
| D | 0 | 116 | 0 |
| Quadrant | Total seconds | Saturated seconds | Saturation percentage |
|---|---|---|---|
| A | 5738 | 806 | 14.046706% |
| B | 5738 | 62 | 1.080516% |
| C | 5738 | 70 | 1.219937% |
| D | 5738 | 1035 | 18.037644% |
Noise dominated data is calculated using 1-second bins in cleaned event files. If a bin has >2000 counts, and if more than 50% of those come from <1% of pixels, then it is considered to be noise-dominated and hence unusable.
| Quadrant | # 1 sec bins | Bins with >0 counts | Bins with >2000 counts | High rate bins dominated by noise | Noise dominated (total time) | Noise dominated (detector-on time) | Marked lightcurve |
|---|---|---|---|---|---|---|---|
| A | 6879 | 5739 | 584 | 584 | 8.49% | 10.18% | 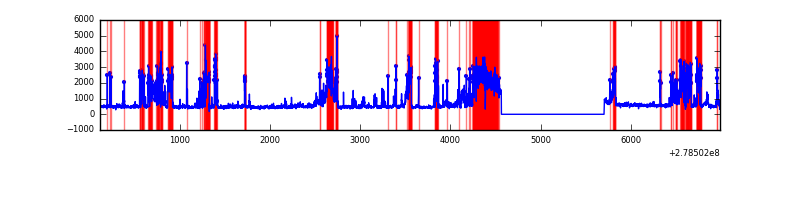 |
| B | 6879 | 5740 | 6 | 6 | 0.09% | 0.10% |  |
| C | 6879 | 5740 | 0 | 0 | 0.00% | 0.00% |  |
| D | 6879 | 5740 | 945 | 945 | 13.74% | 16.46% | 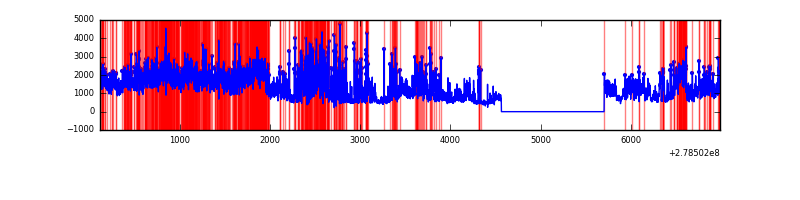 |
Top three noisy pixels from each quadrant. If the there are fewer than three noisy pixels in the level2.evt file, extra rows are filled as -1
| Pixel properties | Quadrant properties | ||||||
|---|---|---|---|---|---|---|---|
| Quadrant | DetID | PixID | Counts | Sigma | Mean | Median | Sigma |
| A | 15 | 174 | 2249847 | 16775.85 | 671 | 660 | 134.1 |
| A | 12 | 96 | 39091 | 286.64 | 671 | 660 | 134.1 |
| A | 9 | 143 | 10865 | 76.12 | 671 | 660 | 134.1 |
| B | 15 | 35 | 190267 | 1413.08 | 703 | 686 | 134.2 |
| B | 0 | 229 | 106406 | 788.01 | 703 | 686 | 134.2 |
| B | 0 | 189 | 20713 | 149.28 | 703 | 686 | 134.2 |
| C | 14 | 238 | 105775 | 669.8 | 677 | 682 | 156.9 |
| C | 3 | 233 | 43698 | 274.16 | 677 | 682 | 156.9 |
| C | 7 | 247 | 8111 | 47.35 | 677 | 682 | 156.9 |
| D | 1 | 52 | 3942919 | 24812.08 | 658 | 639 | 158.9 |
| D | 2 | 16 | 1185853 | 7459.55 | 658 | 639 | 158.9 |
| D | 15 | 0 | 129511 | 811.1 | 658 | 639 | 158.9 |
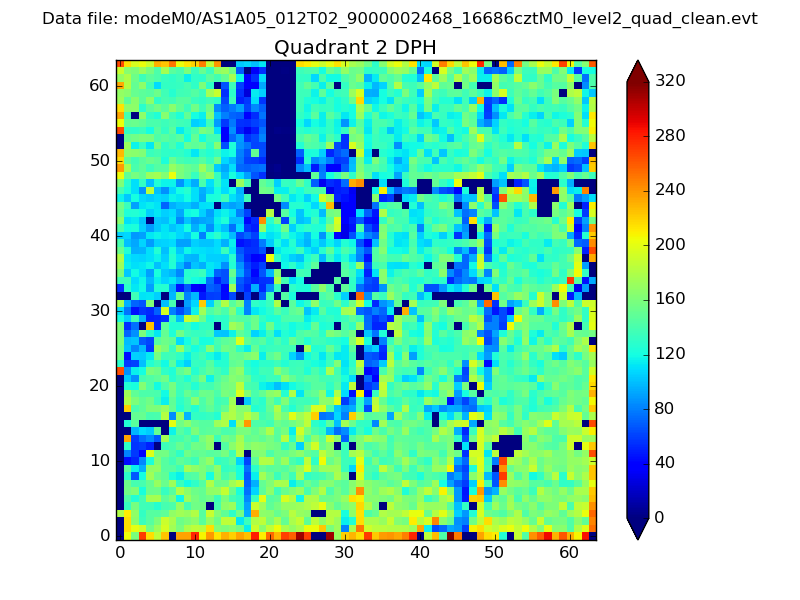
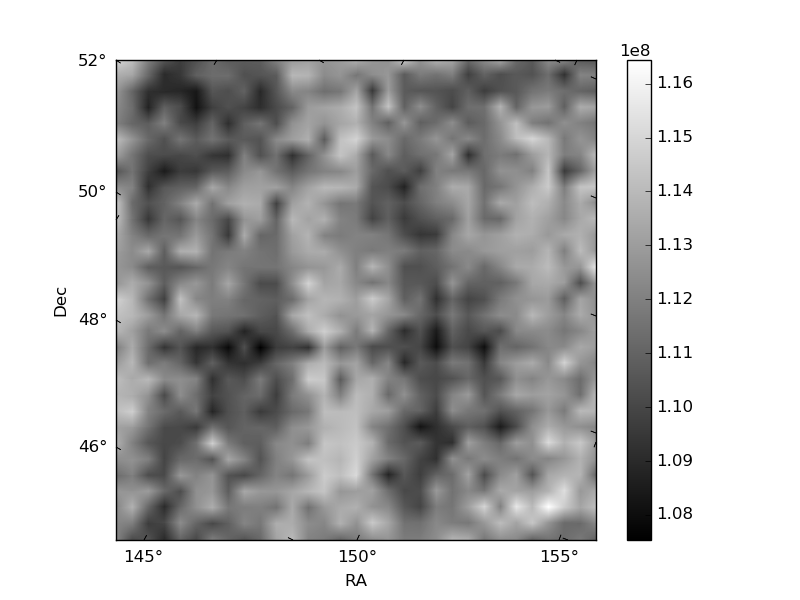
Histogram calculated using DETX and DETY for each event in the final _common_clean file
| Quadrant A | 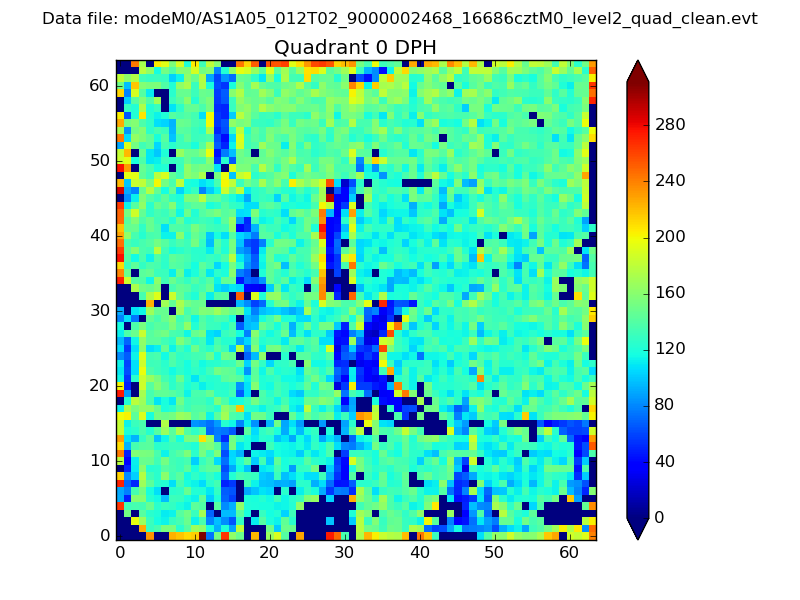 |
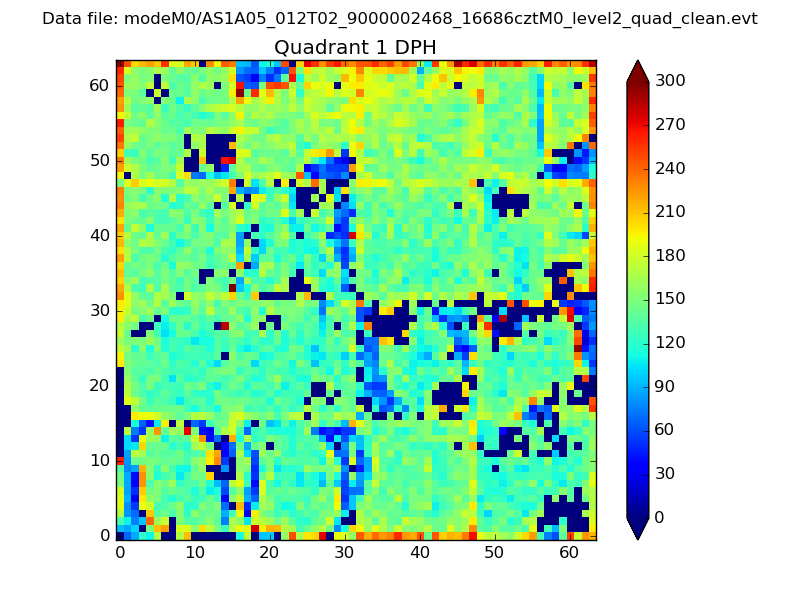 |
Quadrant B |
|---|---|---|---|
| Quadrant D | 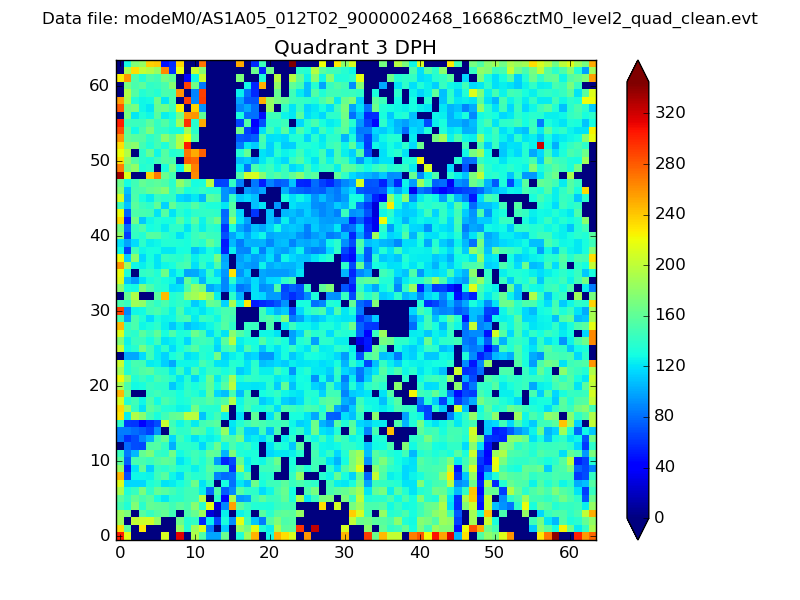 |
 |
Quadrant C |
| Plot type | Count rate plots | Images |
|---|---|---|
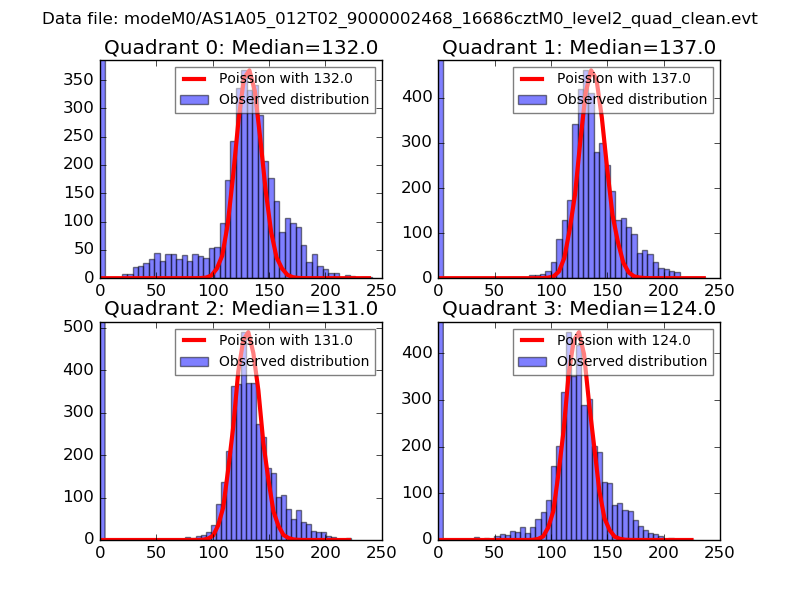
| Comparison with Poisson distribution Blue bars denote a histogram of data divided into 1 sec bins. Red curve is a Poisson curve with rate = median count rate of data. |
 |
 |
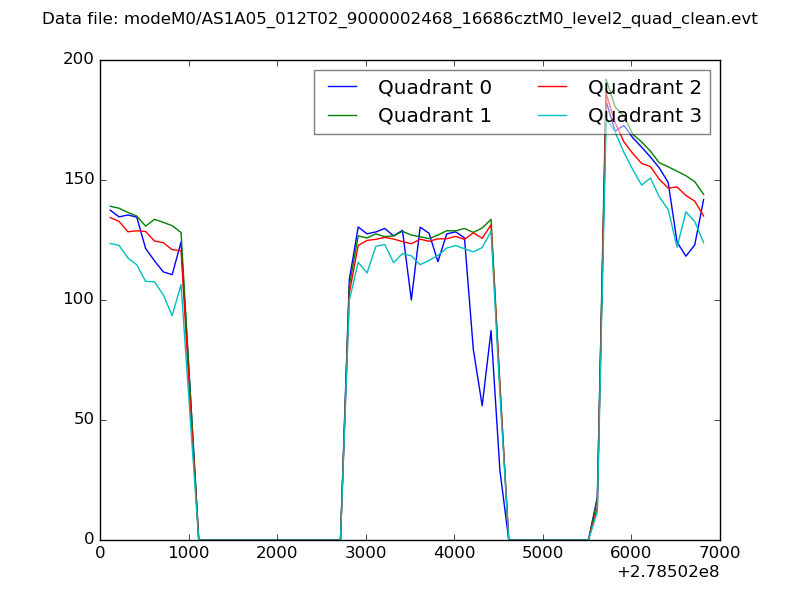
| Quadrant-wise count rates Data is divided into 100 sec bins |
 |
|
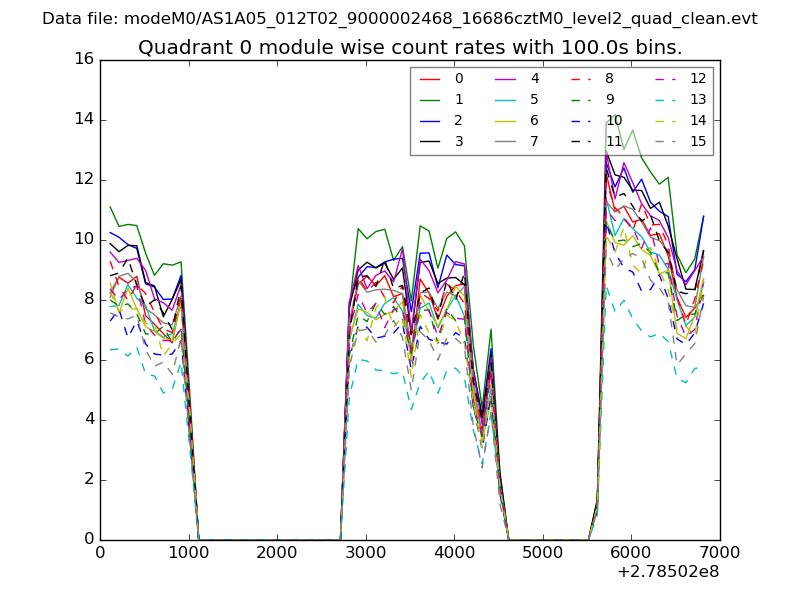
| Module-wise count rates for Quadrant A Data is divided into 100 sec bins |
 |
 |
| Module-wise count rates for Quadrant B Data is divided into 100 sec bins |
 |
 |
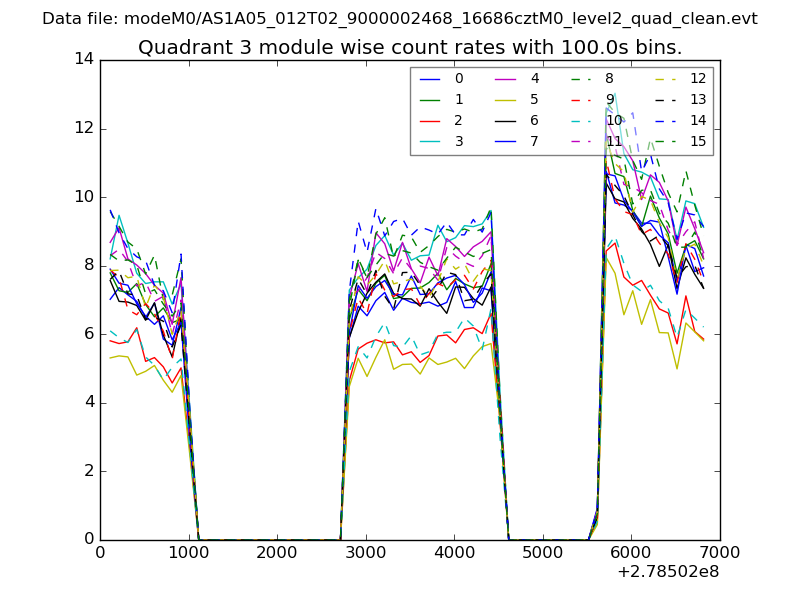
| Module-wise count rates for Quadrant C Data is divided into 100 sec bins |
 |
 |
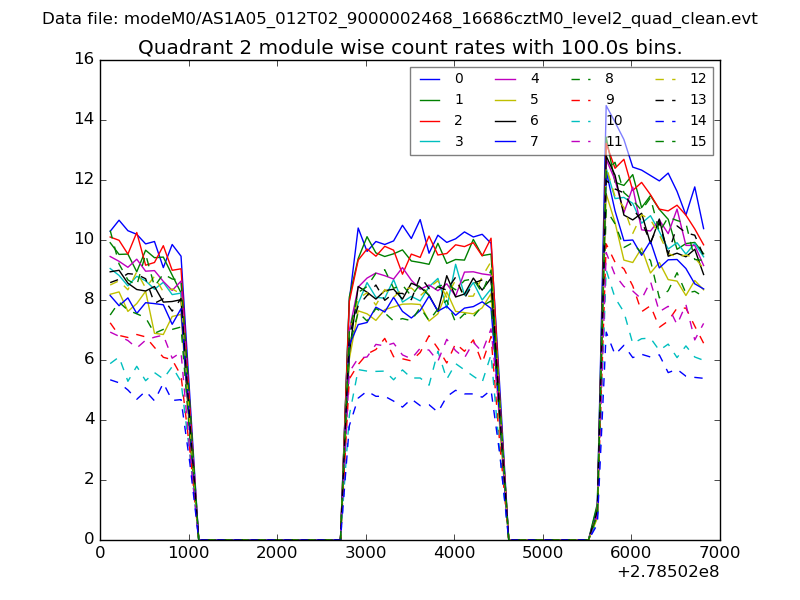
| Module-wise count rates for Quadrant D Data is divided into 100 sec bins |
 |
 |
| Parameter | Plot |
|---|---|
| CZT HV Monitor |  |
| D_VDD | 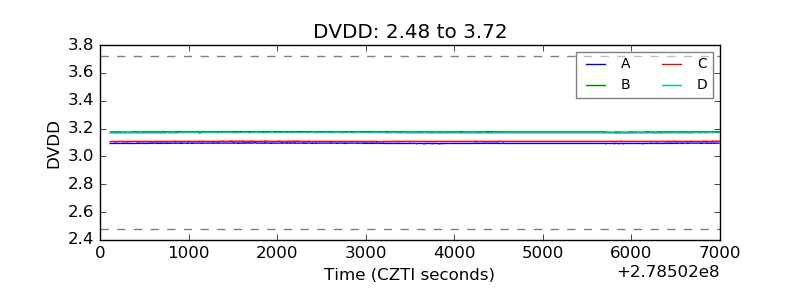 |
| Temperature 1 |  |
| Veto HV Monitor | 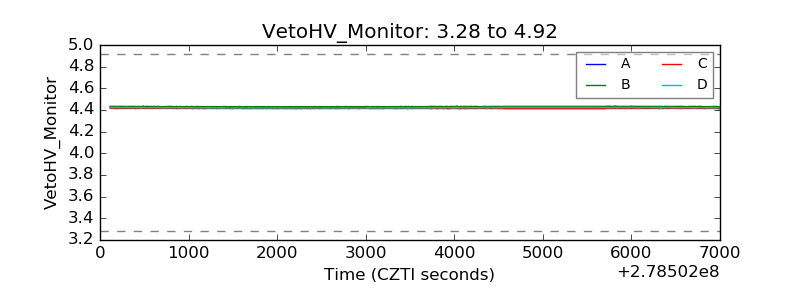 |
| Veto LLD |  |
| Alpha Counter | 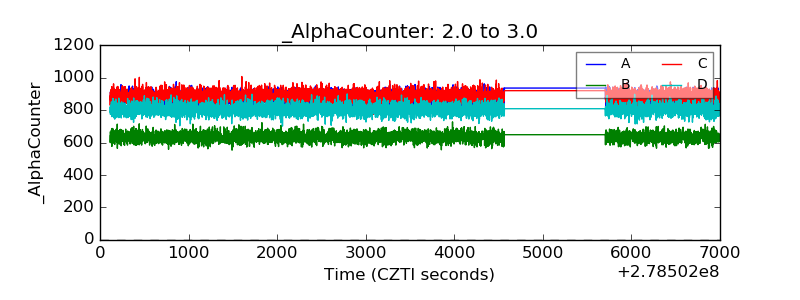 |
| _CPM_Rate | 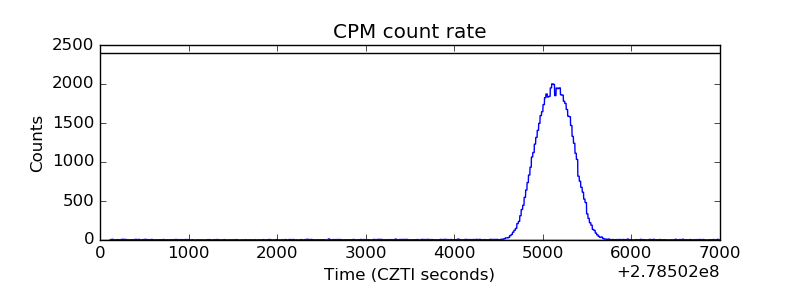 |
| CZT Counter | 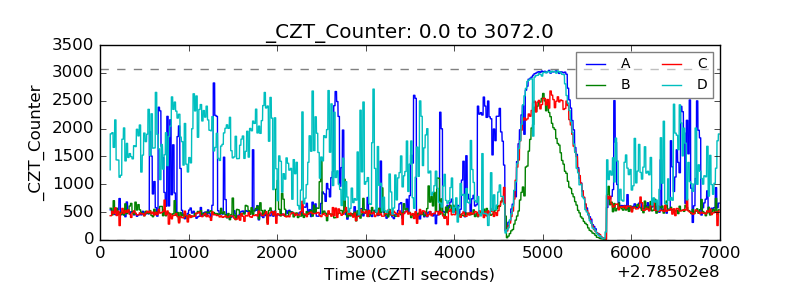 |
| +2.5 Volts monitor |  |
| +5 Volts monitor |  |
| _ROLL_ROT | 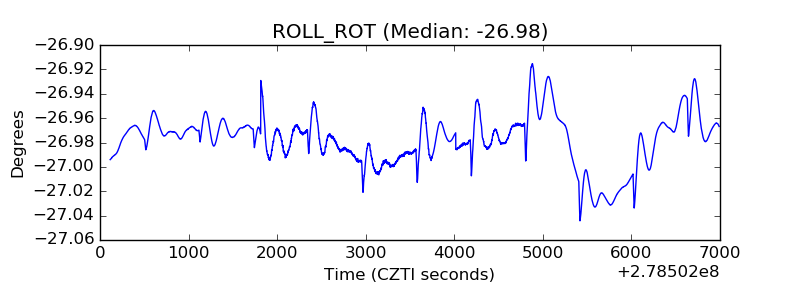 |
| _Roll_DEC | 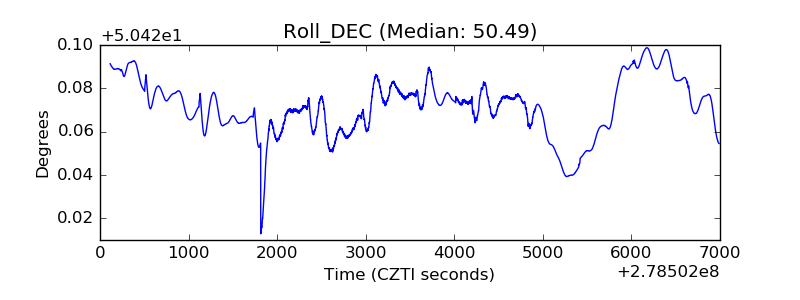 |
| _Roll_RA | 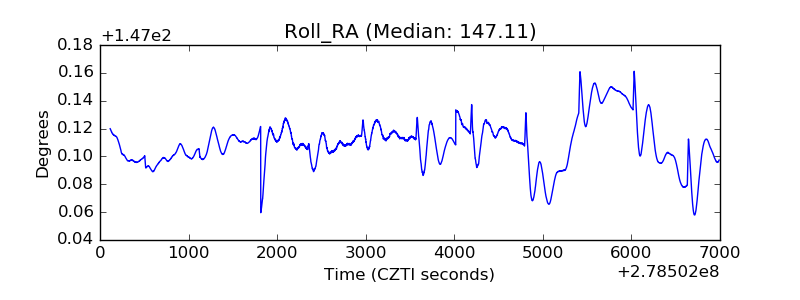 |
| Veto Counter | 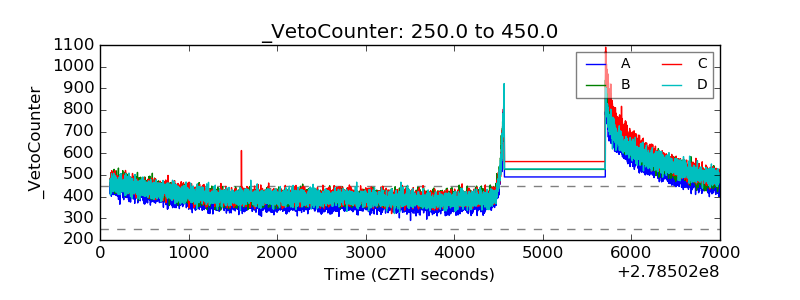 |