| Param | Original file | Final file |
|---|---|---|
| Filename | modeM0/AS1A05_012T02_9000002468_16687cztM0_level2.evt | modeM0/AS1A05_012T02_9000002468_16687cztM0_level2_quad_clean.evt |
| Size (bytes) | 720,178,560 | 82,321,920 |
| Size | 686.8 MB | 78.5 MB |
| Events in quadrant A | 5,657,187 | 529,177 |
| Events in quadrant B | 3,319,269 | 550,498 |
| Events in quadrant C | 2,956,660 | 533,295 |
| Events in quadrant D | 9,484,134 | 472,028 |
| Mode M0 | |||
|---|---|---|---|
| Quadrant | BADHDUFLAG | Total packets | Discarded packets |
| A | 0 | 20737 | 2 |
| B | 0 | 13435 | 1 |
| C | 0 | 12334 | 1 |
| D | 0 | 32273 | 1 |
| Mode M9 | |||
|---|---|---|---|
| Quadrant | BADHDUFLAG | Total packets | Discarded packets |
| A | 0 | 14 | 0 |
| B | 0 | 14 | 0 |
| C | 0 | 14 | 0 |
| D | 0 | 14 | 0 |
| Mode SS | |||
|---|---|---|---|
| Quadrant | BADHDUFLAG | Total packets | Discarded packets |
| A | 0 | 116 | 0 |
| B | 0 | 116 | 0 |
| C | 0 | 116 | 0 |
| D | 0 | 116 | 0 |
| Quadrant | Total seconds | Saturated seconds | Saturation percentage |
|---|---|---|---|
| A | 5838 | 1033 | 17.694416% |
| B | 5838 | 28 | 0.479616% |
| C | 5838 | 32 | 0.548133% |
| D | 5838 | 1840 | 31.517643% |
Noise dominated data is calculated using 1-second bins in cleaned event files. If a bin has >2000 counts, and if more than 50% of those come from <1% of pixels, then it is considered to be noise-dominated and hence unusable.
| Quadrant | # 1 sec bins | Bins with >0 counts | Bins with >2000 counts | High rate bins dominated by noise | Noise dominated (total time) | Noise dominated (detector-on time) | Marked lightcurve |
|---|---|---|---|---|---|---|---|
| A | 7149 | 5840 | 756 | 756 | 10.57% | 12.95% | 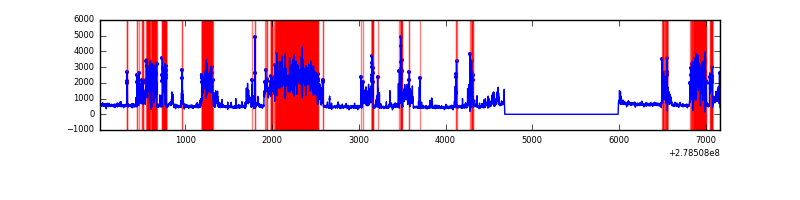 |
| B | 7149 | 5840 | 7 | 7 | 0.10% | 0.12% | 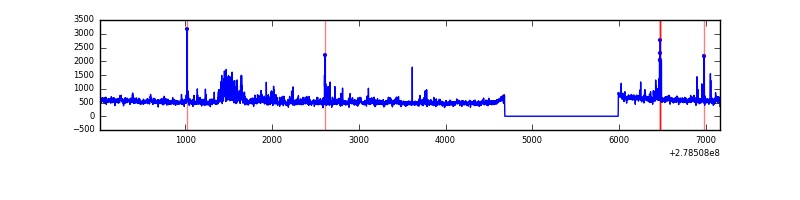 |
| C | 7149 | 5840 | 0 | 0 | 0.00% | 0.00% | 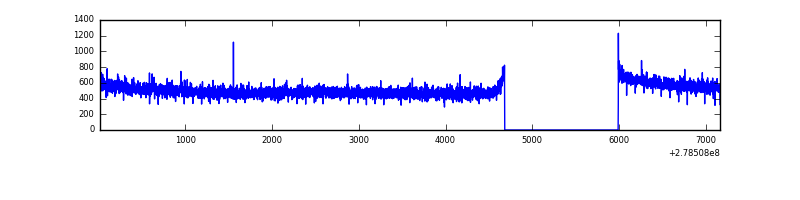 |
| D | 7149 | 5840 | 1665 | 1665 | 23.29% | 28.51% | 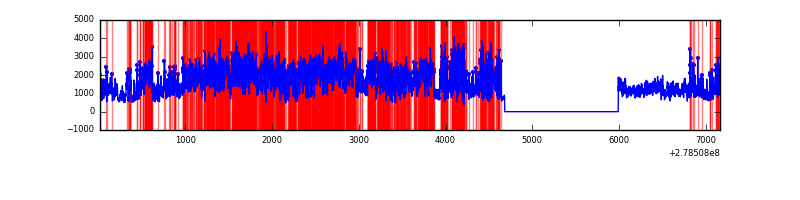 |
Top three noisy pixels from each quadrant. If the there are fewer than three noisy pixels in the level2.evt file, extra rows are filled as -1
| Pixel properties | Quadrant properties | ||||||
|---|---|---|---|---|---|---|---|
| Quadrant | DetID | PixID | Counts | Sigma | Mean | Median | Sigma |
| A | 15 | 174 | 2851267 | 20130.27 | 713 | 700 | 141.6 |
| A | 12 | 96 | 31860 | 220.05 | 713 | 700 | 141.6 |
| A | 9 | 143 | 17515 | 118.74 | 713 | 700 | 141.6 |
| B | 15 | 35 | 188472 | 1333.02 | 747 | 727 | 140.8 |
| B | 0 | 229 | 134409 | 949.16 | 747 | 727 | 140.8 |
| B | 0 | 189 | 25833 | 178.26 | 747 | 727 | 140.8 |
| C | 14 | 238 | 112712 | 670.71 | 724 | 730 | 167.0 |
| C | 3 | 233 | 16943 | 97.11 | 724 | 730 | 167.0 |
| C | 7 | 247 | 6530 | 34.74 | 724 | 730 | 167.0 |
| D | 2 | 16 | 4432783 | 27089.29 | 679 | 660 | 163.6 |
| D | 1 | 52 | 2069993 | 12647.84 | 679 | 660 | 163.6 |
| D | 5 | 222 | 219917 | 1340.11 | 679 | 660 | 163.6 |
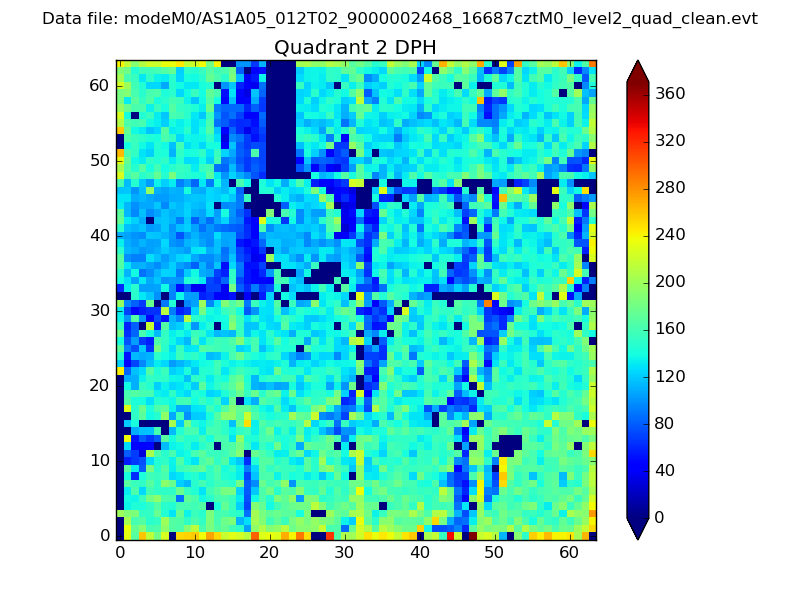
Histogram calculated using DETX and DETY for each event in the final _common_clean file
| Quadrant A | 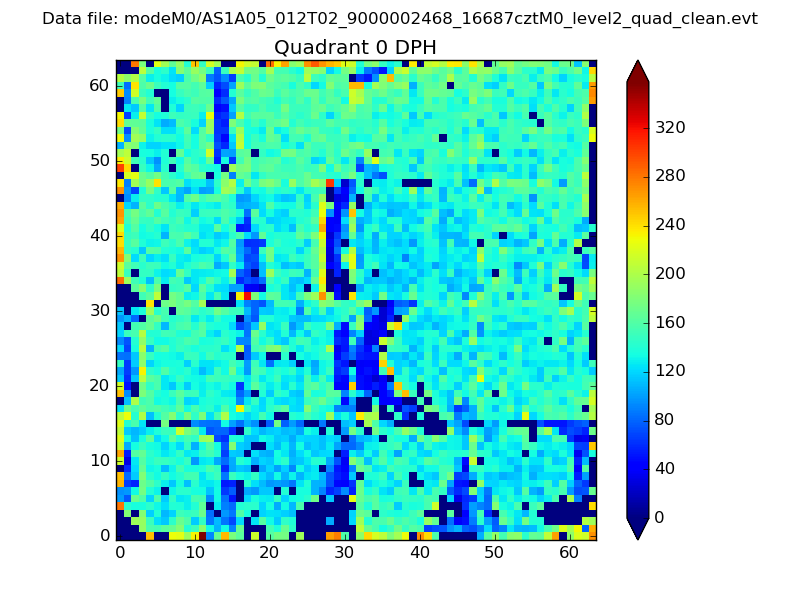 |
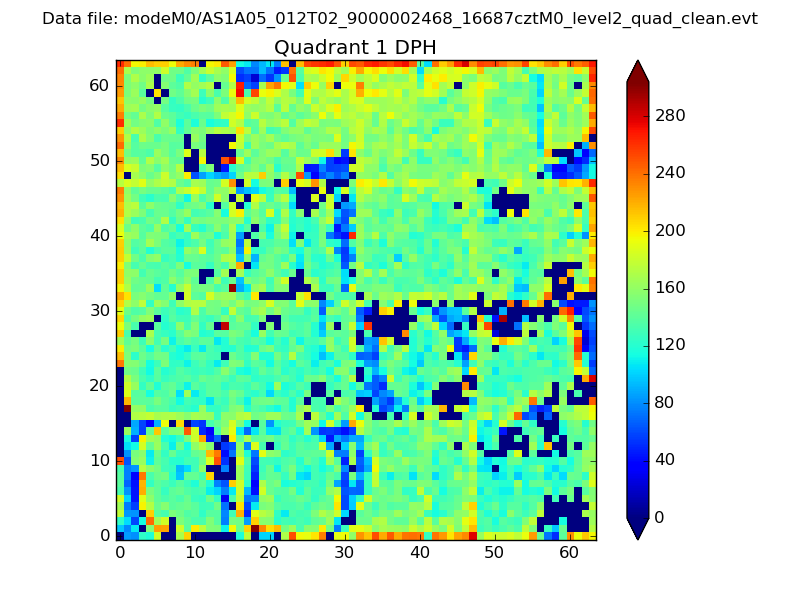 |
Quadrant B |
|---|---|---|---|
| Quadrant D | 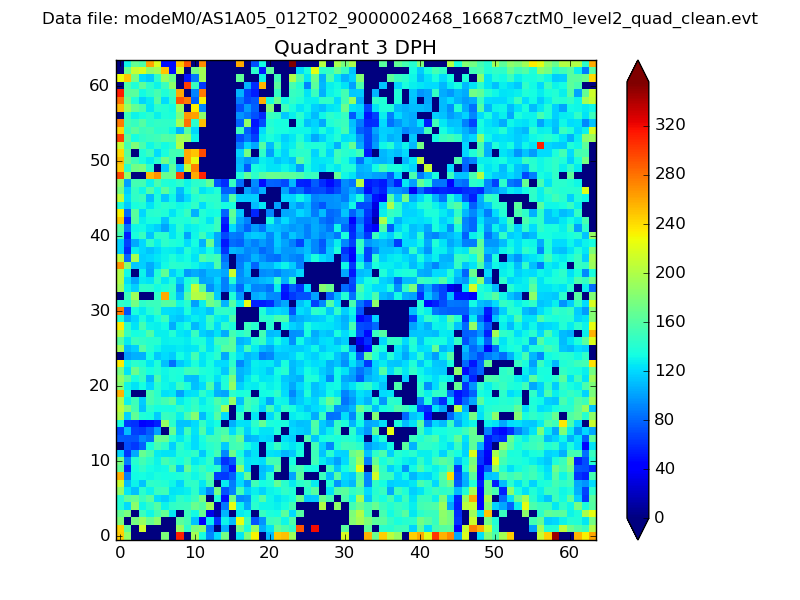 |
 |
Quadrant C |
| Plot type | Count rate plots | Images |
|---|---|---|
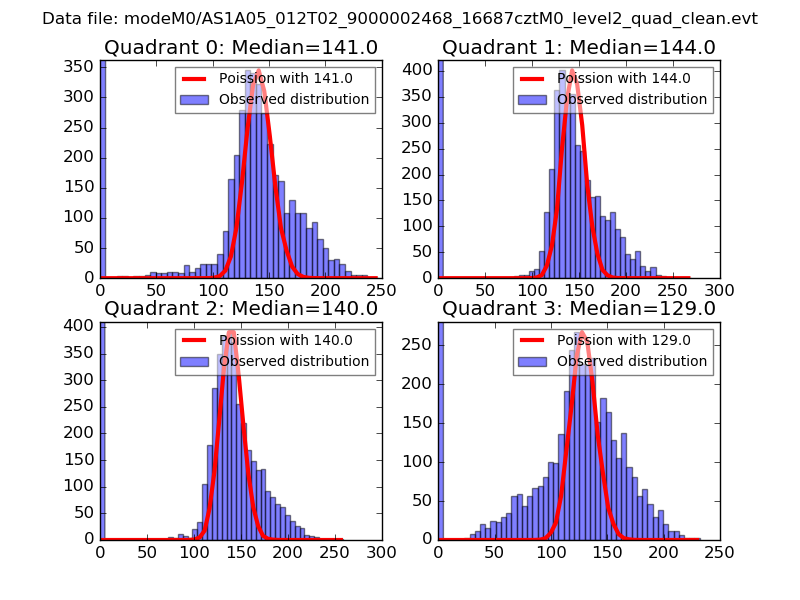
| Comparison with Poisson distribution Blue bars denote a histogram of data divided into 1 sec bins. Red curve is a Poisson curve with rate = median count rate of data. |
 |
 |
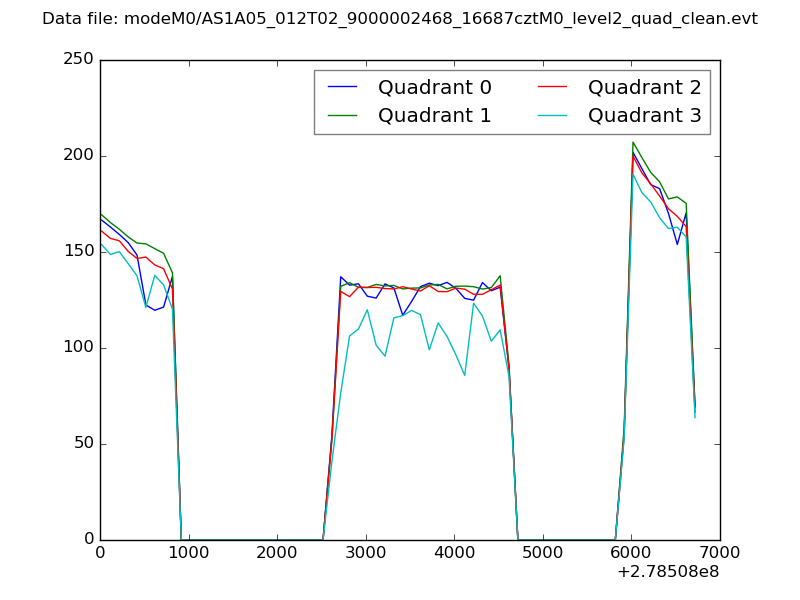
| Quadrant-wise count rates Data is divided into 100 sec bins |
 |
|
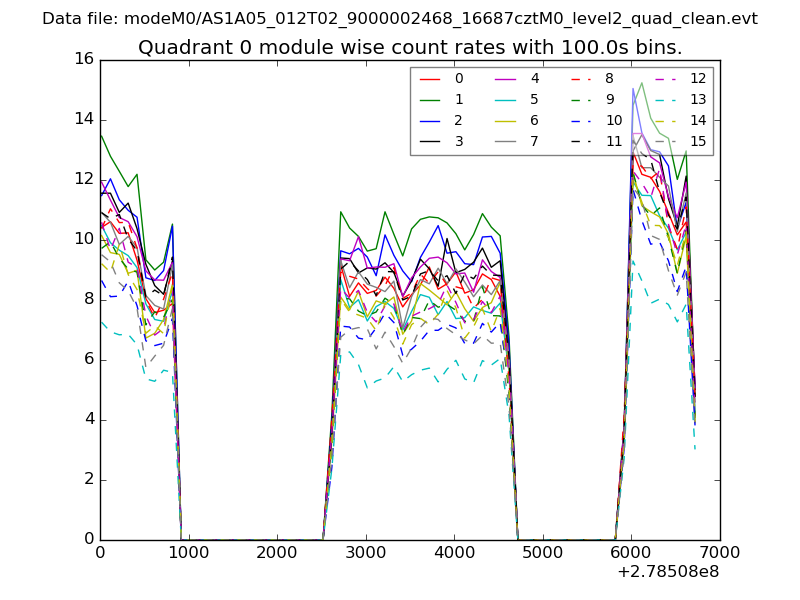
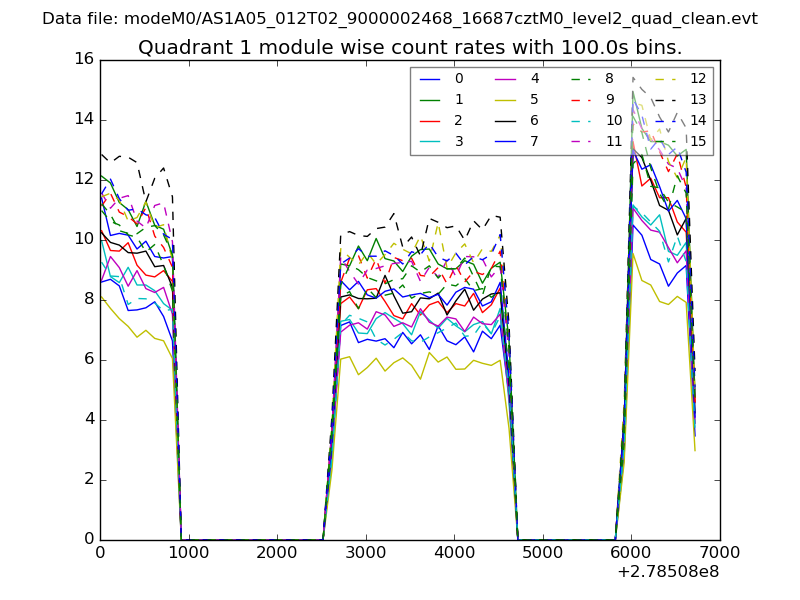
| Module-wise count rates for Quadrant A Data is divided into 100 sec bins |
 |
 |
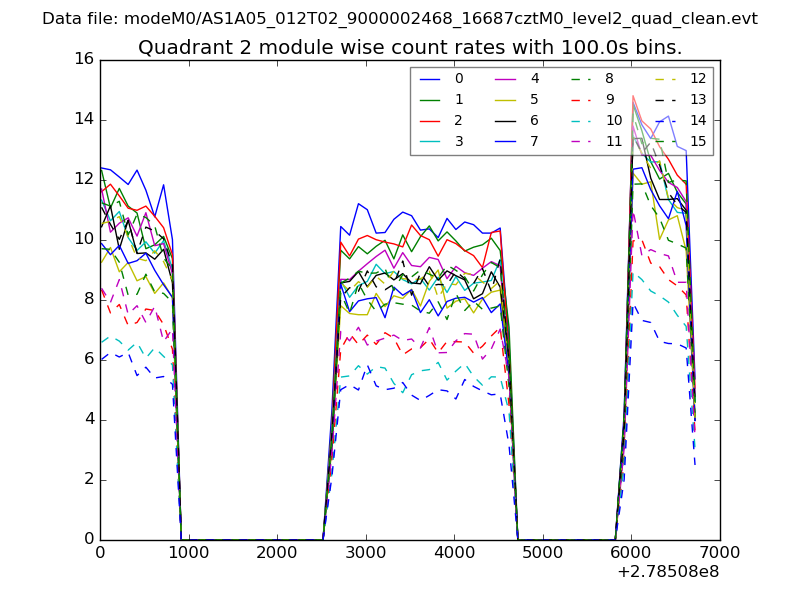
| Module-wise count rates for Quadrant B Data is divided into 100 sec bins |
 |
 |
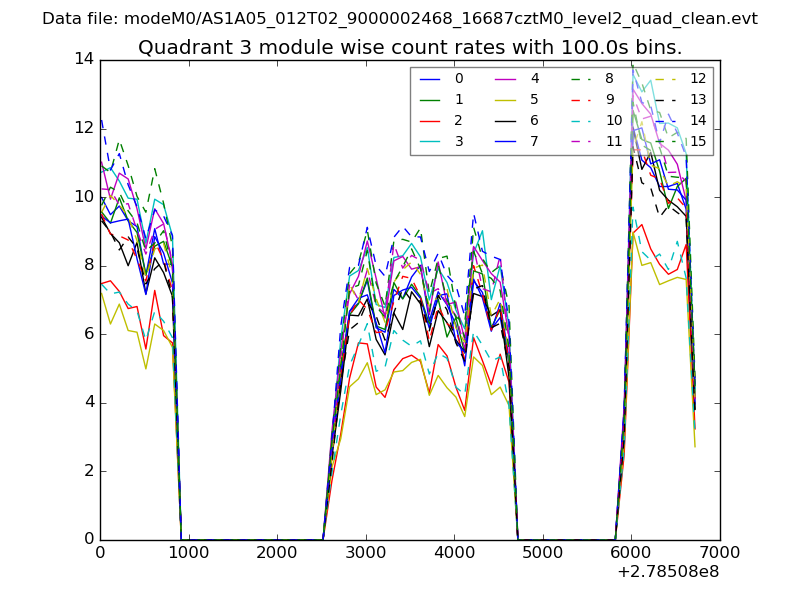
| Module-wise count rates for Quadrant C Data is divided into 100 sec bins |
 |
 |
| Module-wise count rates for Quadrant D Data is divided into 100 sec bins |
 |
 |
| Parameter | Plot |
|---|---|
| CZT HV Monitor | 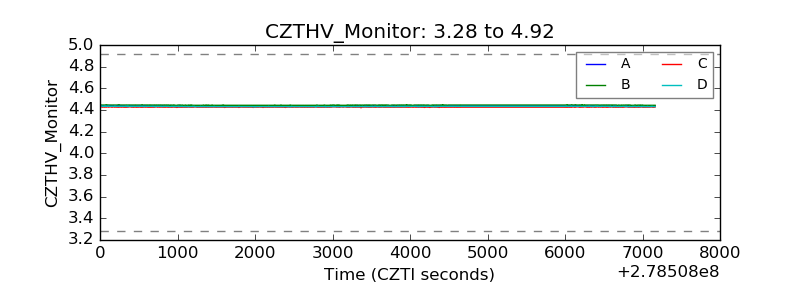 |
| D_VDD | 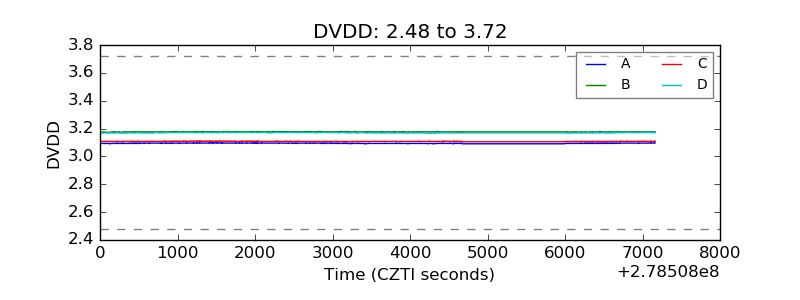 |
| Temperature 1 |  |
| Veto HV Monitor | 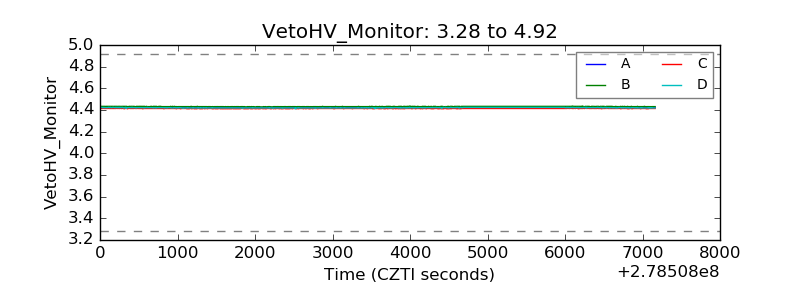 |
| Veto LLD | 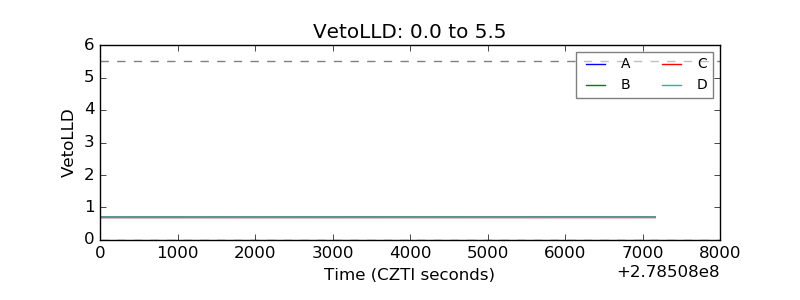 |
| Alpha Counter | 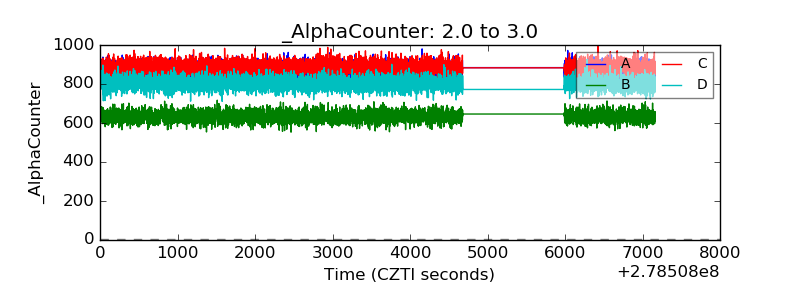 |
| _CPM_Rate | 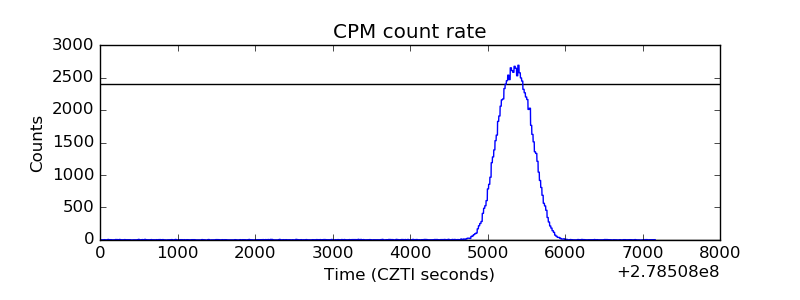 |
| CZT Counter | 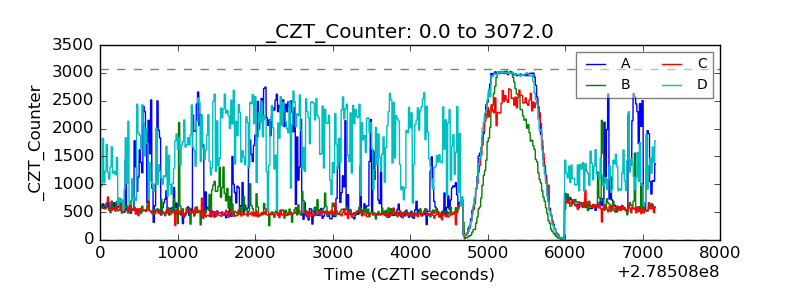 |
| +2.5 Volts monitor |  |
| +5 Volts monitor |  |
| _ROLL_ROT | 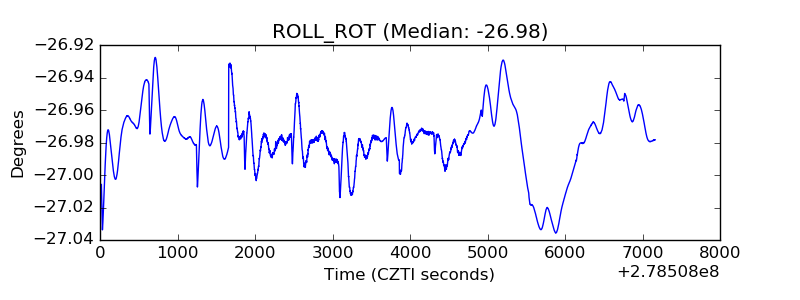 |
| _Roll_DEC | 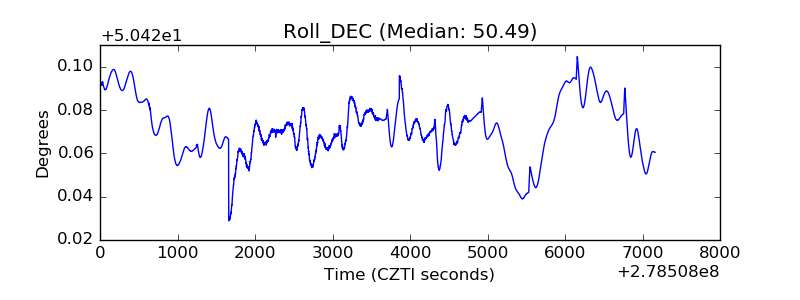 |
| _Roll_RA | 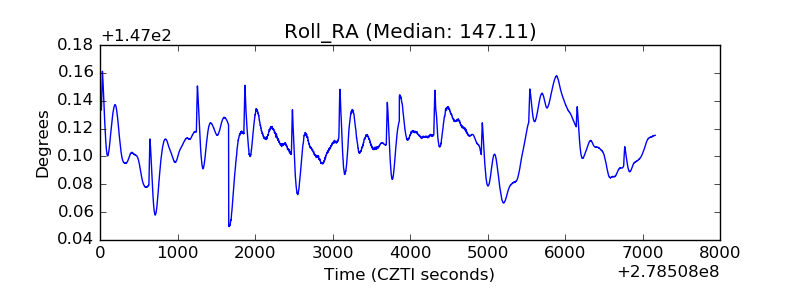 |
| Veto Counter | 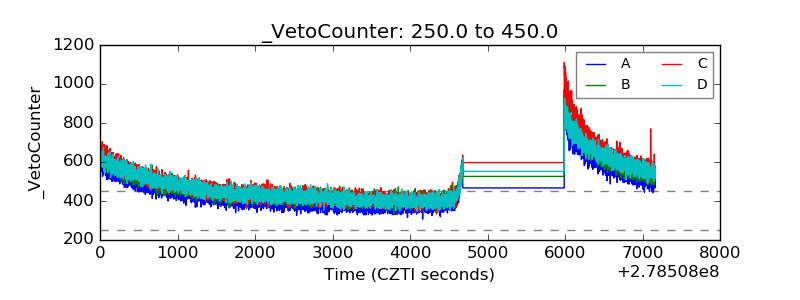 |