| Param | Original file | Final file |
|---|---|---|
| Filename | modeM0/AS1A05_012T02_9000002468_16690cztM0_level2.evt | modeM0/AS1A05_012T02_9000002468_16690cztM0_level2_quad_clean.evt |
| Size (bytes) | 219,349,440 | 15,560,640 |
| Size | 209.2 MB | 14.8 MB |
| Events in quadrant A | 1,247,040 | 79,903 |
| Events in quadrant B | 1,370,454 | 79,484 |
| Events in quadrant C | 1,221,902 | 77,348 |
| Events in quadrant D | 2,651,836 | 73,779 |
| Mode M0 | |||
|---|---|---|---|
| Quadrant | BADHDUFLAG | Total packets | Discarded packets |
| A | 0 | 5024 | 0 |
| B | 0 | 5657 | 0 |
| C | 0 | 5014 | 0 |
| D | 0 | 9462 | 0 |
| Mode SS | |||
|---|---|---|---|
| Quadrant | BADHDUFLAG | Total packets | Discarded packets |
| A | 0 | 44 | 0 |
| B | 0 | 44 | 0 |
| C | 0 | 44 | 0 |
| D | 0 | 44 | 0 |
| Quadrant | Total seconds | Saturated seconds | Saturation percentage |
|---|---|---|---|
| A | 2213 | 18 | 0.813376% |
| B | 2213 | 9 | 0.406688% |
| C | 2213 | 14 | 0.632625% |
| D | 2213 | 280 | 12.652508% |
Noise dominated data is calculated using 1-second bins in cleaned event files. If a bin has >2000 counts, and if more than 50% of those come from <1% of pixels, then it is considered to be noise-dominated and hence unusable.
| Quadrant | # 1 sec bins | Bins with >0 counts | Bins with >2000 counts | High rate bins dominated by noise | Noise dominated (total time) | Noise dominated (detector-on time) | Marked lightcurve |
|---|---|---|---|---|---|---|---|
| A | 2214 | 2214 | 11 | 11 | 0.50% | 0.50% | 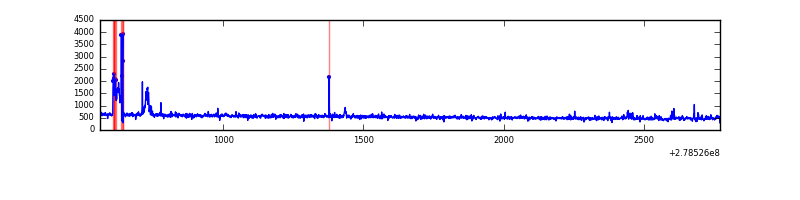 |
| B | 2214 | 2214 | 1 | 1 | 0.05% | 0.05% | 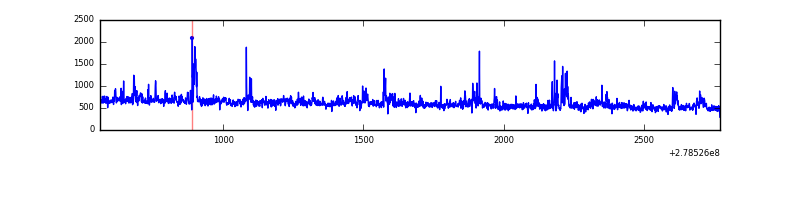 |
| C | 2214 | 2214 | 0 | 0 | 0.00% | 0.00% | 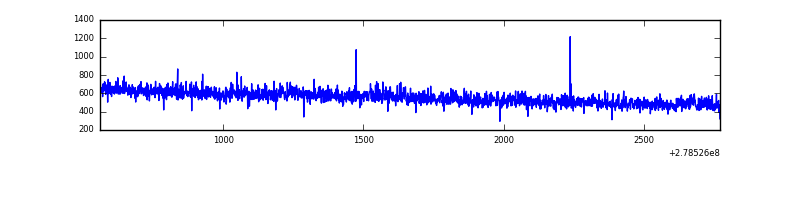 |
| D | 2214 | 2214 | 227 | 227 | 10.25% | 10.25% | 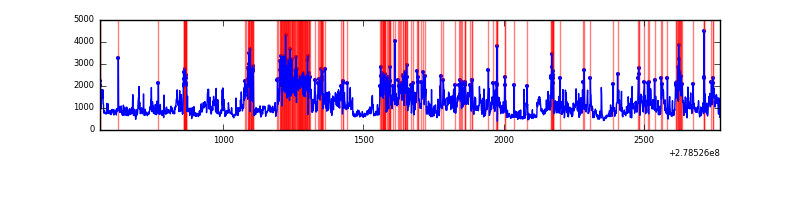 |
Top three noisy pixels from each quadrant. If the there are fewer than three noisy pixels in the level2.evt file, extra rows are filled as -1
| Pixel properties | Quadrant properties | ||||||
|---|---|---|---|---|---|---|---|
| Quadrant | DetID | PixID | Counts | Sigma | Mean | Median | Sigma |
| A | 15 | 174 | 67463 | 1110.37 | 302 | 297 | 60.5 |
| A | 12 | 96 | 11372 | 183.09 | 302 | 297 | 60.5 |
| A | 8 | 144 | 3121 | 46.69 | 302 | 297 | 60.5 |
| B | 0 | 229 | 86431 | 1503.78 | 300 | 294 | 57.3 |
| B | 15 | 35 | 58152 | 1010.09 | 300 | 294 | 57.3 |
| B | 0 | 189 | 18488 | 317.63 | 300 | 294 | 57.3 |
| C | 14 | 238 | 47455 | 685.17 | 294 | 298 | 68.8 |
| C | 3 | 233 | 24370 | 349.76 | 294 | 298 | 68.8 |
| C | 13 | 61 | 2094 | 26.1 | 294 | 298 | 68.8 |
| D | 1 | 52 | 849703 | 12093.93 | 288 | 280 | 70.2 |
| D | 2 | 16 | 350910 | 4992.21 | 288 | 280 | 70.2 |
| D | 5 | 222 | 250161 | 3557.76 | 288 | 280 | 70.2 |
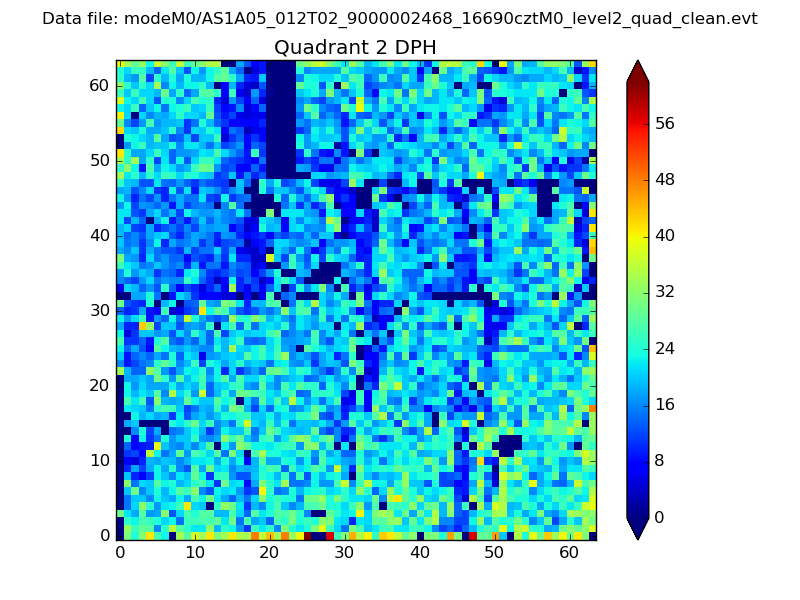
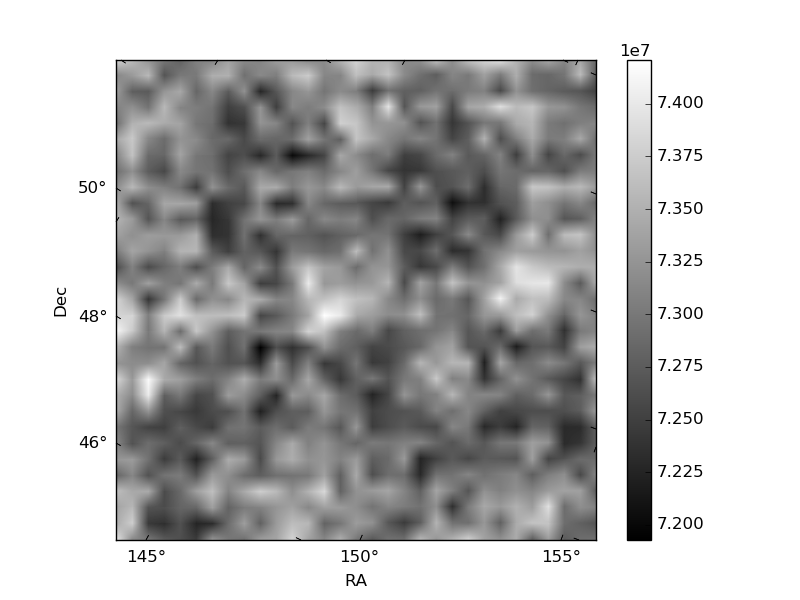
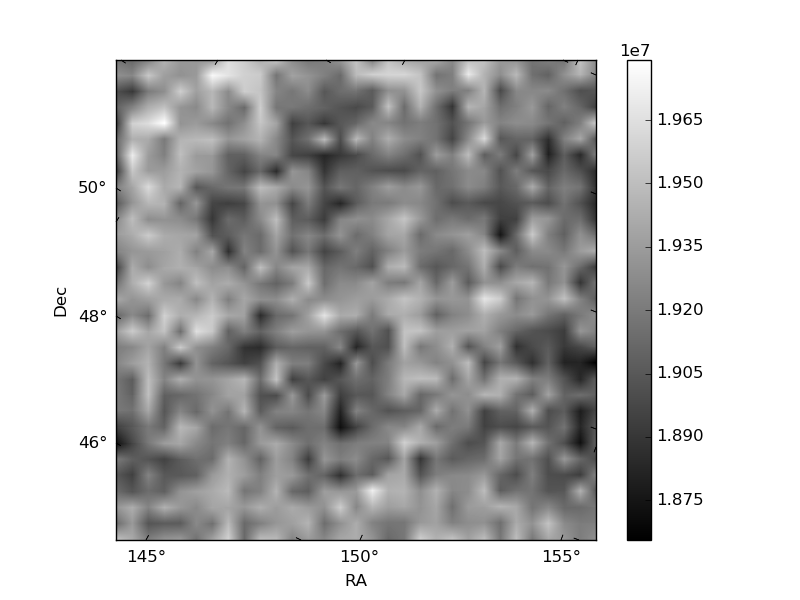
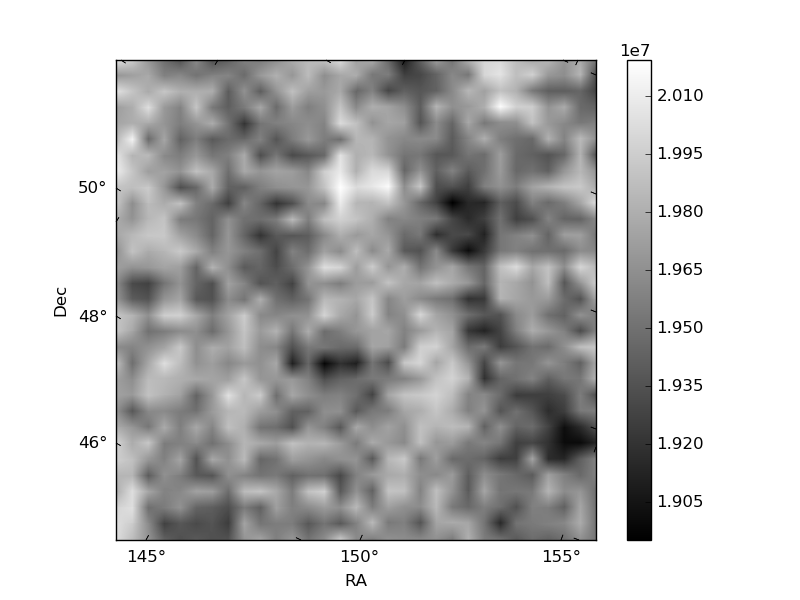
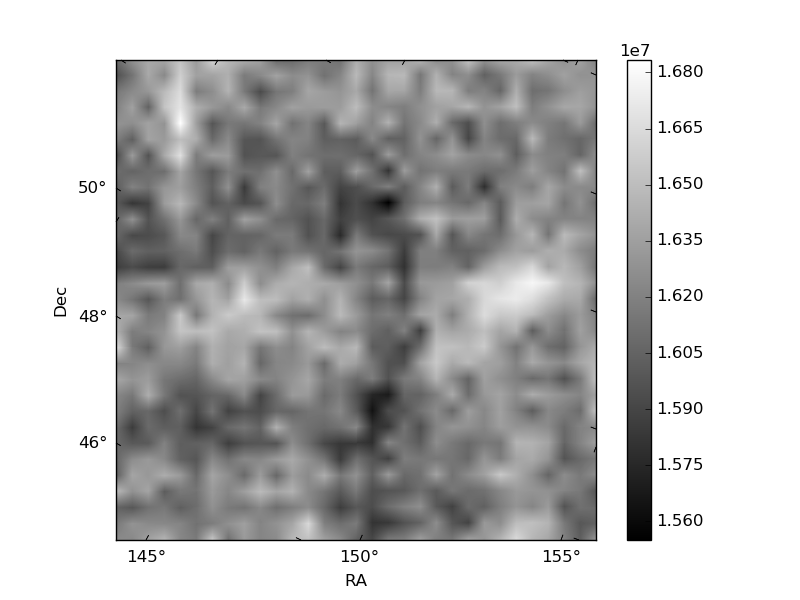
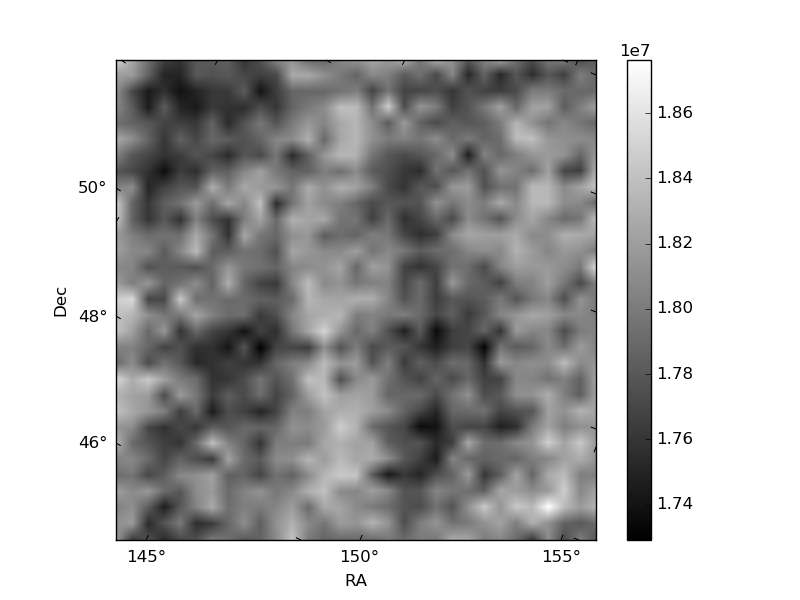
Histogram calculated using DETX and DETY for each event in the final _common_clean file
| Quadrant A | 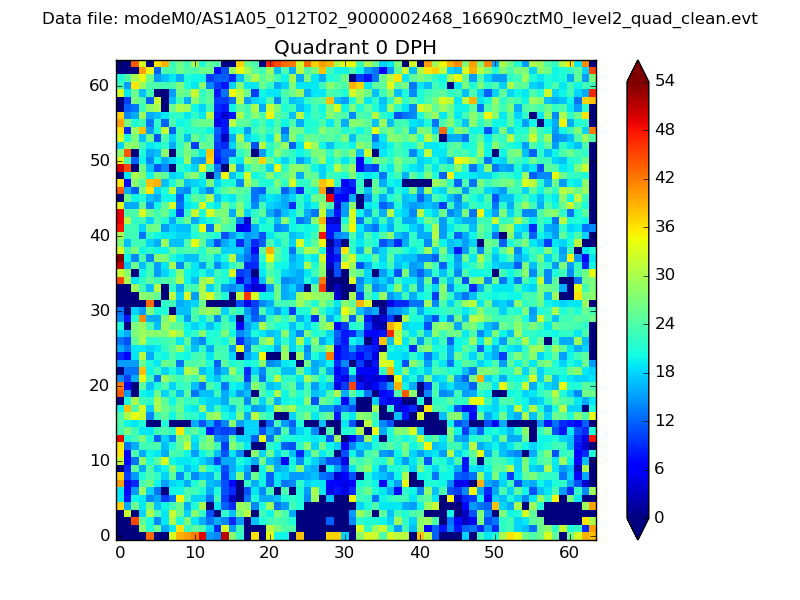 |
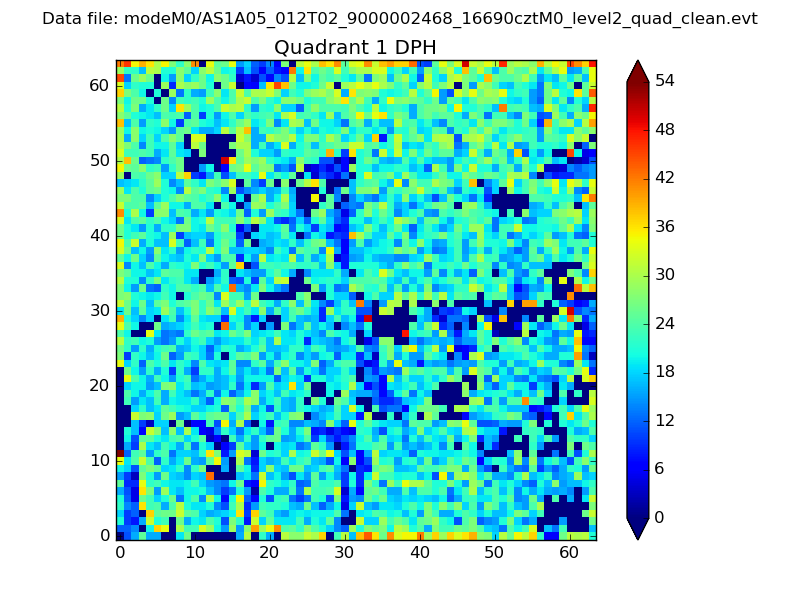 |
Quadrant B |
|---|---|---|---|
| Quadrant D | 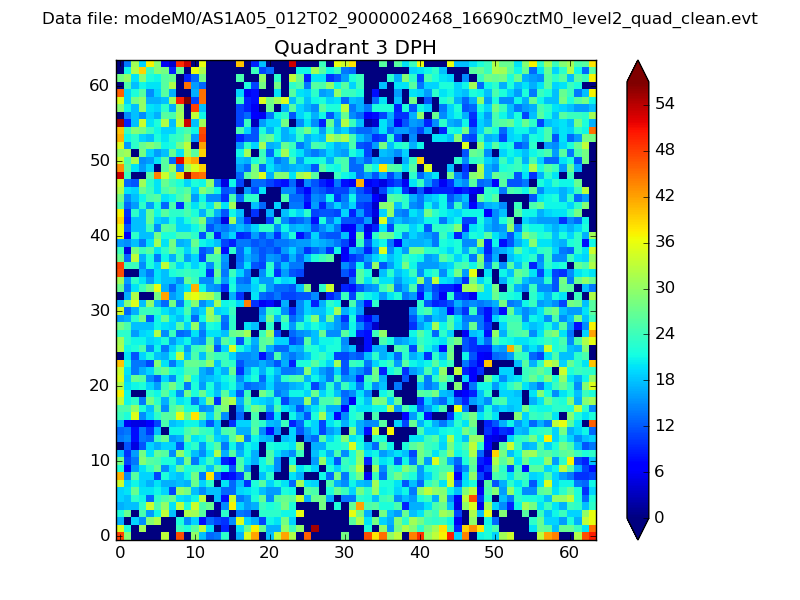 |
 |
Quadrant C |
| Plot type | Count rate plots | Images |
|---|---|---|
| Comparison with Poisson distribution Blue bars denote a histogram of data divided into 1 sec bins. Red curve is a Poisson curve with rate = median count rate of data. |
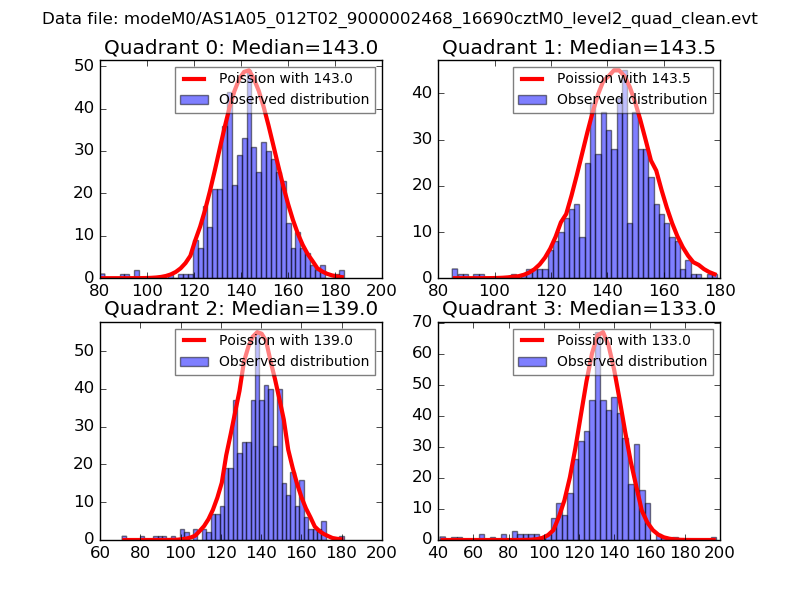 |
 |
| Quadrant-wise count rates Data is divided into 100 sec bins |
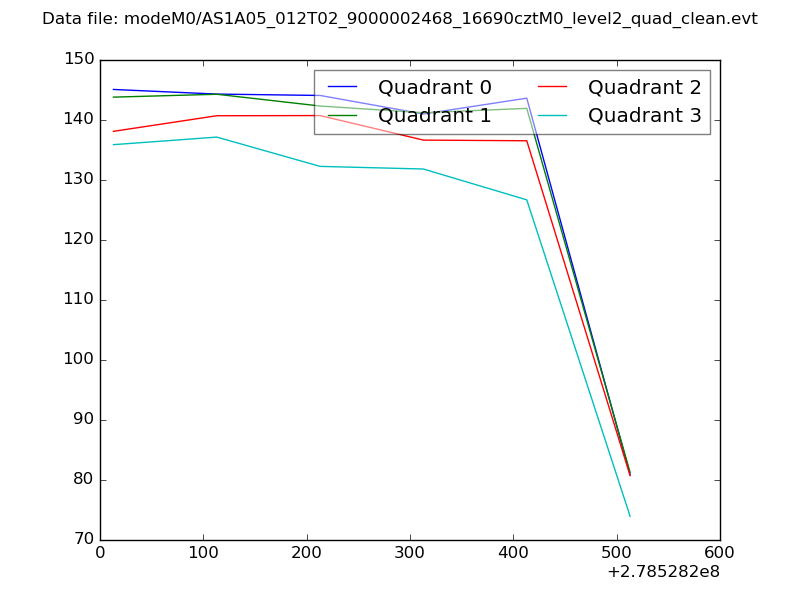 |
|
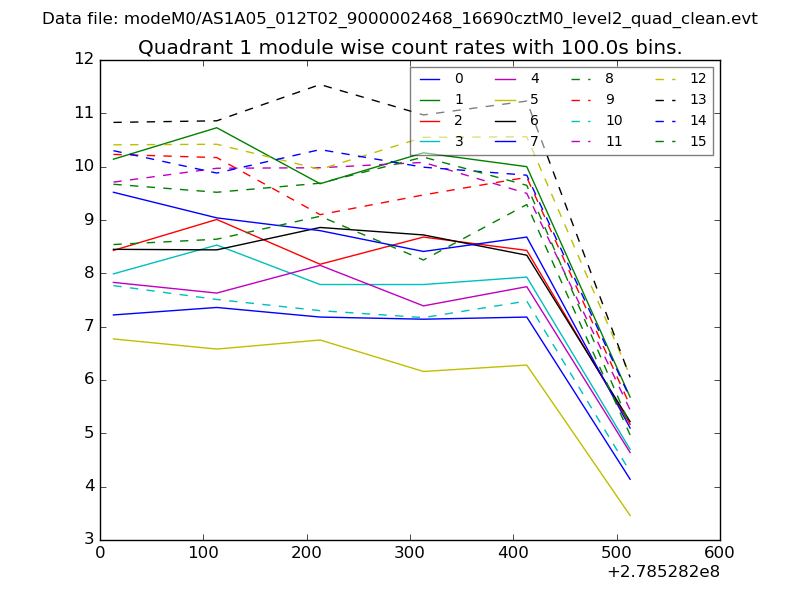
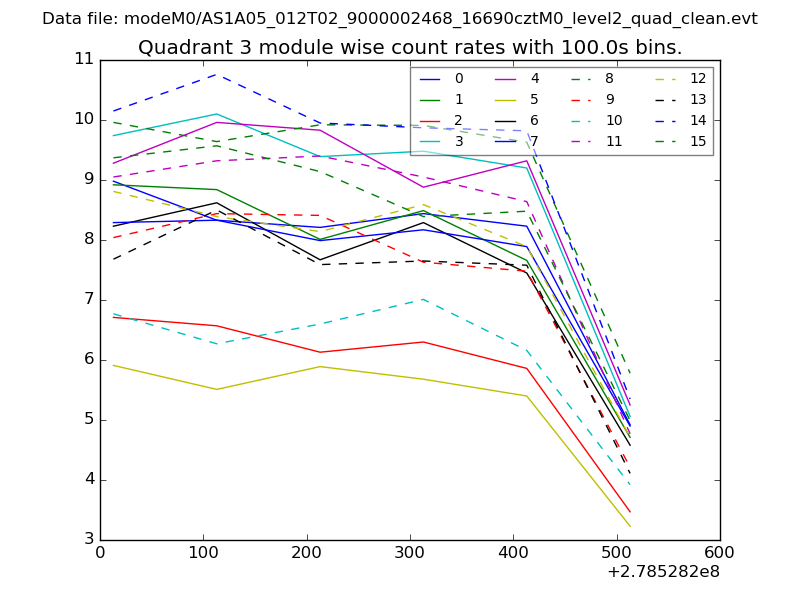
| Module-wise count rates for Quadrant A Data is divided into 100 sec bins |
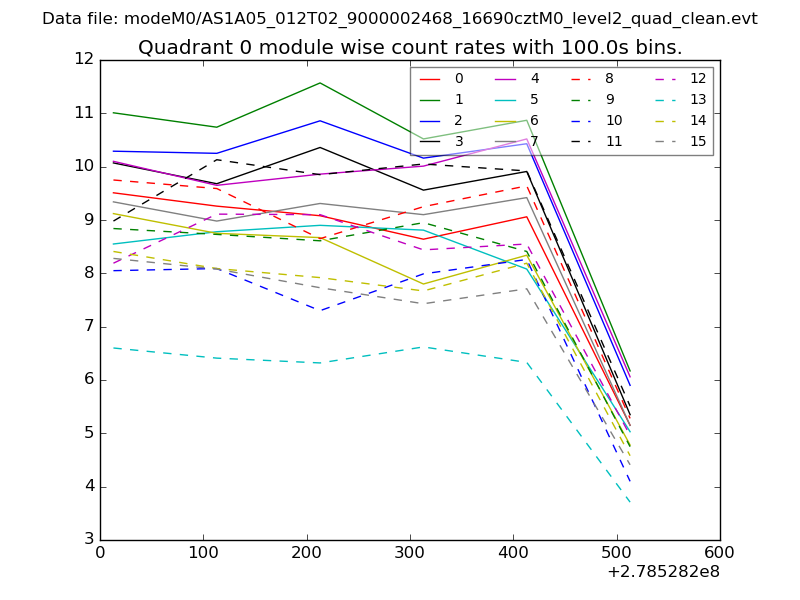 |
 |
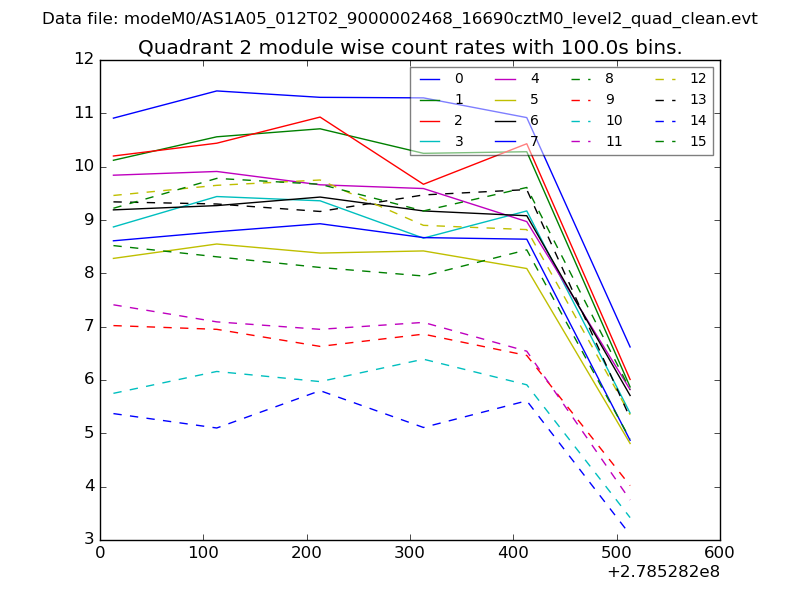
| Module-wise count rates for Quadrant B Data is divided into 100 sec bins |
 |
 |
| Module-wise count rates for Quadrant C Data is divided into 100 sec bins |
 |
 |
| Module-wise count rates for Quadrant D Data is divided into 100 sec bins |
 |
 |
| Parameter | Plot |
|---|---|
| CZT HV Monitor | 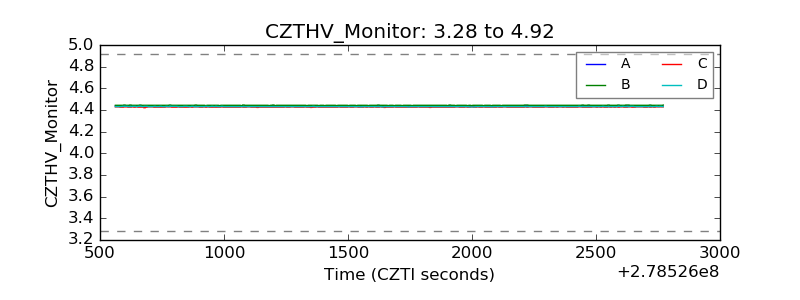 |
| D_VDD | 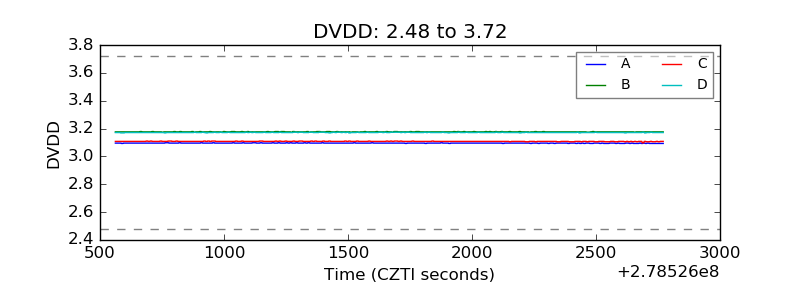 |
| Temperature 1 |  |
| Veto HV Monitor | 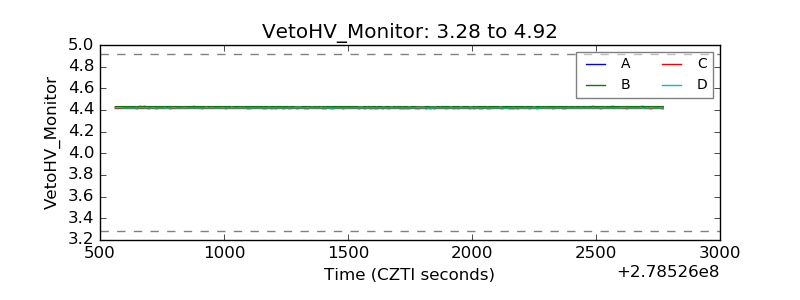 |
| Veto LLD | 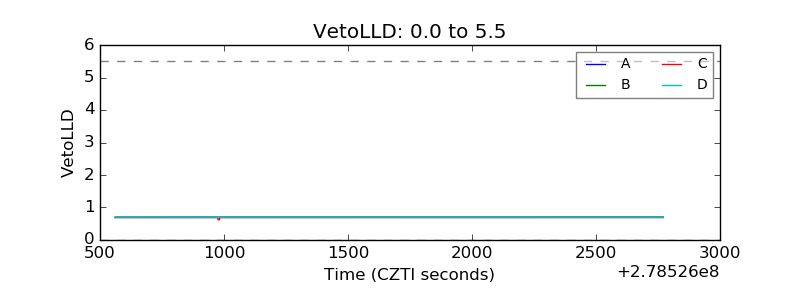 |
| Alpha Counter | 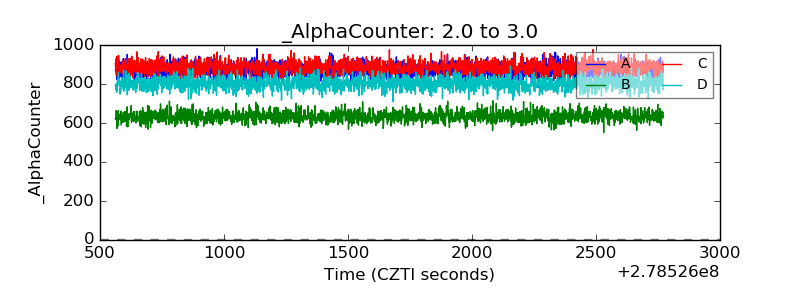 |
| _CPM_Rate | 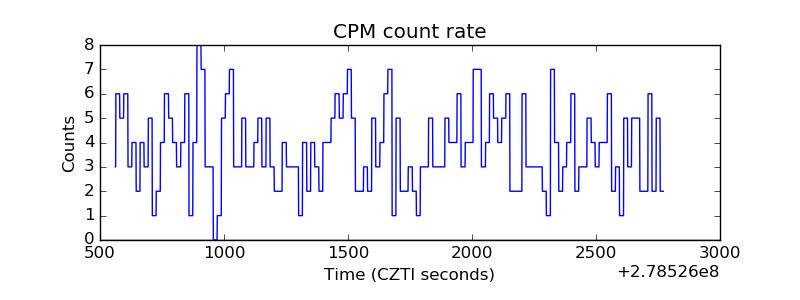 |
| CZT Counter | 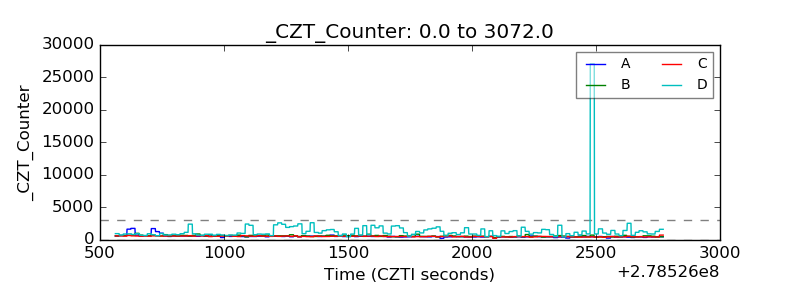 |
| +2.5 Volts monitor |  |
| +5 Volts monitor |  |
| _ROLL_ROT | 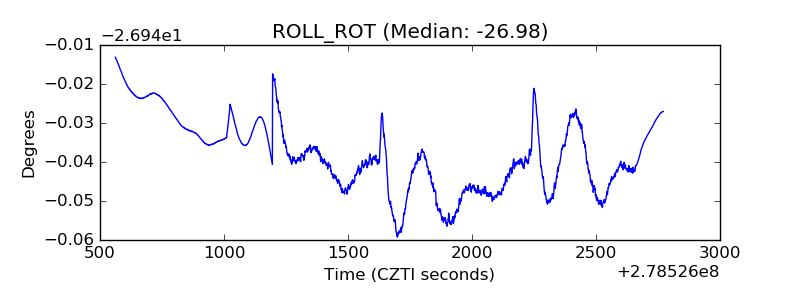 |
| _Roll_DEC | 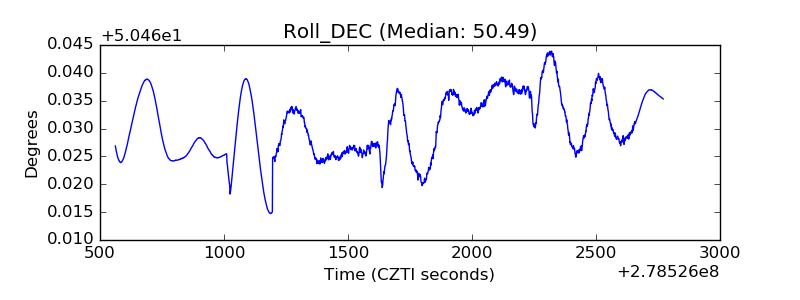 |
| _Roll_RA | 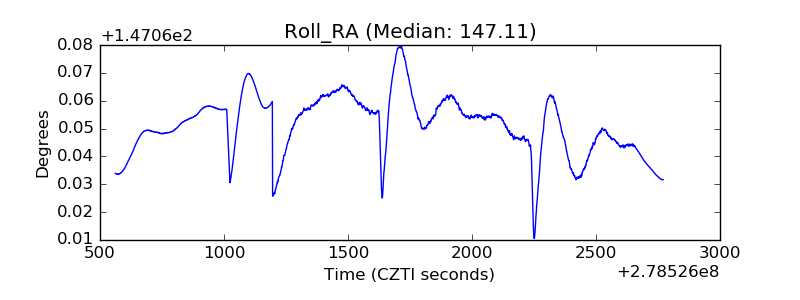 |
| Veto Counter | 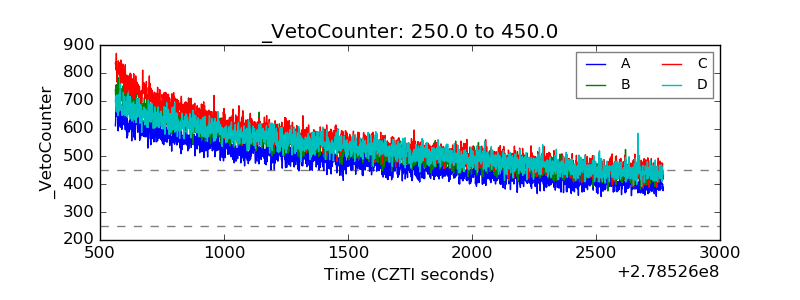 |