| Param | Original file | Final file |
|---|---|---|
| Filename | modeM0/AS1A05_225T01_9000002470cztM0_level2.fits | modeM0/AS1A05_225T01_9000002470cztM0_level2_quad_clean.evt |
| Size (bytes) | 77,656,320 | 45,008,640 |
| Size | 74.1 MB | 42.9 MB |
| Events in quadrant A | 459,916 | 199,199 |
| Events in quadrant B | 468,914 | 221,748 |
| Events in quadrant C | 479,006 | 214,011 |
| Events in quadrant D | 410,498 | 193,577 |
| Mode M0 | |||
|---|---|---|---|
| Quadrant | BADHDUFLAG | Total packets | Discarded packets |
| A | 0 | 25638 | 0 |
| B | 0 | 17216 | 0 |
| C | 0 | 16378 | 0 |
| D | 0 | 24928 | 0 |
| Mode SS | |||
|---|---|---|---|
| Quadrant | BADHDUFLAG | Total packets | Discarded packets |
| A | 0 | 158 | 0 |
| B | 0 | 158 | 0 |
| C | 0 | 158 | 0 |
| D | 0 | 158 | 0 |
| Mode M9 | |||
|---|---|---|---|
| Quadrant | BADHDUFLAG | Total packets | Discarded packets |
| A | 0 | 22 | 0 |
| B | 0 | 22 | 0 |
| C | 0 | 22 | 0 |
| D | 0 | 22 | 0 |
| Quadrant | Total seconds | Saturated seconds | Saturation percentage |
|---|---|---|---|
| A | 7665 | 990 | 12.915851% |
| B | 7665 | 203 | 2.648402% |
| C | 7665 | 208 | 2.713633% |
| D | 7665 | 383 | 4.996738% |
Noise dominated data is calculated using 1-second bins in cleaned event files. If a bin has >2000 counts, and if more than 50% of those come from <1% of pixels, then it is considered to be noise-dominated and hence unusable.
| Quadrant | # 1 sec bins | Bins with >0 counts | Bins with >2000 counts | High rate bins dominated by noise | Noise dominated (total time) | Noise dominated (detector-on time) | Marked lightcurve |
|---|---|---|---|---|---|---|---|
| A | 9910 | 7631 | 0 | 0 | 0.00% | 0.00% | 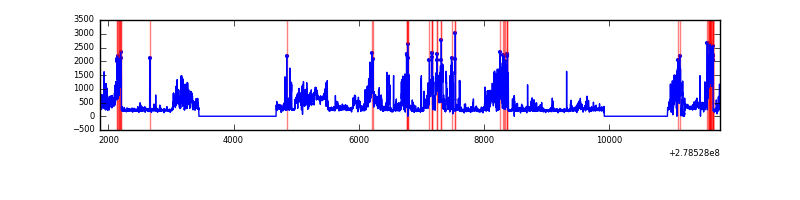 |
| B | 9910 | 7665 | 0 | 0 | 0.00% | 0.00% |  |
| C | 9910 | 7665 | 0 | 0 | 0.00% | 0.00% | 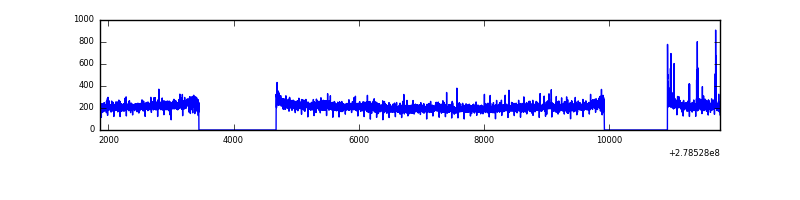 |
| D | 9910 | 7665 | 0 | 0 | 0.00% | 0.00% | 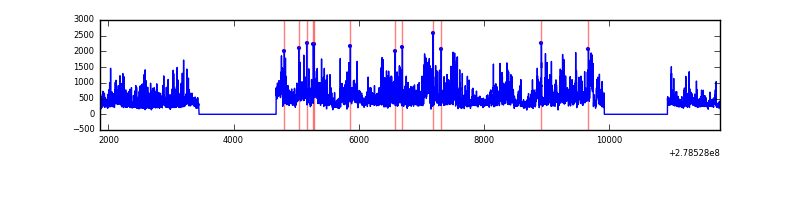 |
Top three noisy pixels from each quadrant. If the there are fewer than three noisy pixels in the level2.evt file, extra rows are filled as -1
| Pixel properties | Quadrant properties | ||||||
|---|---|---|---|---|---|---|---|
| Quadrant | DetID | PixID | Counts | Sigma | Mean | Median | Sigma |
| A | 0 | 29 | 420 | 9.98 | 119 | 112 | 30.9 |
| A | 7 | 110 | 352 | 7.77 | 119 | 112 | 30.9 |
| A | 15 | 236 | 351 | 7.74 | 119 | 112 | 30.9 |
| B | 2 | 9 | 379 | 9.58 | 124 | 118 | 27.2 |
| B | 5 | 225 | 331 | 7.82 | 124 | 118 | 27.2 |
| B | 3 | 80 | 329 | 7.75 | 124 | 118 | 27.2 |
| C | 9 | 242 | 336 | 6.28 | 126 | 118 | 34.7 |
| C | 12 | 241 | 335 | 6.25 | 126 | 118 | 34.7 |
| C | 3 | 158 | 323 | 5.9 | 126 | 118 | 34.7 |
| D | 10 | 189 | 294 | 5.79 | 116 | 106 | 32.5 |
| D | 7 | 3 | 292 | 5.73 | 116 | 106 | 32.5 |
| D | 4 | 160 | 290 | 5.67 | 116 | 106 | 32.5 |
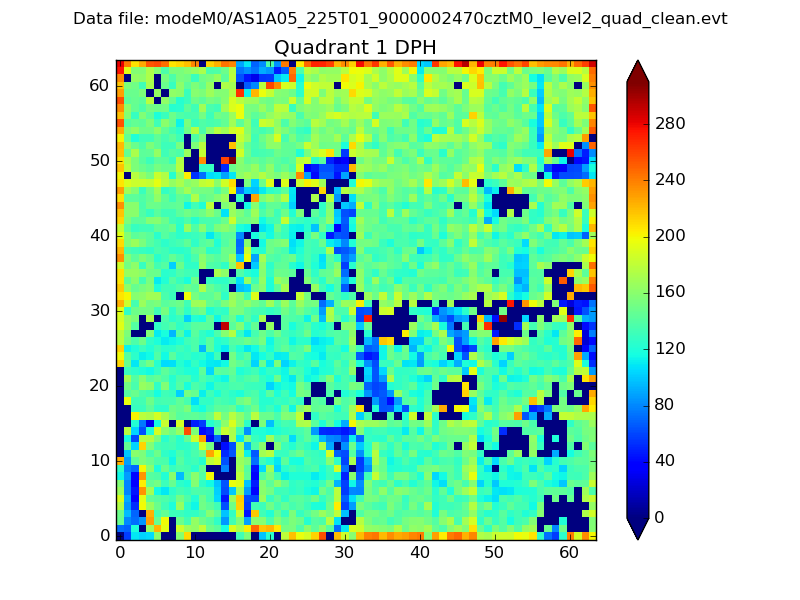
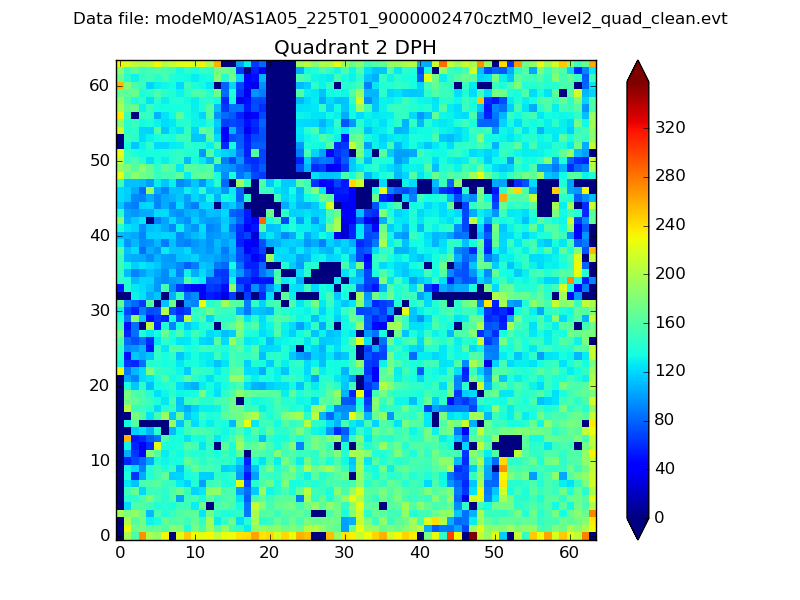
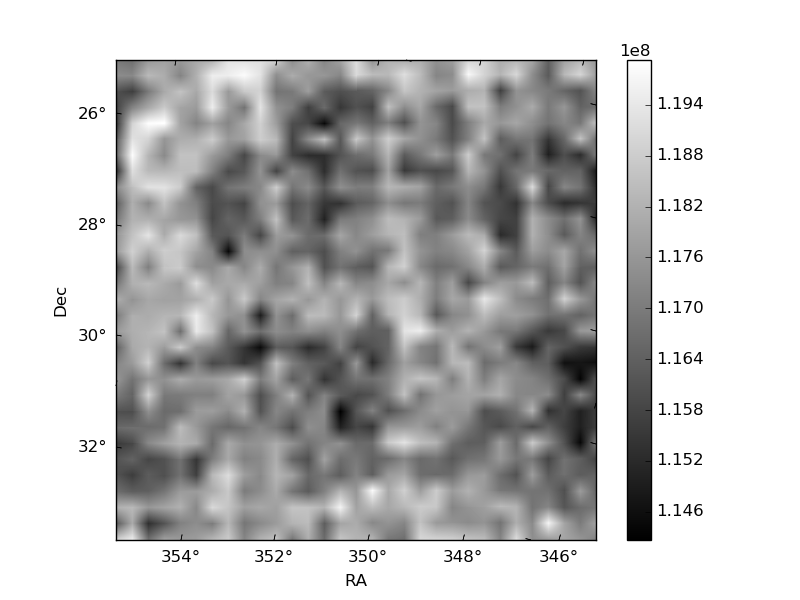
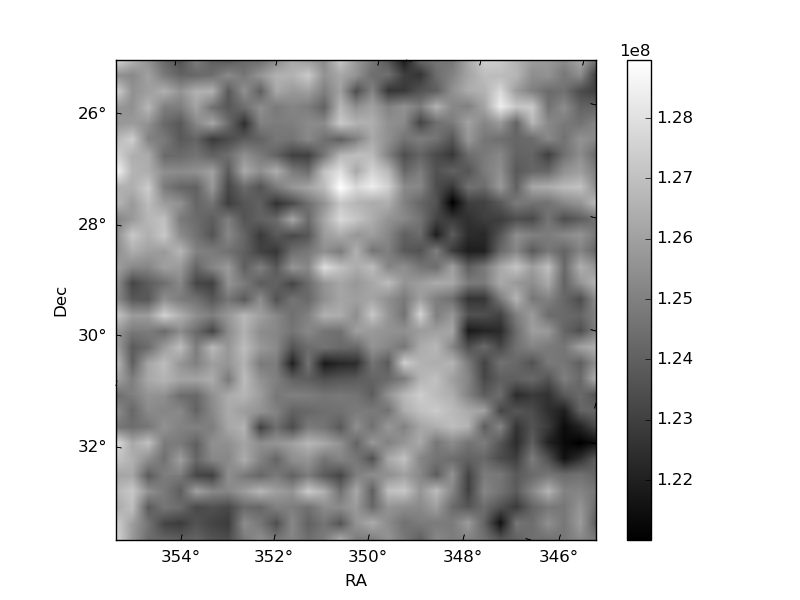
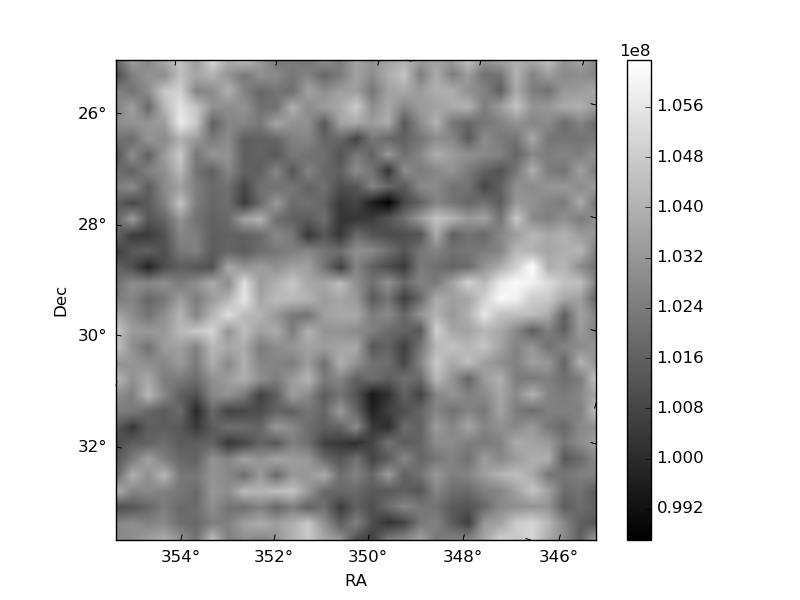
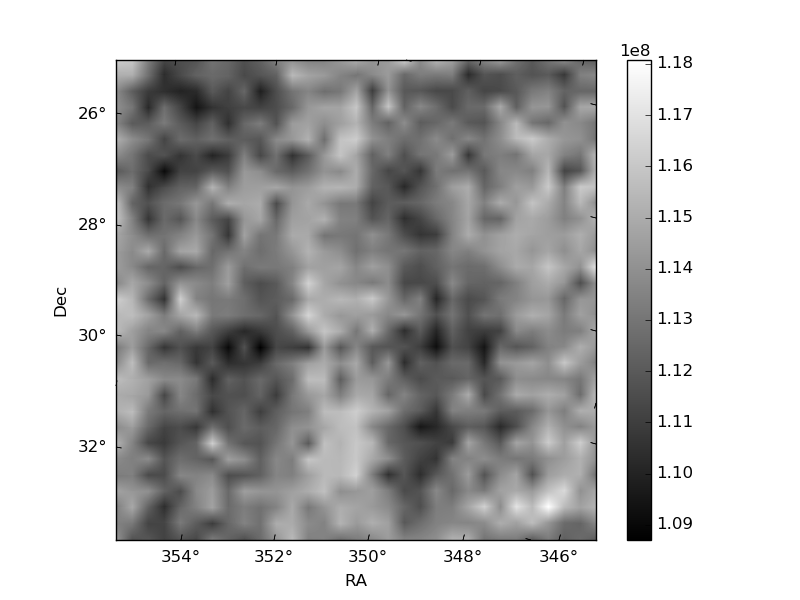
Histogram calculated using DETX and DETY for each event in the final _common_clean file
| Quadrant A | 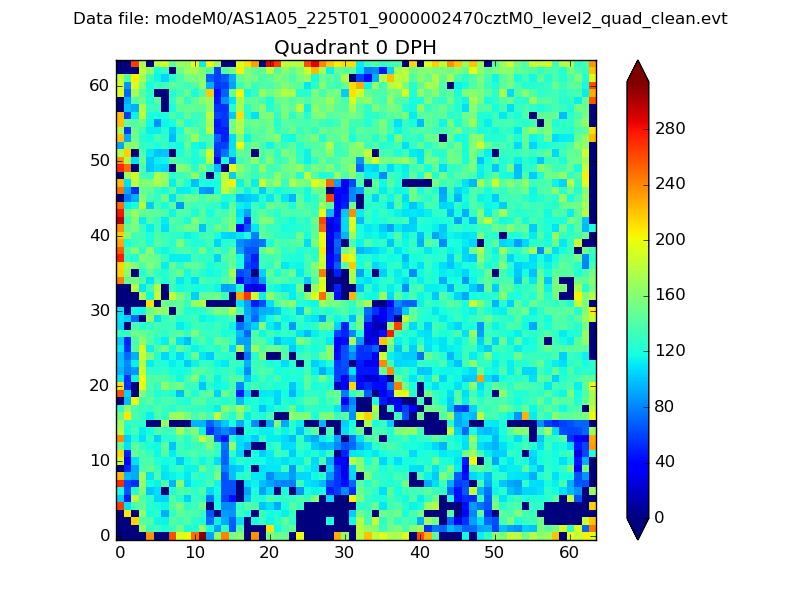 |
 |
Quadrant B |
|---|---|---|---|
| Quadrant D | 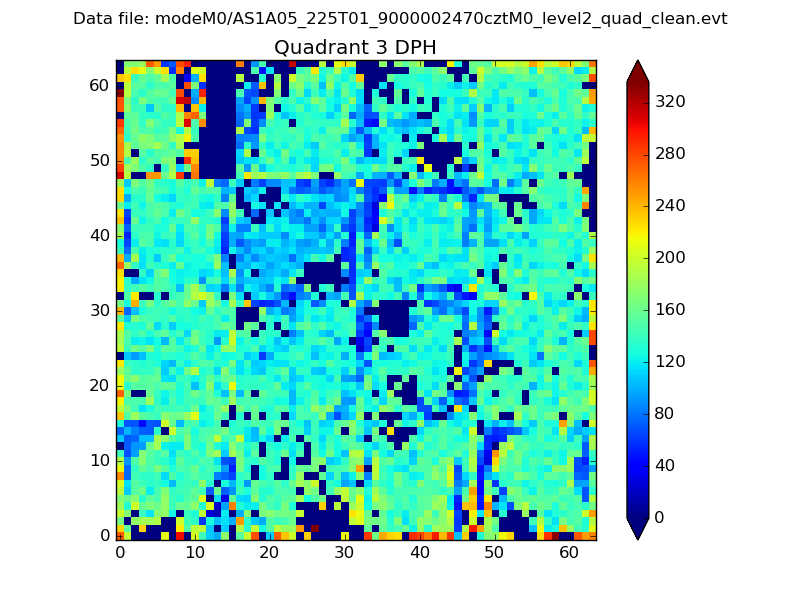 |
 |
Quadrant C |
| Plot type | Count rate plots | Images |
|---|---|---|
| Comparison with Poisson distribution Blue bars denote a histogram of data divided into 1 sec bins. Red curve is a Poisson curve with rate = median count rate of data. |
 |
 |
| Quadrant-wise count rates Data is divided into 100 sec bins |
 |
|
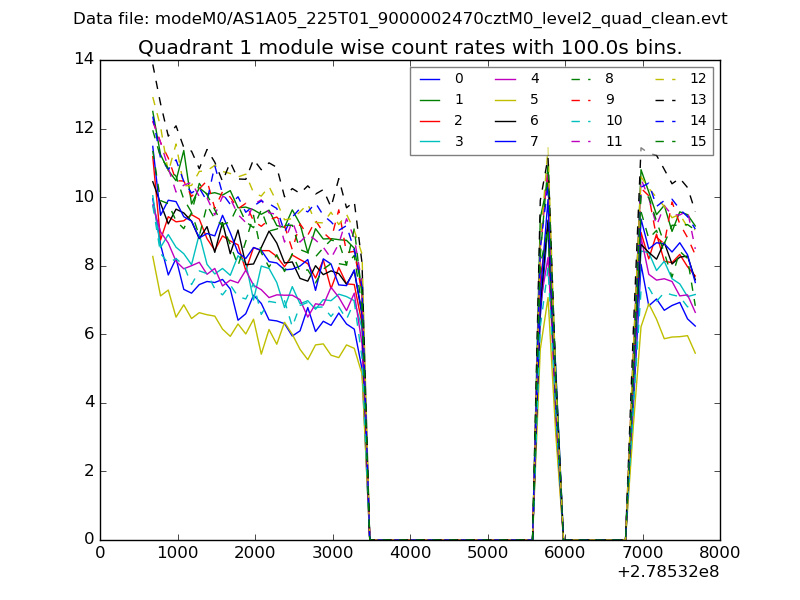
| Module-wise count rates for Quadrant A Data is divided into 100 sec bins |
 |
 |
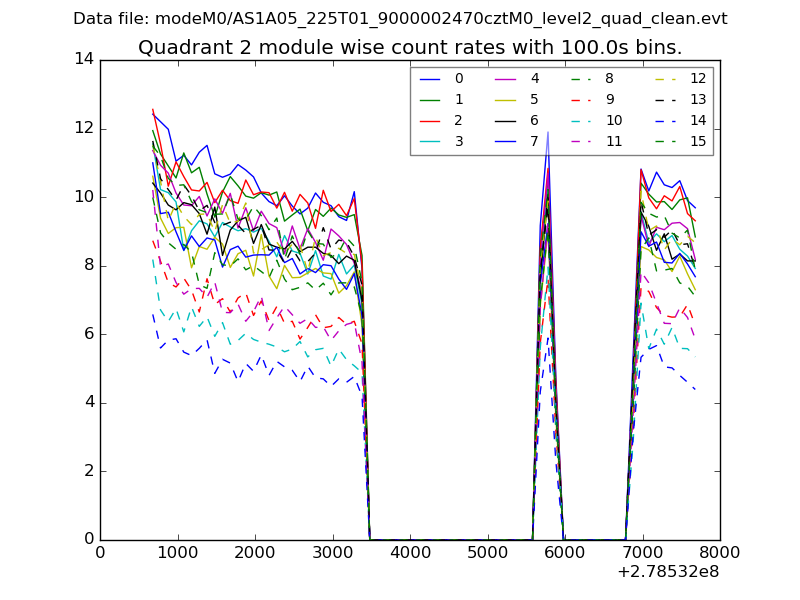
| Module-wise count rates for Quadrant B Data is divided into 100 sec bins |
 |
 |
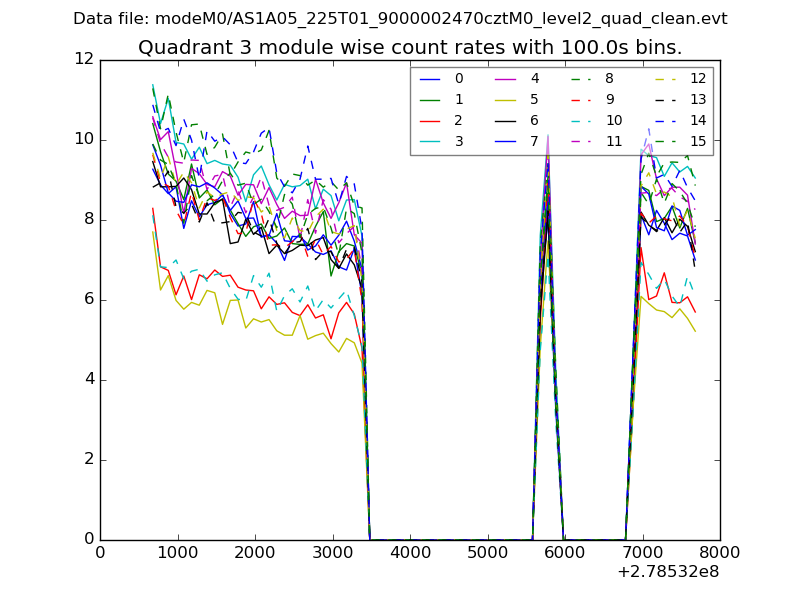
| Module-wise count rates for Quadrant C Data is divided into 100 sec bins |
 |
 |
| Module-wise count rates for Quadrant D Data is divided into 100 sec bins |
 |
 |
| Parameter | Plot |
|---|---|
| CZT HV Monitor |  |
| D_VDD | 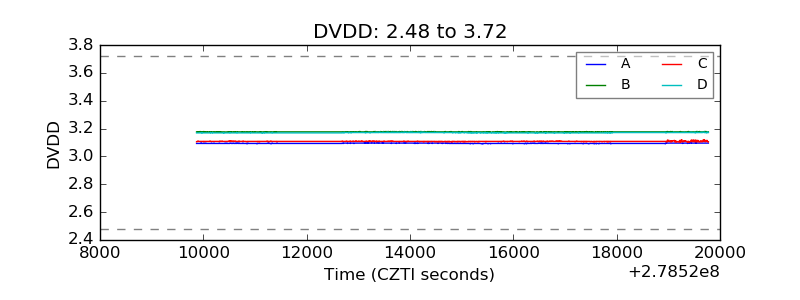 |
| Temperature 1 | 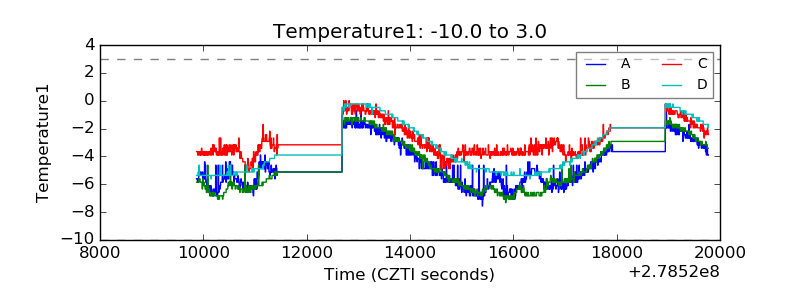 |
| Veto HV Monitor | 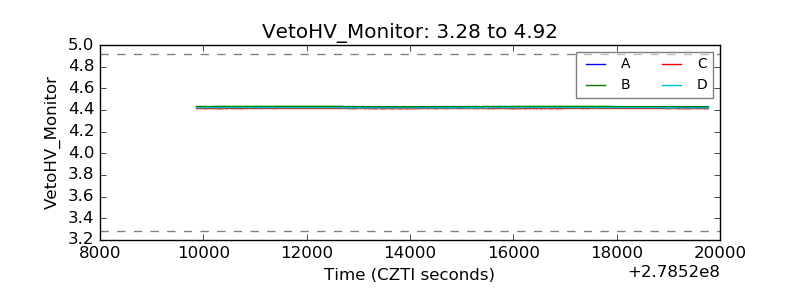 |
| Veto LLD |  |
| Alpha Counter | 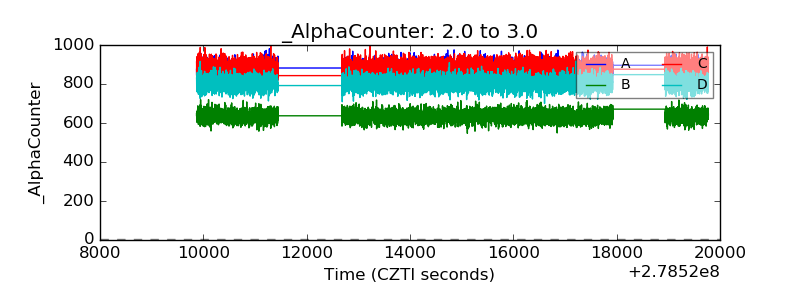 |
| _CPM_Rate | 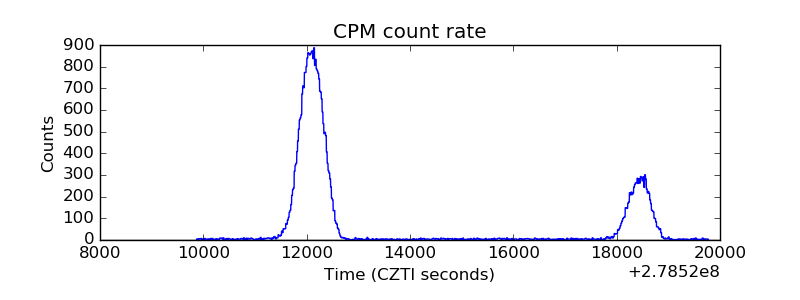 |
| CZT Counter | 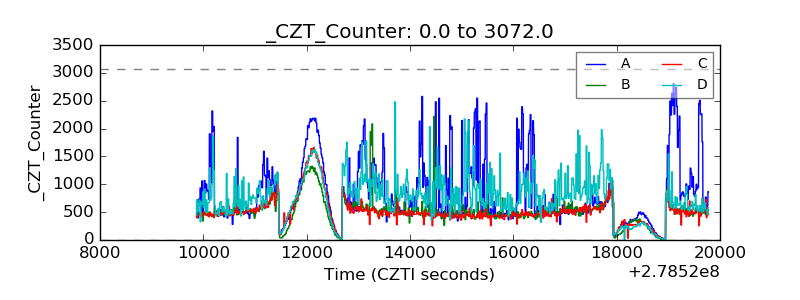 |
| +2.5 Volts monitor | 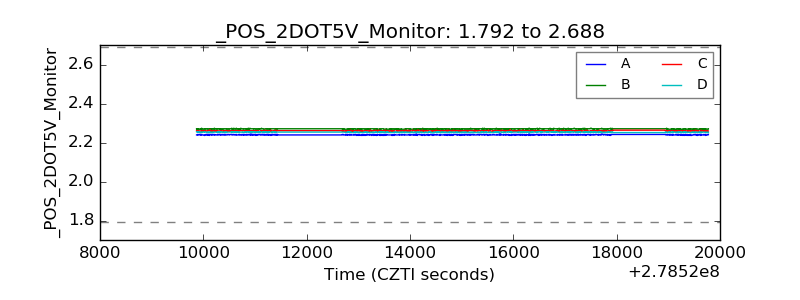 |
| +5 Volts monitor | 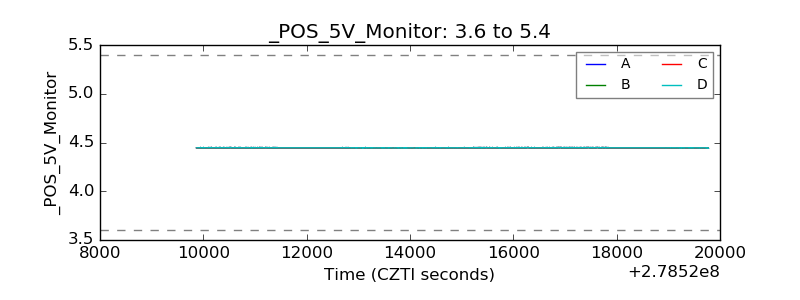 |
| _ROLL_ROT | 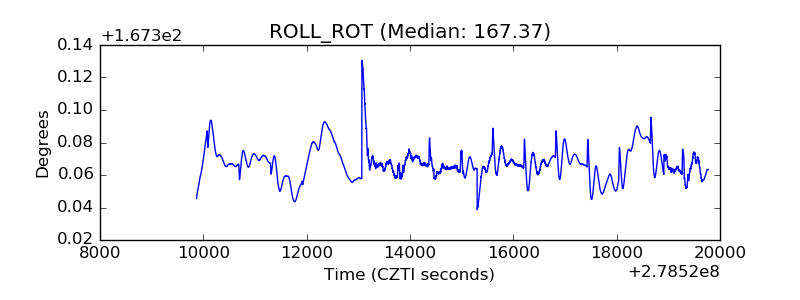 |
| _Roll_DEC |  |
| _Roll_RA | 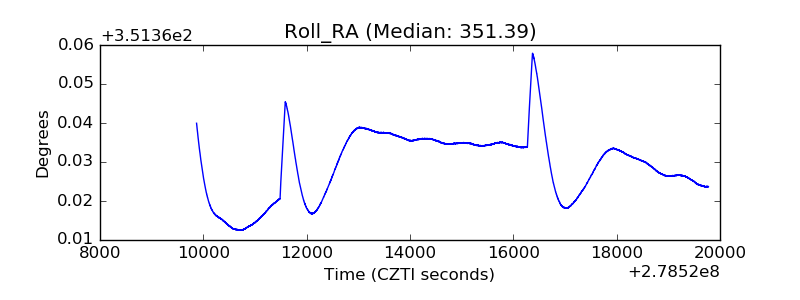 |
| Veto Counter | 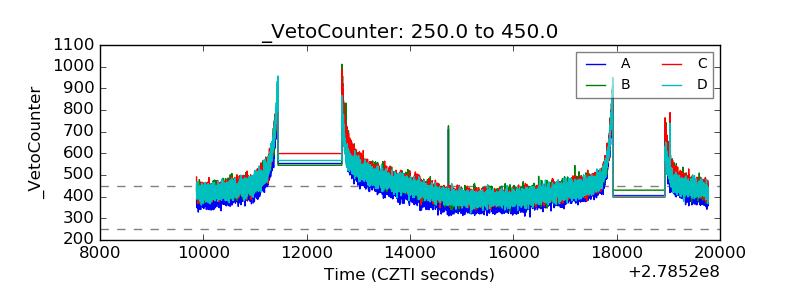 |