| Param | Original file | Final file |
|---|---|---|
| Filename | modeM0/AS1A05_225T01_9000002470_16692cztM0_level2.evt | modeM0/AS1A05_225T01_9000002470_16692cztM0_level2_quad_clean.evt |
| Size (bytes) | 589,913,280 | 81,659,520 |
| Size | 562.6 MB | 77.9 MB |
| Events in quadrant A | 5,651,321 | 489,104 |
| Events in quadrant B | 3,326,907 | 539,978 |
| Events in quadrant C | 3,065,487 | 521,199 |
| Events in quadrant D | 5,410,250 | 497,166 |
| Mode M0 | |||
|---|---|---|---|
| Quadrant | BADHDUFLAG | Total packets | Discarded packets |
| A | 0 | 20884 | 2 |
| B | 0 | 13671 | 2 |
| C | 0 | 12865 | 2 |
| D | 0 | 20376 | 2 |
| Mode SS | |||
|---|---|---|---|
| Quadrant | BADHDUFLAG | Total packets | Discarded packets |
| A | 0 | 124 | 0 |
| B | 0 | 124 | 0 |
| C | 0 | 124 | 0 |
| D | 0 | 124 | 0 |
| Mode M9 | |||
|---|---|---|---|
| Quadrant | BADHDUFLAG | Total packets | Discarded packets |
| A | 0 | 16 | 0 |
| B | 0 | 16 | 0 |
| C | 0 | 16 | 0 |
| D | 0 | 17 | 0 |
| Quadrant | Total seconds | Saturated seconds | Saturation percentage |
|---|---|---|---|
| A | 6085 | 779 | 12.801972% |
| B | 6085 | 105 | 1.725555% |
| C | 6085 | 101 | 1.659819% |
| D | 6085 | 281 | 4.617913% |
Noise dominated data is calculated using 1-second bins in cleaned event files. If a bin has >2000 counts, and if more than 50% of those come from <1% of pixels, then it is considered to be noise-dominated and hence unusable.
| Quadrant | # 1 sec bins | Bins with >0 counts | Bins with >2000 counts | High rate bins dominated by noise | Noise dominated (total time) | Noise dominated (detector-on time) | Marked lightcurve |
|---|---|---|---|---|---|---|---|
| A | 7096 | 6087 | 527 | 527 | 7.43% | 8.66% | 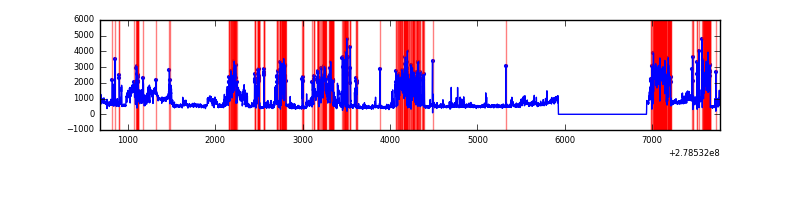 |
| B | 7096 | 6087 | 15 | 15 | 0.21% | 0.25% | 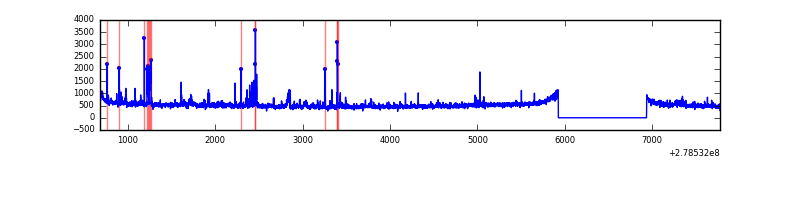 |
| C | 7096 | 6087 | 0 | 0 | 0.00% | 0.00% | 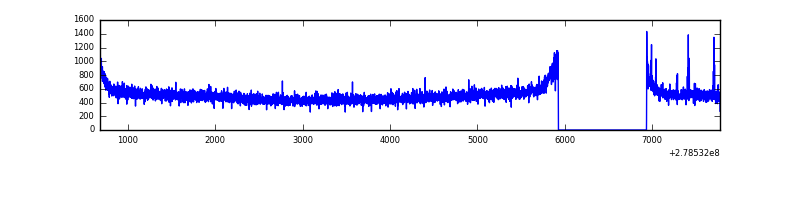 |
| D | 7096 | 6087 | 138 | 138 | 1.94% | 2.27% | 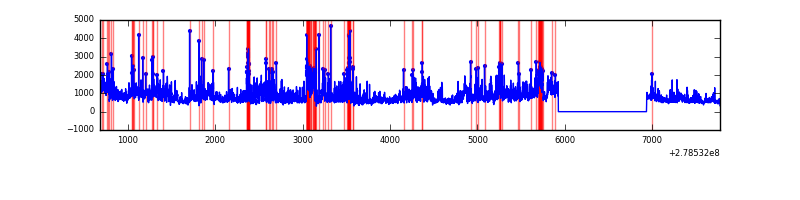 |
Top three noisy pixels from each quadrant. If the there are fewer than three noisy pixels in the level2.evt file, extra rows are filled as -1
| Pixel properties | Quadrant properties | ||||||
|---|---|---|---|---|---|---|---|
| Quadrant | DetID | PixID | Counts | Sigma | Mean | Median | Sigma |
| A | 15 | 174 | 2652607 | 18034.3 | 733 | 718 | 147.0 |
| A | 9 | 143 | 118301 | 799.63 | 733 | 718 | 147.0 |
| A | 15 | 190 | 36578 | 243.87 | 733 | 718 | 147.0 |
| B | 15 | 35 | 119618 | 813.99 | 770 | 754 | 146.0 |
| B | 15 | 222 | 56264 | 380.14 | 770 | 754 | 146.0 |
| B | 0 | 229 | 44137 | 297.09 | 770 | 754 | 146.0 |
| C | 14 | 238 | 113986 | 648.69 | 745 | 751 | 174.6 |
| C | 3 | 233 | 42811 | 240.95 | 745 | 751 | 174.6 |
| C | 13 | 61 | 5509 | 27.26 | 745 | 751 | 174.6 |
| D | 2 | 16 | 1113648 | 6159.85 | 748 | 727 | 180.7 |
| D | 1 | 52 | 981453 | 5428.17 | 748 | 727 | 180.7 |
| D | 5 | 222 | 333924 | 1844.2 | 748 | 727 | 180.7 |
Histogram calculated using DETX and DETY for each event in the final _common_clean file
| Quadrant A |  |
 |
Quadrant B |
|---|---|---|---|
| Quadrant D |  |
 |
Quadrant C |
| Plot type | Count rate plots | Images |
|---|---|---|
| Comparison with Poisson distribution Blue bars denote a histogram of data divided into 1 sec bins. Red curve is a Poisson curve with rate = median count rate of data. |
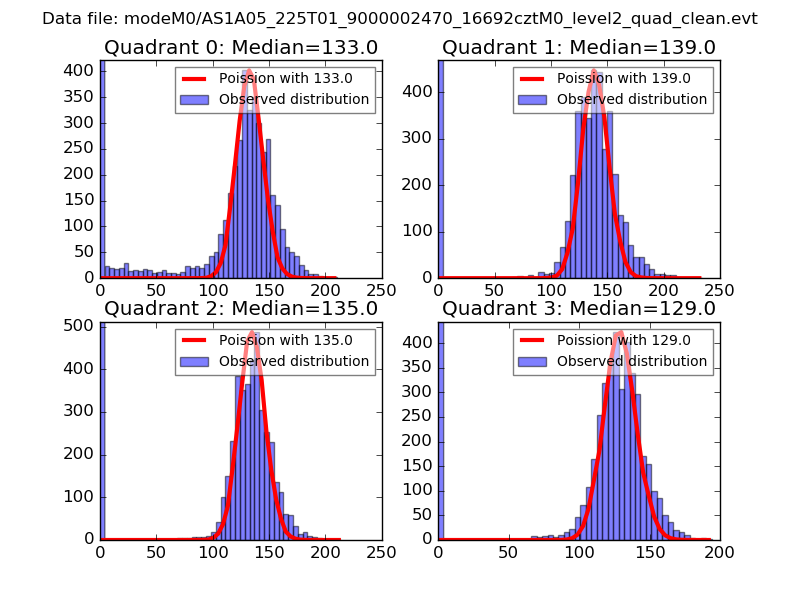 |
 |
| Quadrant-wise count rates Data is divided into 100 sec bins |
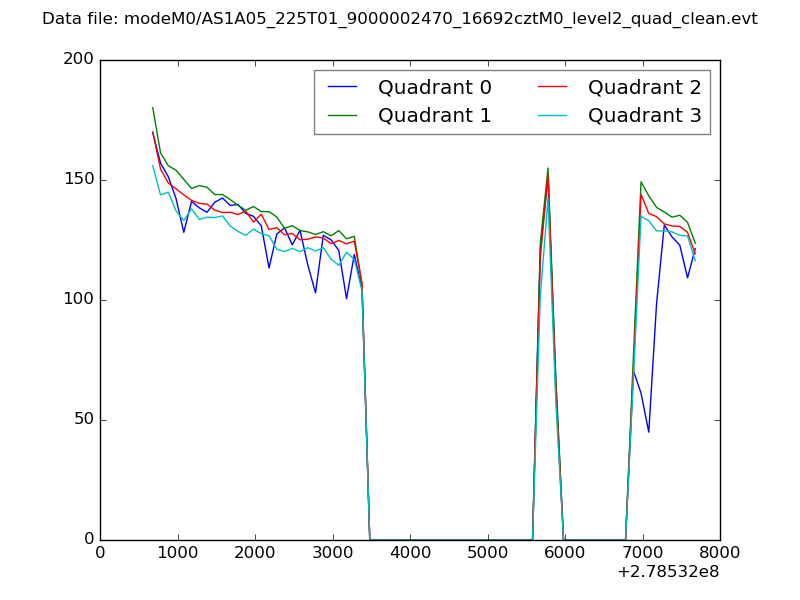 |
|
| Module-wise count rates for Quadrant A Data is divided into 100 sec bins |
 |
 |
| Module-wise count rates for Quadrant B Data is divided into 100 sec bins |
 |
 |
| Module-wise count rates for Quadrant C Data is divided into 100 sec bins |
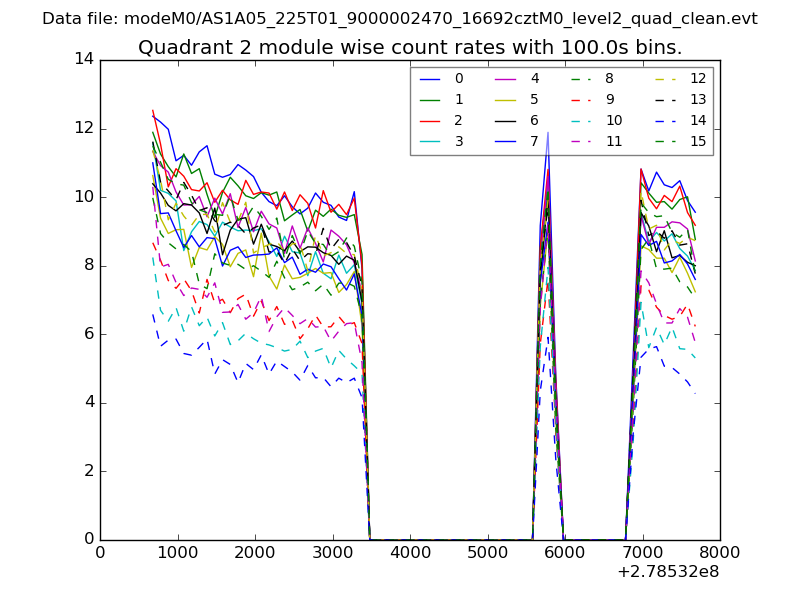 |
 |
| Module-wise count rates for Quadrant D Data is divided into 100 sec bins |
 |
 |
| Parameter | Plot |
|---|---|
| CZT HV Monitor |  |
| D_VDD |  |
| Temperature 1 |  |
| Veto HV Monitor |  |
| Veto LLD |  |
| Alpha Counter | 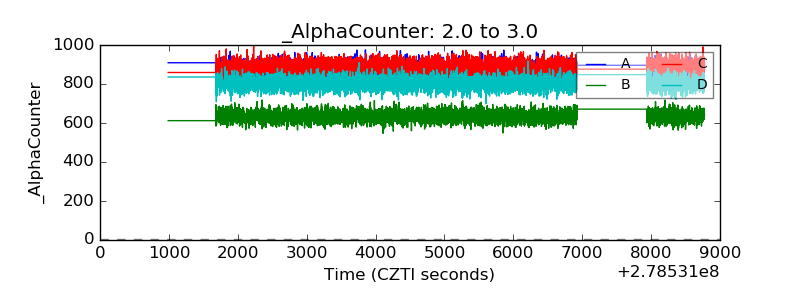 |
| _CPM_Rate | 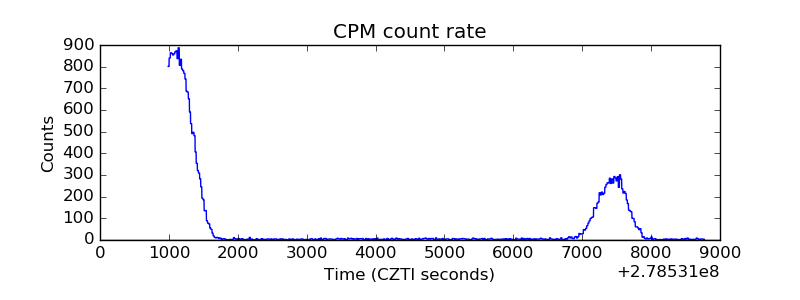 |
| CZT Counter |  |
| +2.5 Volts monitor |  |
| +5 Volts monitor | 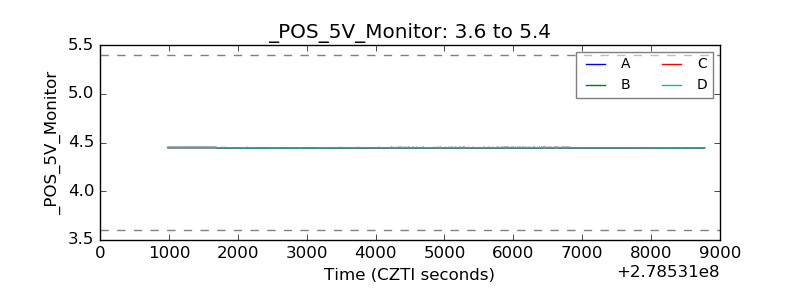 |
| _ROLL_ROT |  |
| _Roll_DEC |  |
| _Roll_RA |  |
| Veto Counter |  |