| Param | Original file | Final file |
|---|---|---|
| Filename | modeM0/AS1T03_024T01_9000002472cztM0_level2.fits | modeM0/AS1T03_024T01_9000002472cztM0_level2_quad_clean.evt |
| Size (bytes) | 1,231,649,280 | 1,214,328,960 |
| Size | 1.1 GB | 1.1 GB |
| Events in quadrant A | 7,614,947 | 7,631,204 |
| Events in quadrant B | 7,562,906 | 7,885,306 |
| Events in quadrant C | 7,749,482 | 7,522,686 |
| Events in quadrant D | 5,546,608 | 4,933,032 |
| Mode M9 | |||
|---|---|---|---|
| Quadrant | BADHDUFLAG | Total packets | Discarded packets |
| A | 0 | 180 | 0 |
| B | 0 | 179 | 0 |
| C | 0 | 180 | 0 |
| D | 0 | 180 | 0 |
| Mode M0 | |||
|---|---|---|---|
| Quadrant | BADHDUFLAG | Total packets | Discarded packets |
| A | 0 | 350905 | 0 |
| B | 0 | 289897 | 0 |
| C | 0 | 287043 | 0 |
| D | 0 | 602436 | 0 |
| Mode SS | |||
|---|---|---|---|
| Quadrant | BADHDUFLAG | Total packets | Discarded packets |
| A | 0 | 2614 | 0 |
| B | 0 | 2616 | 0 |
| C | 0 | 2616 | 0 |
| D | 0 | 2616 | 0 |
| Quadrant | Total seconds | Saturated seconds | Saturation percentage |
|---|---|---|---|
| A | 128504 | 9569 | 7.446461% |
| B | 128484 | 2383 | 1.854706% |
| C | 128507 | 2712 | 2.110391% |
| D | 128431 | 39833 | 31.015098% |
Noise dominated data is calculated using 1-second bins in cleaned event files. If a bin has >2000 counts, and if more than 50% of those come from <1% of pixels, then it is considered to be noise-dominated and hence unusable.
| Quadrant | # 1 sec bins | Bins with >0 counts | Bins with >2000 counts | High rate bins dominated by noise | Noise dominated (total time) | Noise dominated (detector-on time) | Marked lightcurve |
|---|---|---|---|---|---|---|---|
| A | 146786 | 128547 | 0 | 0 | 0.00% | 0.00% |  |
| B | 146786 | 128594 | 0 | 0 | 0.00% | 0.00% | 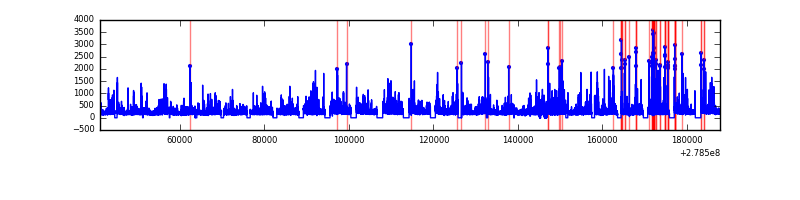 |
| C | 146786 | 128622 | 0 | 0 | 0.00% | 0.00% | 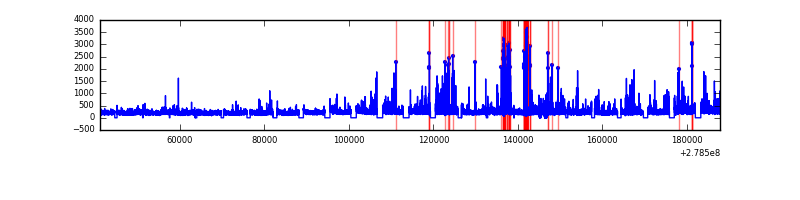 |
| D | 146786 | 126036 | 0 | 0 | 0.00% | 0.00% |  |
Top three noisy pixels from each quadrant. If the there are fewer than three noisy pixels in the level2.evt file, extra rows are filled as -1
| Pixel properties | Quadrant properties | ||||||
|---|---|---|---|---|---|---|---|
| Quadrant | DetID | PixID | Counts | Sigma | Mean | Median | Sigma |
| A | 0 | 29 | 7288 | 11.14 | 1982 | 1859 | 487.4 |
| A | 7 | 110 | 6305 | 9.12 | 1982 | 1859 | 487.4 |
| A | 0 | 30 | 5840 | 8.17 | 1982 | 1859 | 487.4 |
| B | 2 | 9 | 6112 | 10.82 | 1996 | 1905 | 389.0 |
| B | 2 | 8 | 5069 | 8.13 | 1996 | 1905 | 389.0 |
| B | 5 | 128 | 5009 | 7.98 | 1996 | 1905 | 389.0 |
| C | 12 | 241 | 5312 | 6.48 | 2047 | 1915 | 523.8 |
| C | 3 | 126 | 5276 | 6.42 | 2047 | 1915 | 523.8 |
| C | 2 | 191 | 5219 | 6.31 | 2047 | 1915 | 523.8 |
| D | 6 | 231 | 3985 | 5.99 | 1585 | 1445 | 423.9 |
| D | 10 | 189 | 3860 | 5.7 | 1585 | 1445 | 423.9 |
| D | 6 | 67 | 3848 | 5.67 | 1585 | 1445 | 423.9 |
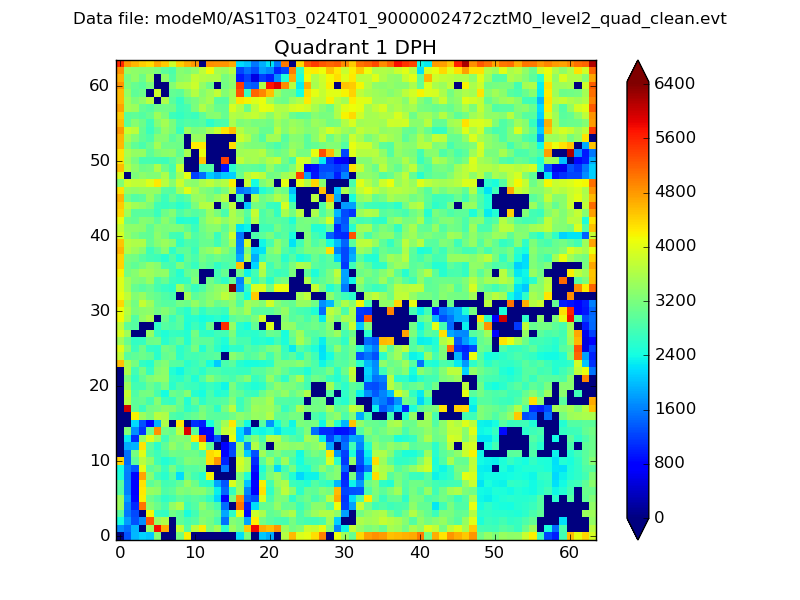
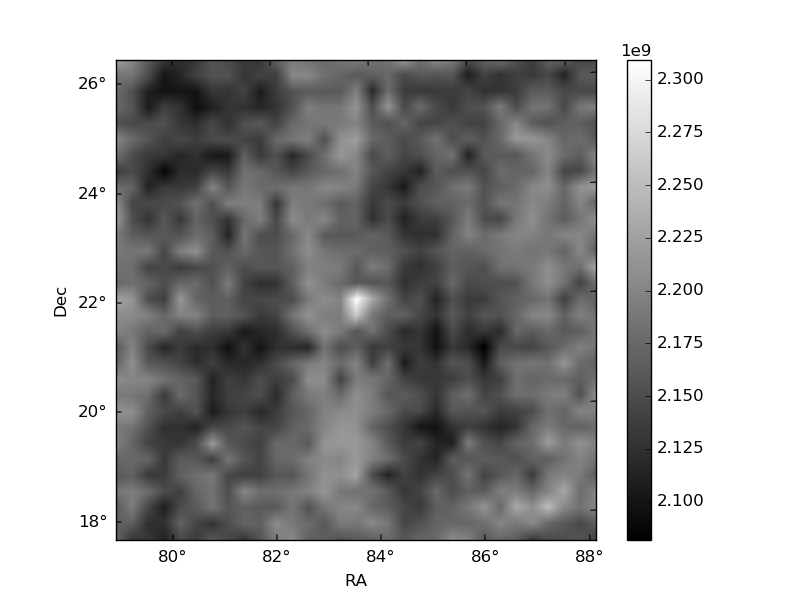
Histogram calculated using DETX and DETY for each event in the final _common_clean file
| Quadrant A | 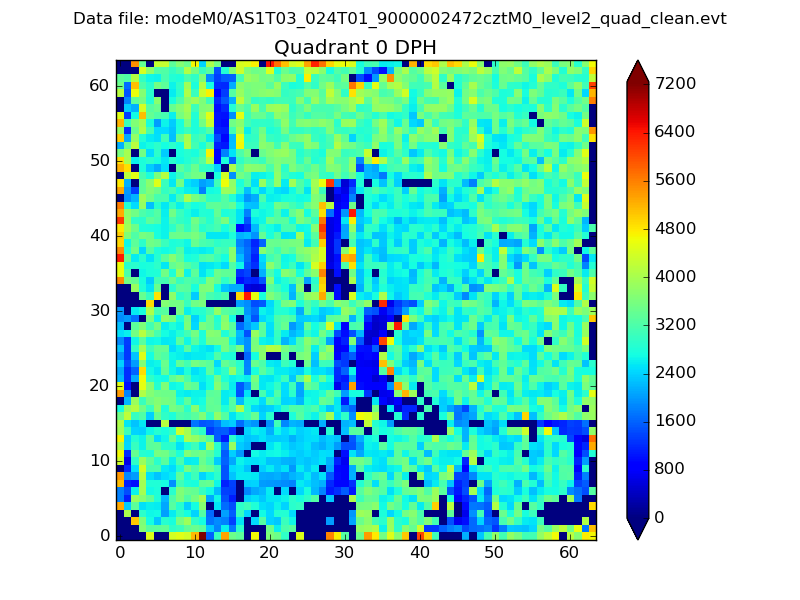 |
 |
Quadrant B |
|---|---|---|---|
| Quadrant D | 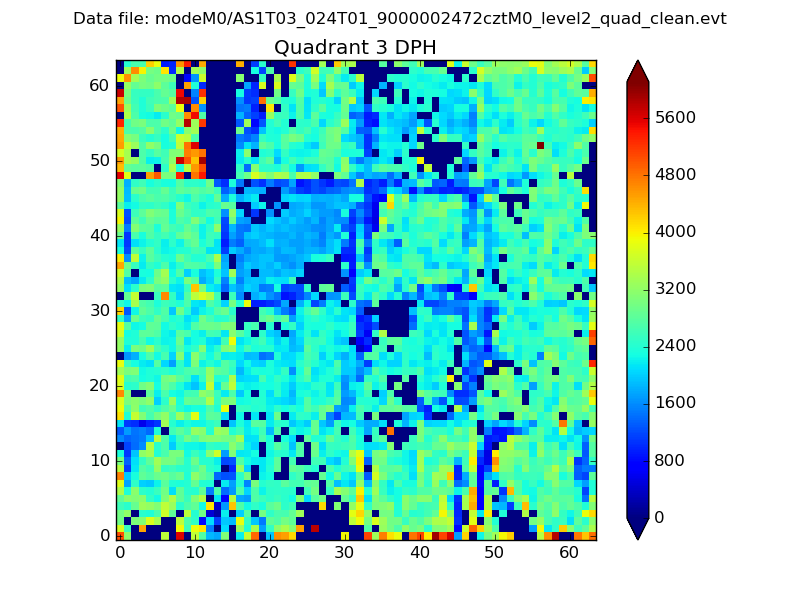 |
 |
Quadrant C |
| Plot type | Count rate plots | Images |
|---|---|---|
| Comparison with Poisson distribution Blue bars denote a histogram of data divided into 1 sec bins. Red curve is a Poisson curve with rate = median count rate of data. |
 |
 |
| Quadrant-wise count rates Data is divided into 100 sec bins |
 |
|
| Module-wise count rates for Quadrant A Data is divided into 100 sec bins |
 |
 |
| Module-wise count rates for Quadrant B Data is divided into 100 sec bins |
 |
 |
| Module-wise count rates for Quadrant C Data is divided into 100 sec bins |
 |
 |
| Module-wise count rates for Quadrant D Data is divided into 100 sec bins |
 |
 |
| Parameter | Plot |
|---|---|
| CZT HV Monitor |  |
| D_VDD | 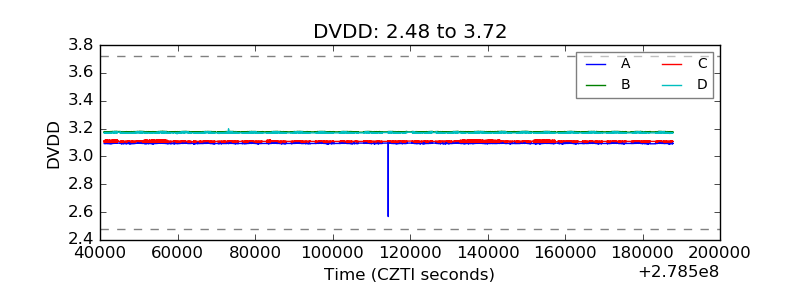 |
| Temperature 1 |  |
| Veto HV Monitor |  |
| Veto LLD |  |
| Alpha Counter | 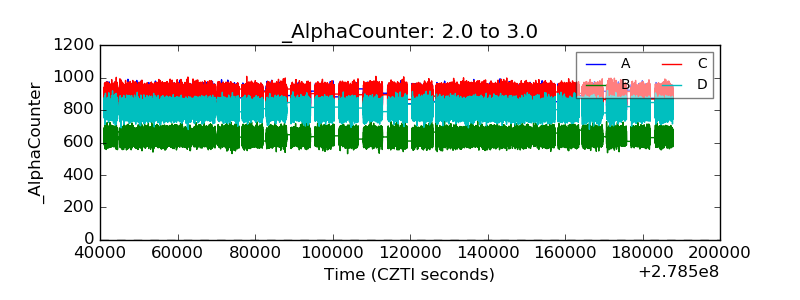 |
| _CPM_Rate |  |
| CZT Counter |  |
| +2.5 Volts monitor |  |
| +5 Volts monitor |  |
| _ROLL_ROT |  |
| _Roll_DEC | 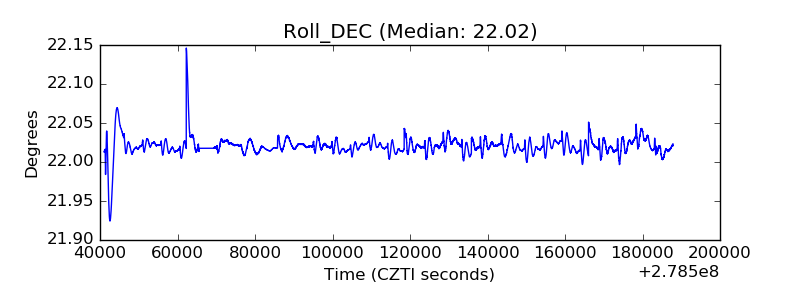 |
| _Roll_RA | 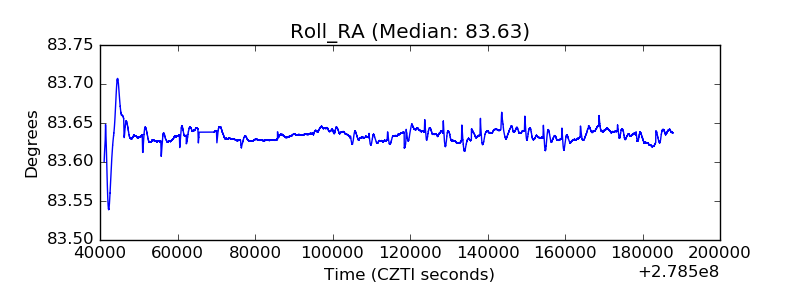 |
| Veto Counter |  |