| Param | Original file | Final file |
|---|---|---|
| Filename | modeM0/AS1T03_024T01_9000002472_16692cztM0_level2.evt | modeM0/AS1T03_024T01_9000002472_16692cztM0_level2_quad_clean.evt |
| Size (bytes) | 491,613,120 | 67,996,800 |
| Size | 468.8 MB | 64.8 MB |
| Events in quadrant A | 4,767,421 | 419,280 |
| Events in quadrant B | 2,738,192 | 454,656 |
| Events in quadrant C | 2,480,886 | 441,088 |
| Events in quadrant D | 4,567,771 | 397,911 |
| Mode M9 | |||
|---|---|---|---|
| Quadrant | BADHDUFLAG | Total packets | Discarded packets |
| A | 0 | 6 | 0 |
| B | 0 | 6 | 0 |
| C | 0 | 6 | 0 |
| D | 0 | 6 | 0 |
| Mode M0 | |||
|---|---|---|---|
| Quadrant | BADHDUFLAG | Total packets | Discarded packets |
| A | 0 | 17535 | 2 |
| B | 0 | 11243 | 1 |
| C | 0 | 10357 | 1 |
| D | 0 | 16971 | 1 |
| Mode SS | |||
|---|---|---|---|
| Quadrant | BADHDUFLAG | Total packets | Discarded packets |
| A | 0 | 100 | 0 |
| B | 0 | 100 | 0 |
| C | 0 | 100 | 0 |
| D | 0 | 100 | 0 |
| Quadrant | Total seconds | Saturated seconds | Saturation percentage |
|---|---|---|---|
| A | 4928 | 891 | 18.080357% |
| B | 4928 | 132 | 2.678571% |
| C | 4928 | 102 | 2.069805% |
| D | 4928 | 483 | 9.801136% |
Noise dominated data is calculated using 1-second bins in cleaned event files. If a bin has >2000 counts, and if more than 50% of those come from <1% of pixels, then it is considered to be noise-dominated and hence unusable.
| Quadrant | # 1 sec bins | Bins with >0 counts | Bins with >2000 counts | High rate bins dominated by noise | Noise dominated (total time) | Noise dominated (detector-on time) | Marked lightcurve |
|---|---|---|---|---|---|---|---|
| A | 5494 | 4930 | 541 | 541 | 9.85% | 10.97% | 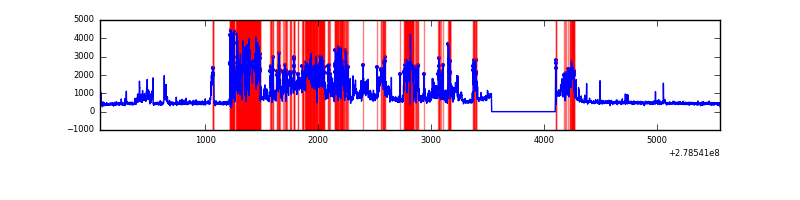 |
| B | 5494 | 4930 | 21 | 21 | 0.38% | 0.43% | 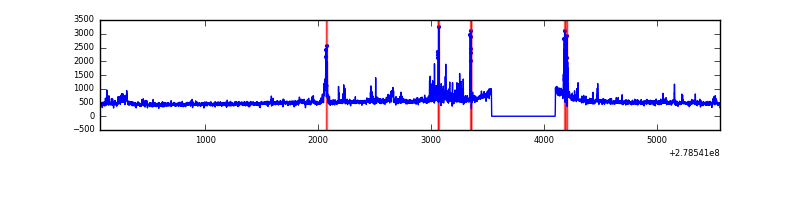 |
| C | 5494 | 4930 | 0 | 0 | 0.00% | 0.00% | 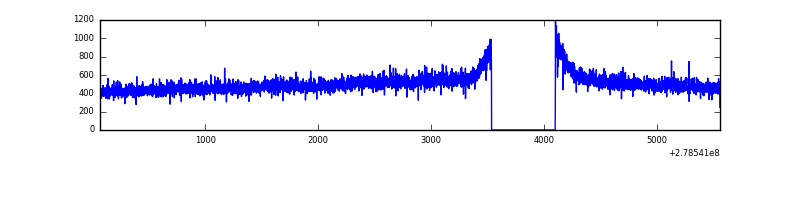 |
| D | 5494 | 4930 | 317 | 317 | 5.77% | 6.43% | 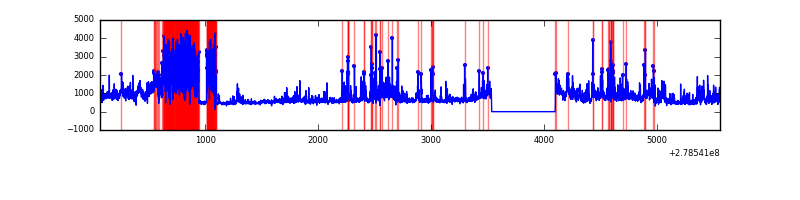 |
Top three noisy pixels from each quadrant. If the there are fewer than three noisy pixels in the level2.evt file, extra rows are filled as -1
| Pixel properties | Quadrant properties | ||||||
|---|---|---|---|---|---|---|---|
| Quadrant | DetID | PixID | Counts | Sigma | Mean | Median | Sigma |
| A | 15 | 174 | 2122013 | 17782.56 | 584 | 573 | 119.3 |
| A | 9 | 143 | 339571 | 2841.58 | 584 | 573 | 119.3 |
| A | 12 | 96 | 43311 | 358.24 | 584 | 573 | 119.3 |
| B | 15 | 35 | 103420 | 854.56 | 626 | 613 | 120.3 |
| B | 7 | 220 | 91155 | 752.61 | 626 | 613 | 120.3 |
| B | 0 | 197 | 33999 | 277.51 | 626 | 613 | 120.3 |
| C | 14 | 238 | 92888 | 648.81 | 603 | 609 | 142.2 |
| C | 3 | 233 | 22978 | 157.27 | 603 | 609 | 142.2 |
| C | 8 | 128 | 6635 | 42.37 | 603 | 609 | 142.2 |
| D | 5 | 222 | 1023733 | 7046.95 | 592 | 576 | 145.2 |
| D | 1 | 52 | 731405 | 5033.56 | 592 | 576 | 145.2 |
| D | 2 | 16 | 408080 | 2806.67 | 592 | 576 | 145.2 |
Histogram calculated using DETX and DETY for each event in the final _common_clean file
| Quadrant A | 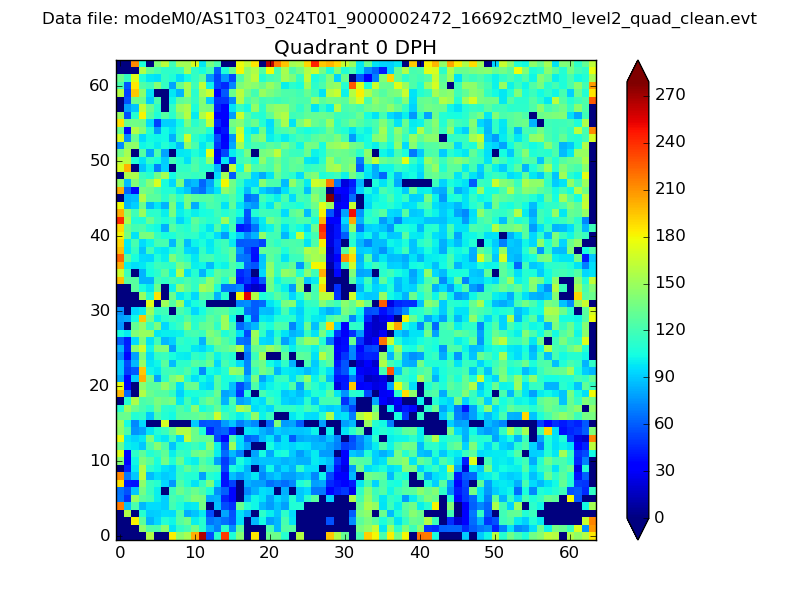 |
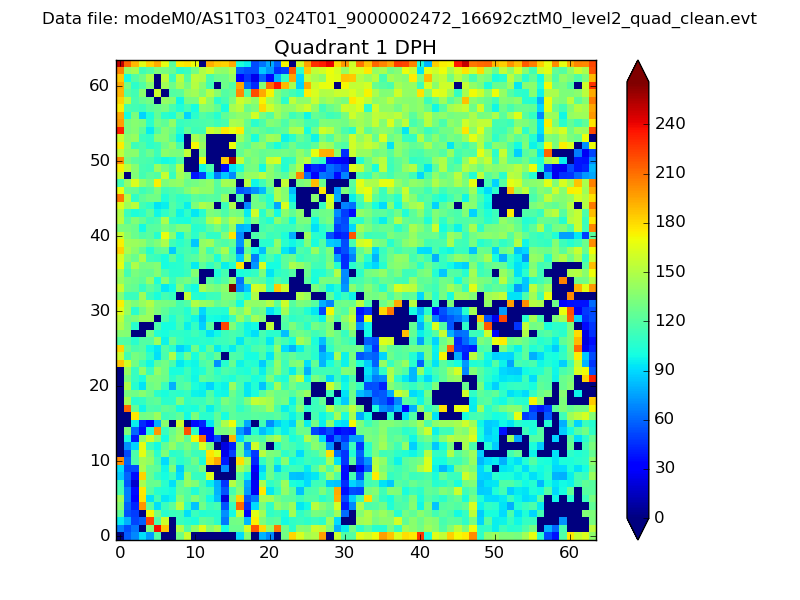 |
Quadrant B |
|---|---|---|---|
| Quadrant D | 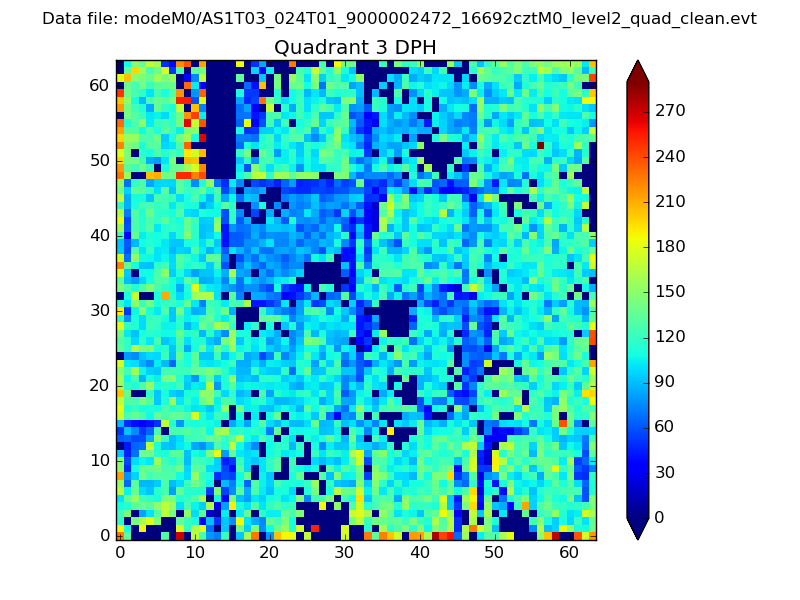 |
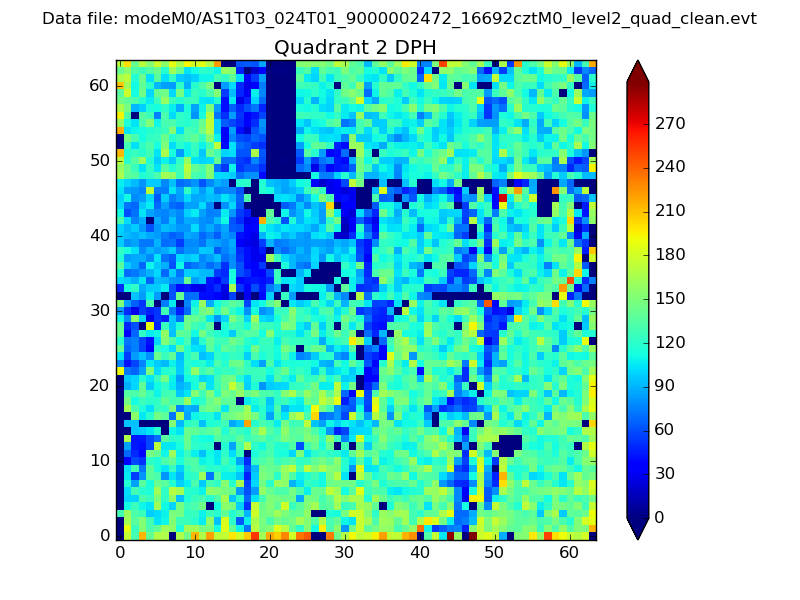 |
Quadrant C |
| Plot type | Count rate plots | Images |
|---|---|---|
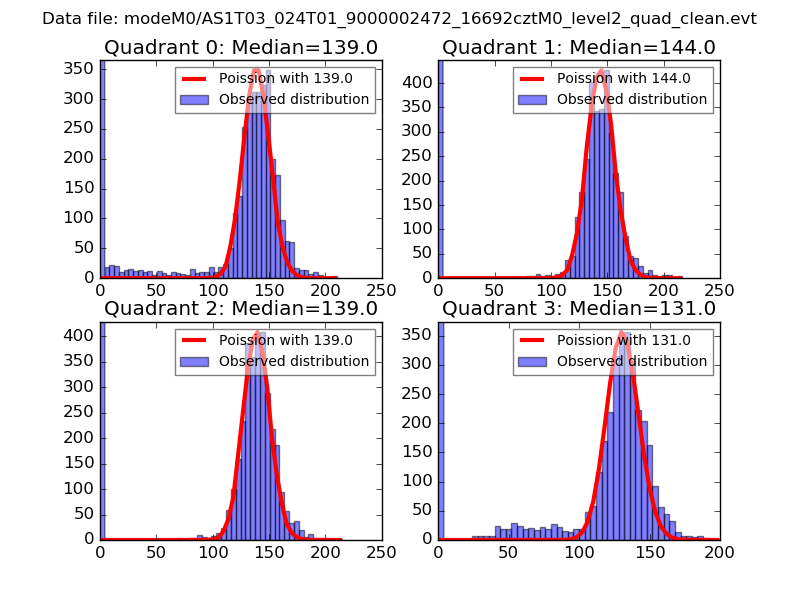
| Comparison with Poisson distribution Blue bars denote a histogram of data divided into 1 sec bins. Red curve is a Poisson curve with rate = median count rate of data. |
 |
 |
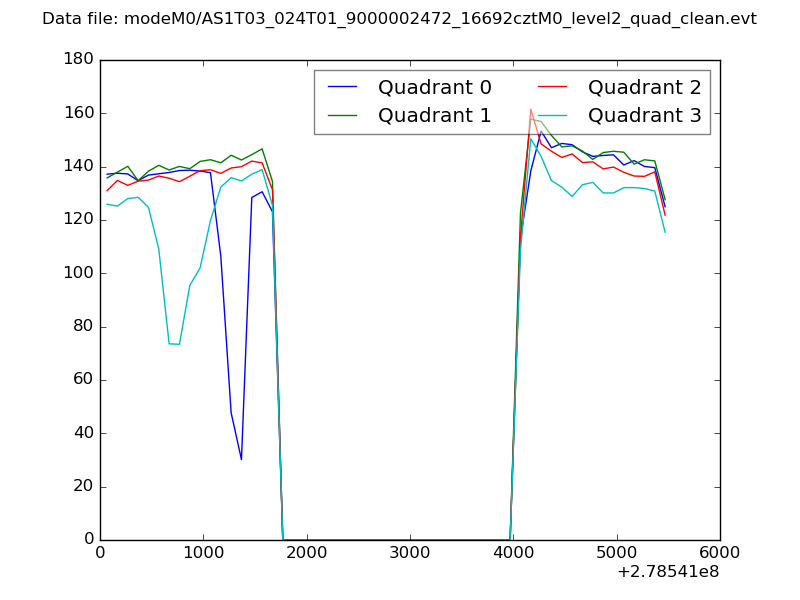
| Quadrant-wise count rates Data is divided into 100 sec bins |
 |
|
| Module-wise count rates for Quadrant A Data is divided into 100 sec bins |
 |
 |
| Module-wise count rates for Quadrant B Data is divided into 100 sec bins |
 |
 |
| Module-wise count rates for Quadrant C Data is divided into 100 sec bins |
 |
 |
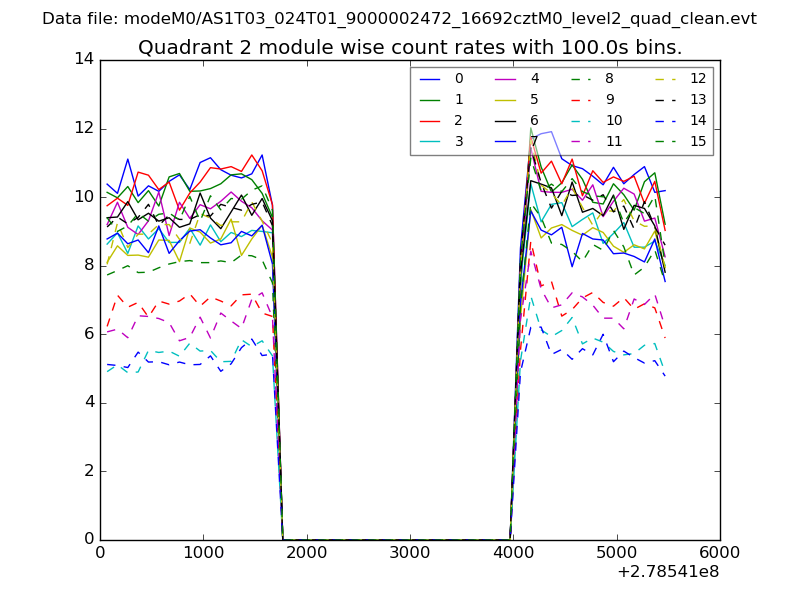
| Module-wise count rates for Quadrant D Data is divided into 100 sec bins |
 |
 |
| Parameter | Plot |
|---|---|
| CZT HV Monitor |  |
| D_VDD | 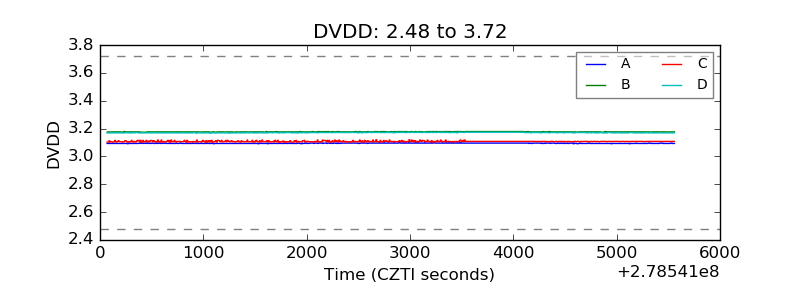 |
| Temperature 1 | 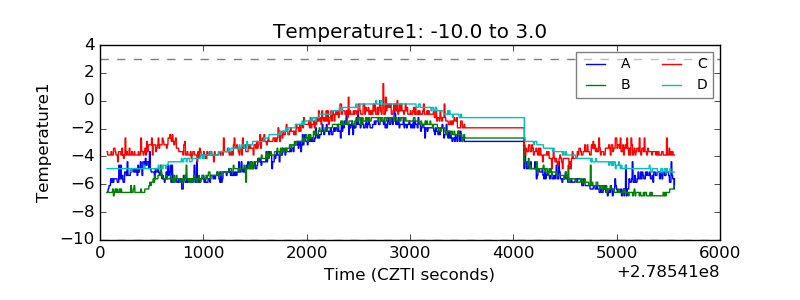 |
| Veto HV Monitor | 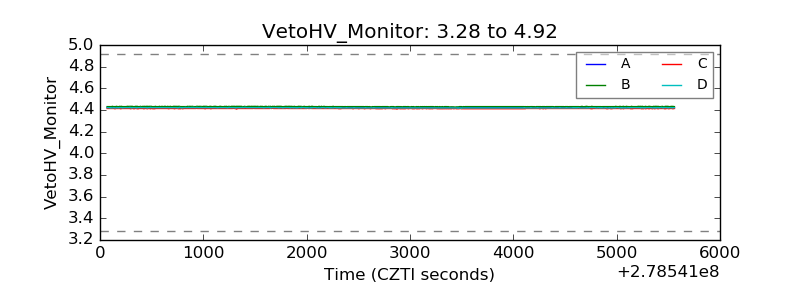 |
| Veto LLD |  |
| Alpha Counter | 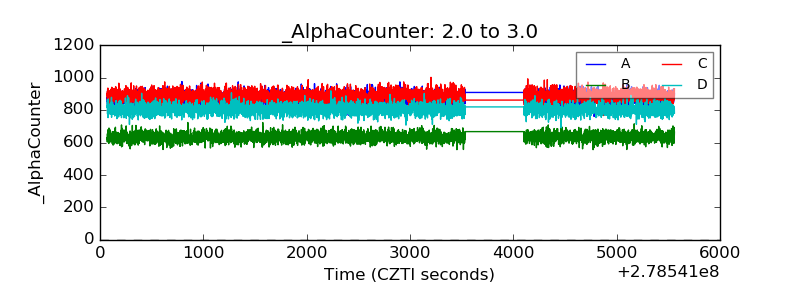 |
| _CPM_Rate | 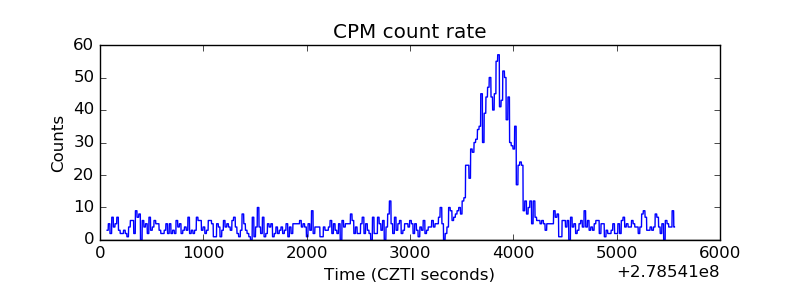 |
| CZT Counter | 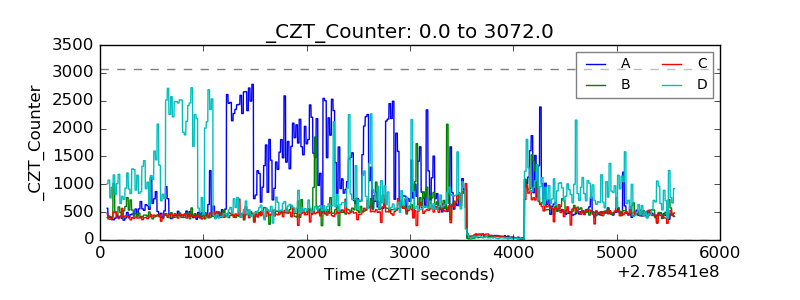 |
| +2.5 Volts monitor |  |
| +5 Volts monitor | 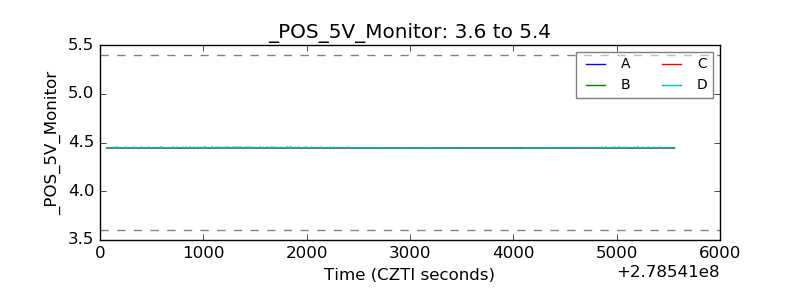 |
| _ROLL_ROT |  |
| _Roll_DEC | 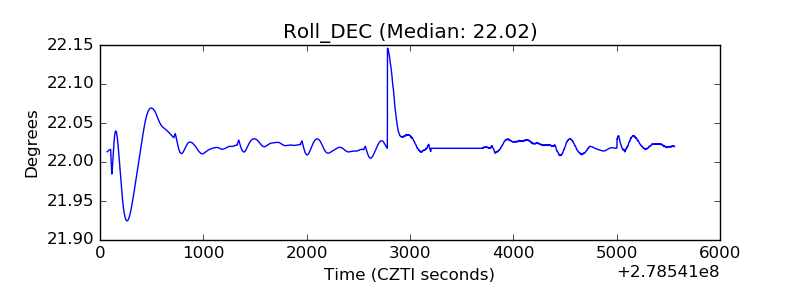 |
| _Roll_RA | 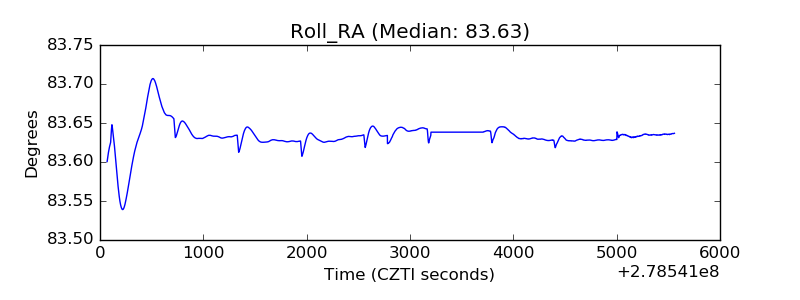 |
| Veto Counter |  |