| Param | Original file | Final file |
|---|---|---|
| Filename | modeM0/AS1T03_024T01_9000002472_16693cztM0_level2.evt | modeM0/AS1T03_024T01_9000002472_16693cztM0_level2_quad_clean.evt |
| Size (bytes) | 751,124,160 | 111,611,520 |
| Size | 716.3 MB | 106.4 MB |
| Events in quadrant A | 4,457,195 | 751,690 |
| Events in quadrant B | 3,978,465 | 765,110 |
| Events in quadrant C | 3,831,911 | 736,362 |
| Events in quadrant D | 9,968,087 | 600,041 |
| Mode M9 | |||
|---|---|---|---|
| Quadrant | BADHDUFLAG | Total packets | Discarded packets |
| A | 0 | 1 | 0 |
| B | 0 | 1 | 0 |
| C | 0 | 1 | 0 |
| D | 0 | 1 | 0 |
| Mode M0 | |||
|---|---|---|---|
| Quadrant | BADHDUFLAG | Total packets | Discarded packets |
| A | 0 | 18184 | 2 |
| B | 0 | 16566 | 1 |
| C | 0 | 16212 | 1 |
| D | 0 | 34835 | 1 |
| Mode SS | |||
|---|---|---|---|
| Quadrant | BADHDUFLAG | Total packets | Discarded packets |
| A | 0 | 154 | 0 |
| B | 0 | 154 | 0 |
| C | 0 | 154 | 0 |
| D | 0 | 154 | 0 |
| Quadrant | Total seconds | Saturated seconds | Saturation percentage |
|---|---|---|---|
| A | 7561 | 311 | 4.113213% |
| B | 7561 | 189 | 2.499669% |
| C | 7561 | 139 | 1.838381% |
| D | 7561 | 2624 | 34.704404% |
Noise dominated data is calculated using 1-second bins in cleaned event files. If a bin has >2000 counts, and if more than 50% of those come from <1% of pixels, then it is considered to be noise-dominated and hence unusable.
| Quadrant | # 1 sec bins | Bins with >0 counts | Bins with >2000 counts | High rate bins dominated by noise | Noise dominated (total time) | Noise dominated (detector-on time) | Marked lightcurve |
|---|---|---|---|---|---|---|---|
| A | 7702 | 7563 | 150 | 150 | 1.95% | 1.98% | 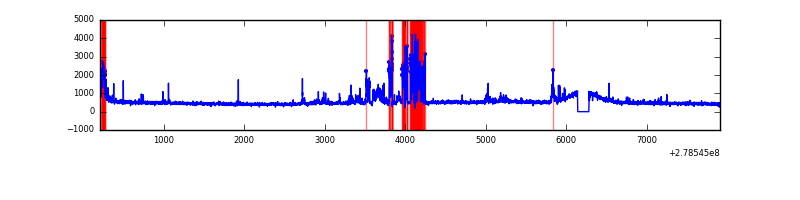 |
| B | 7702 | 7563 | 8 | 8 | 0.10% | 0.11% | 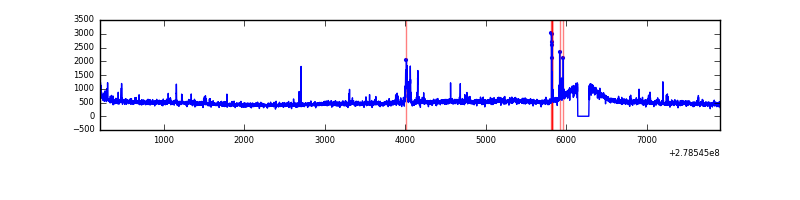 |
| C | 7702 | 7563 | 0 | 0 | 0.00% | 0.00% | 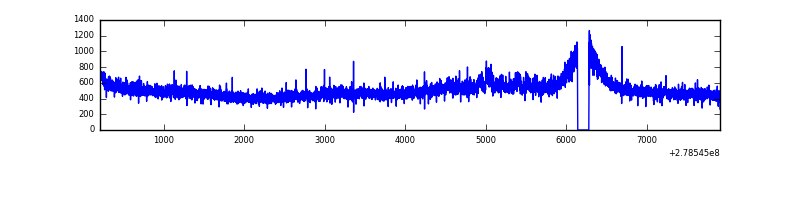 |
| D | 7702 | 7563 | 1896 | 1896 | 24.62% | 25.07% | 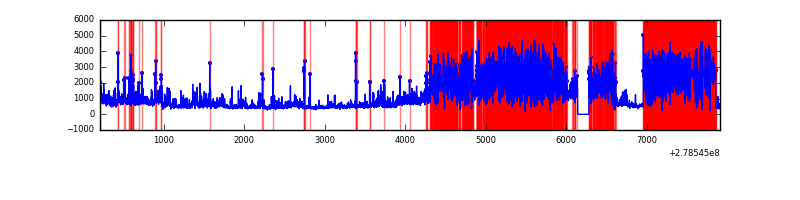 |
Top three noisy pixels from each quadrant. If the there are fewer than three noisy pixels in the level2.evt file, extra rows are filled as -1
| Pixel properties | Quadrant properties | ||||||
|---|---|---|---|---|---|---|---|
| Quadrant | DetID | PixID | Counts | Sigma | Mean | Median | Sigma |
| A | 15 | 174 | 699410 | 3607.49 | 948 | 930 | 193.6 |
| A | 9 | 143 | 87999 | 449.69 | 948 | 930 | 193.6 |
| A | 12 | 96 | 20558 | 101.37 | 948 | 930 | 193.6 |
| B | 15 | 35 | 131500 | 704.6 | 959 | 937 | 185.3 |
| B | 0 | 229 | 48599 | 257.21 | 959 | 937 | 185.3 |
| B | 0 | 189 | 28262 | 147.46 | 959 | 937 | 185.3 |
| C | 14 | 238 | 140489 | 638.02 | 921 | 930 | 218.7 |
| C | 3 | 233 | 86608 | 391.69 | 921 | 930 | 218.7 |
| C | 7 | 247 | 9941 | 41.2 | 921 | 930 | 218.7 |
| D | 1 | 52 | 5680419 | 30305.38 | 752 | 732 | 187.4 |
| D | 2 | 16 | 1152716 | 6146.7 | 752 | 732 | 187.4 |
| D | 5 | 222 | 136504 | 724.45 | 752 | 732 | 187.4 |
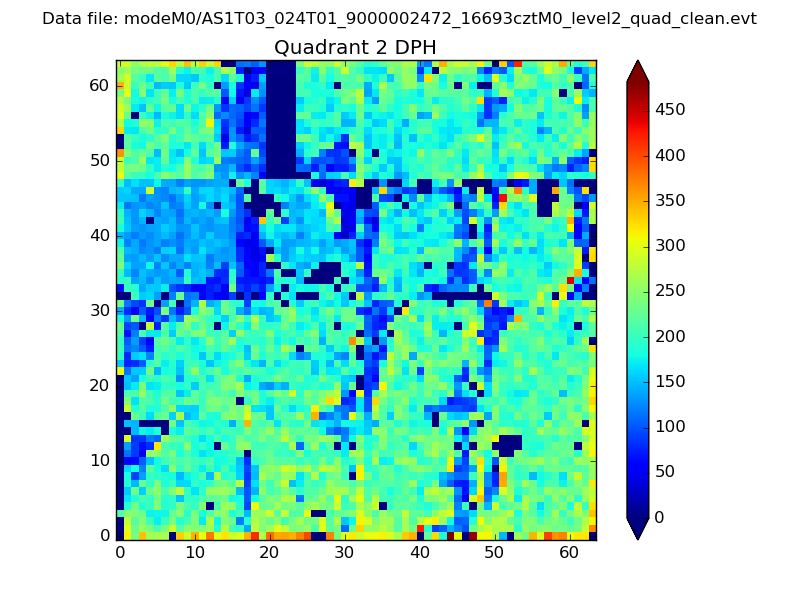
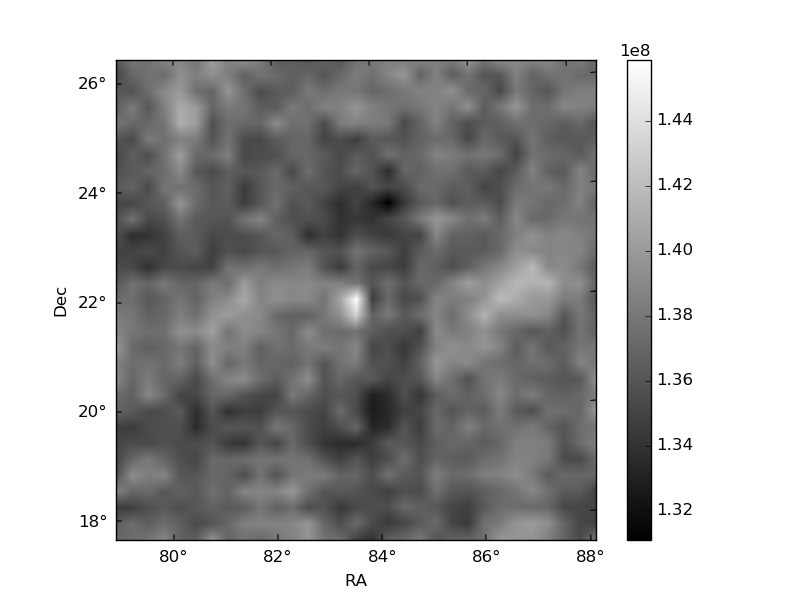
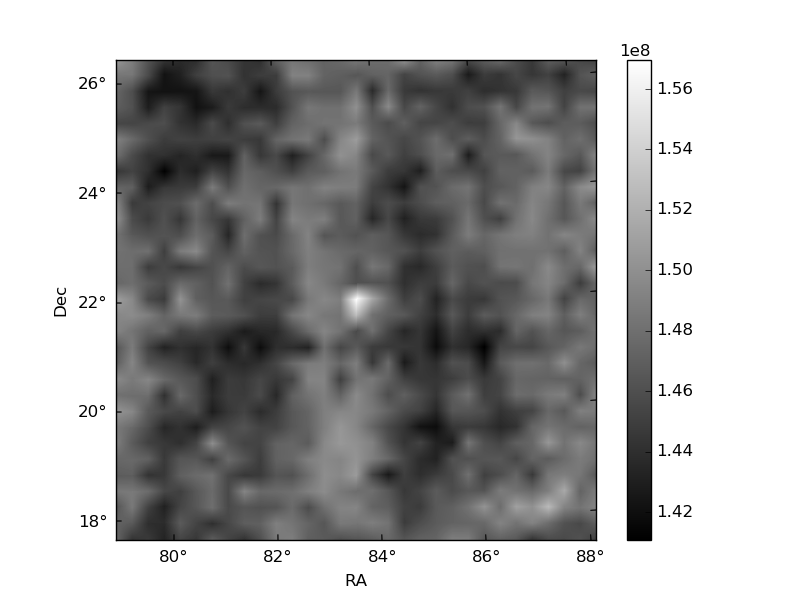
Histogram calculated using DETX and DETY for each event in the final _common_clean file
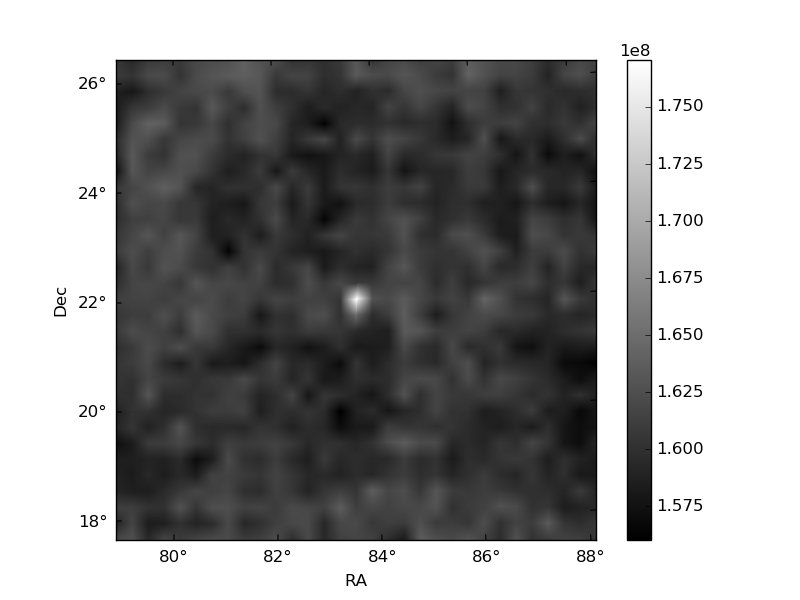
| Quadrant A |  |
 |
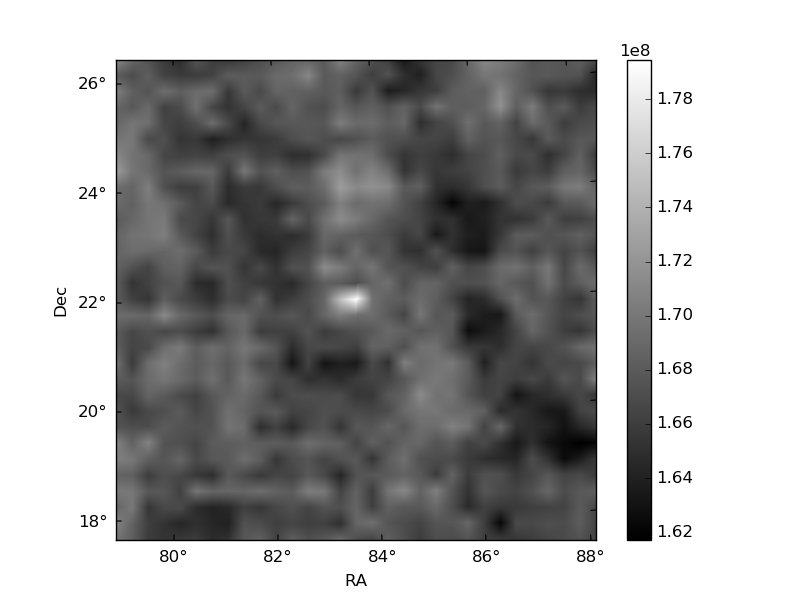
Quadrant B |
|---|---|---|---|
| Quadrant D | 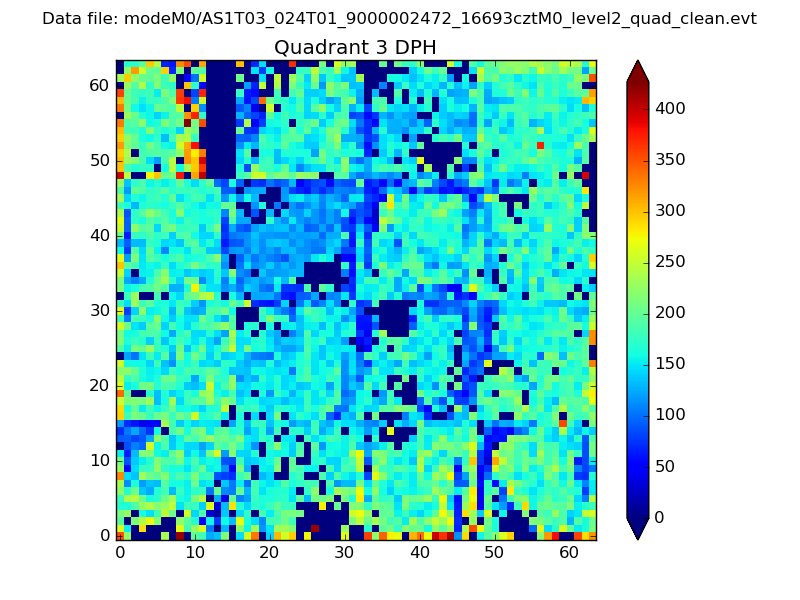 |
 |
Quadrant C |
| Plot type | Count rate plots | Images |
|---|---|---|
| Comparison with Poisson distribution Blue bars denote a histogram of data divided into 1 sec bins. Red curve is a Poisson curve with rate = median count rate of data. |
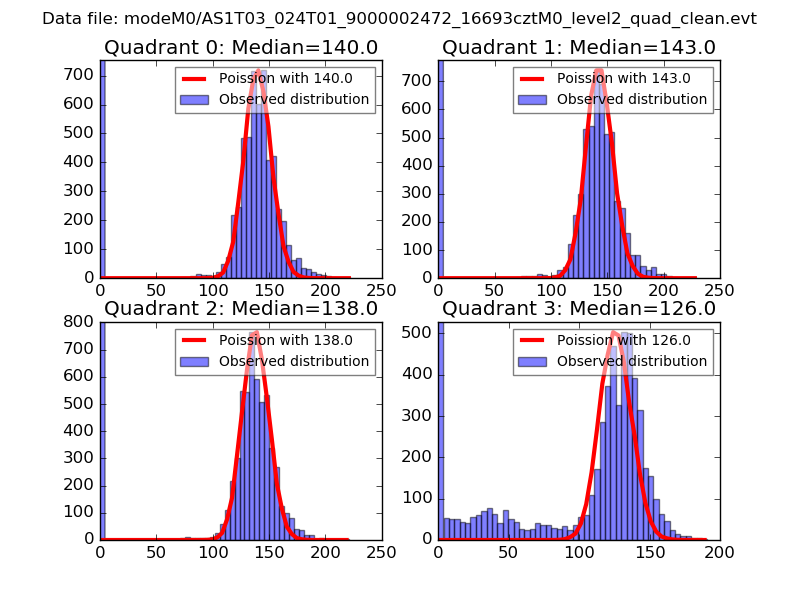 |
 |
| Quadrant-wise count rates Data is divided into 100 sec bins |
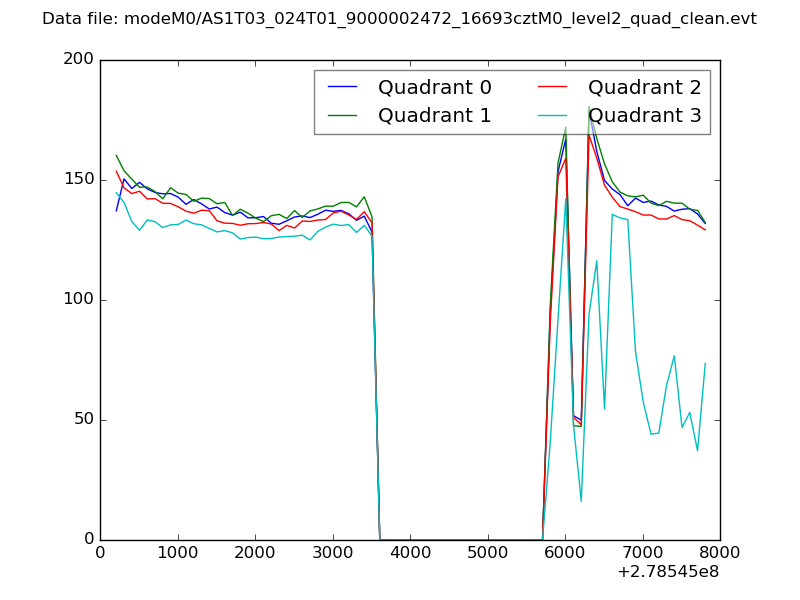 |
|
| Module-wise count rates for Quadrant A Data is divided into 100 sec bins |
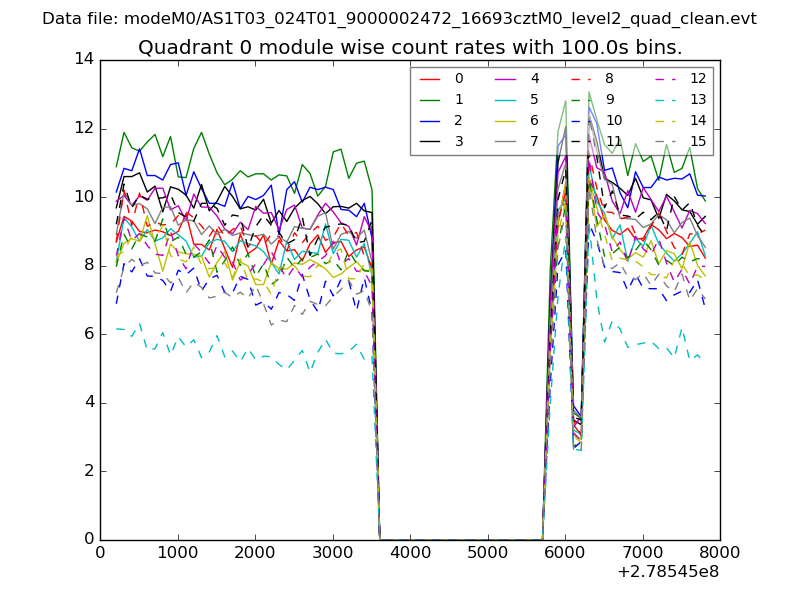 |
 |
| Module-wise count rates for Quadrant B Data is divided into 100 sec bins |
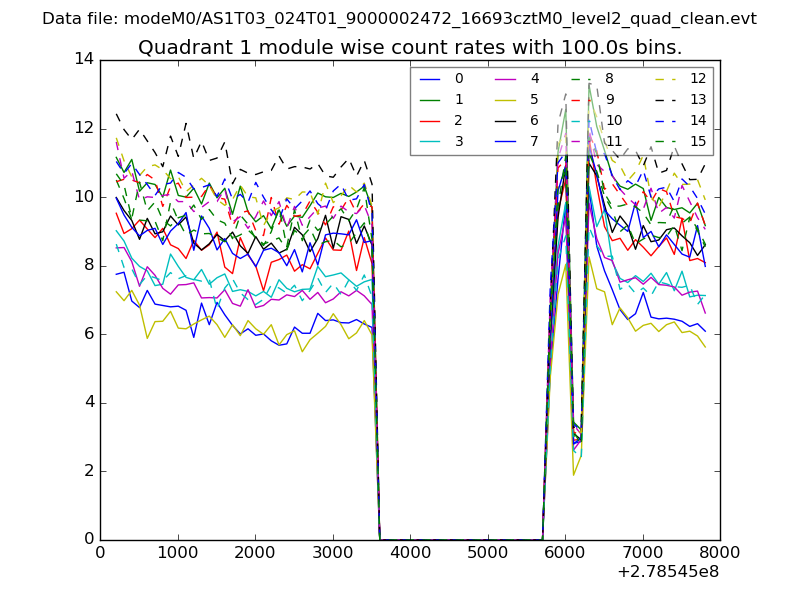 |
 |
| Module-wise count rates for Quadrant C Data is divided into 100 sec bins |
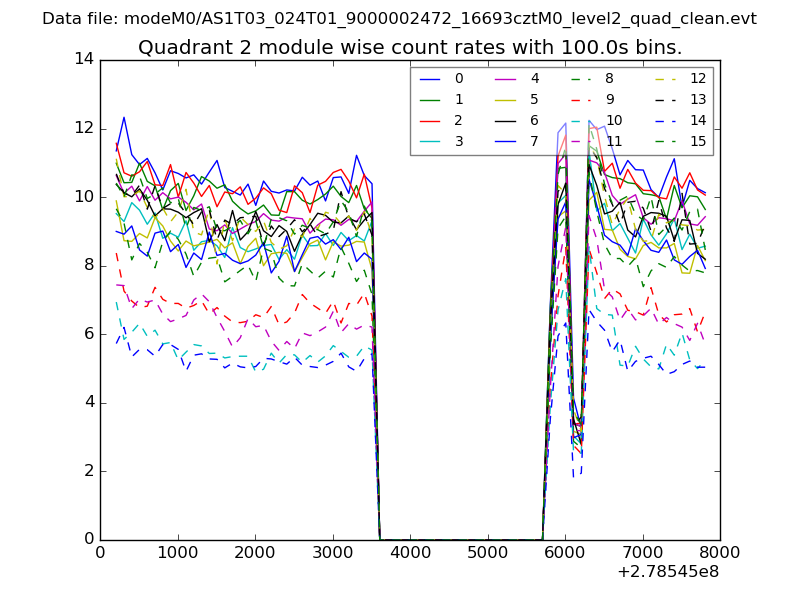 |
 |
| Module-wise count rates for Quadrant D Data is divided into 100 sec bins |
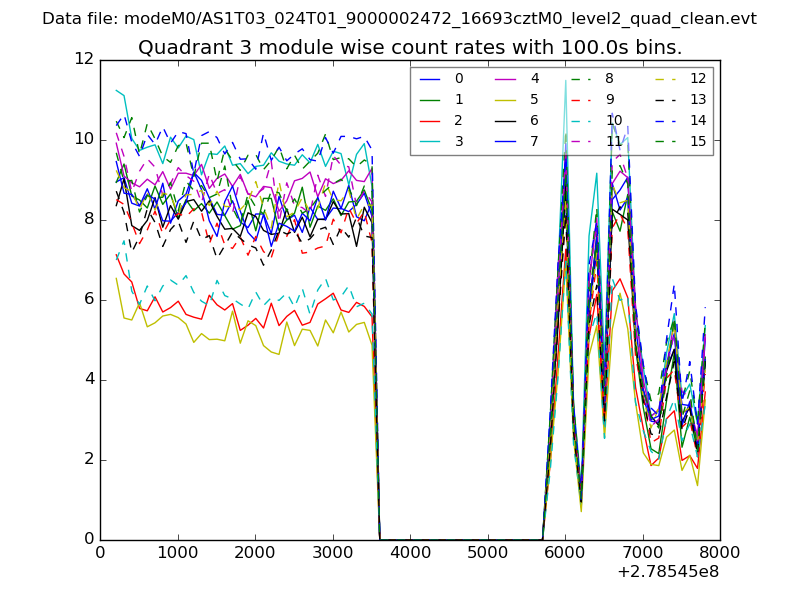 |
 |
| Parameter | Plot |
|---|---|
| CZT HV Monitor | 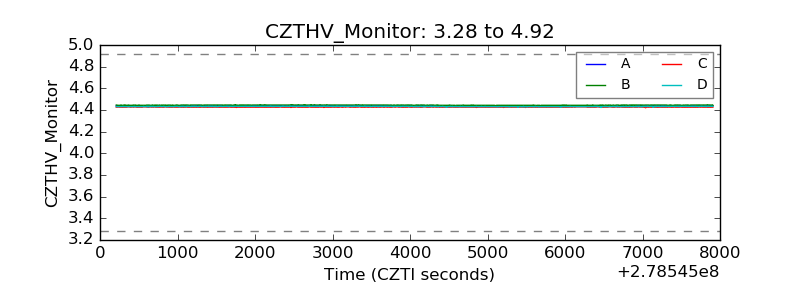 |
| D_VDD | 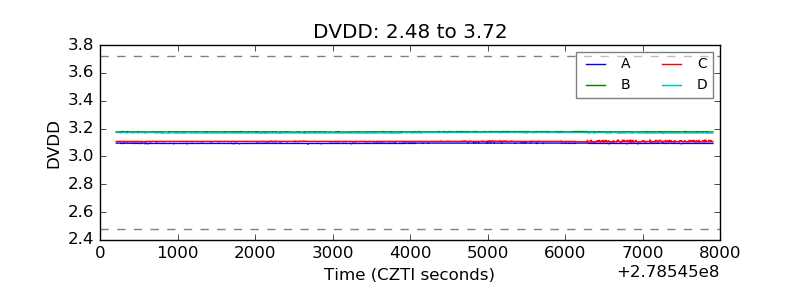 |
| Temperature 1 | 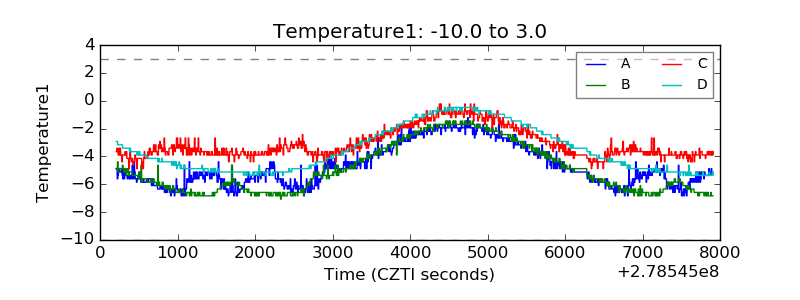 |
| Veto HV Monitor | 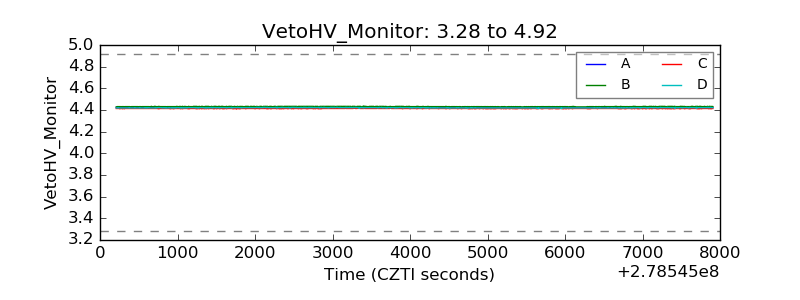 |
| Veto LLD | 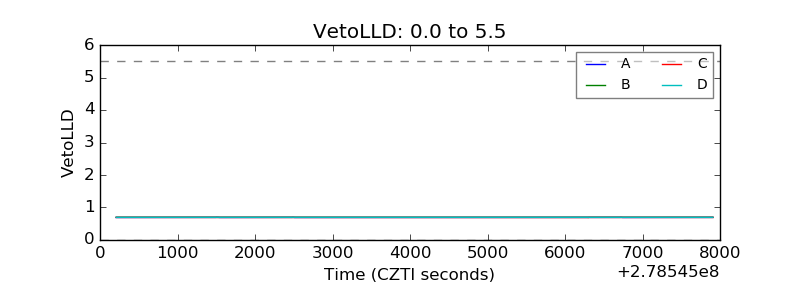 |
| Alpha Counter | 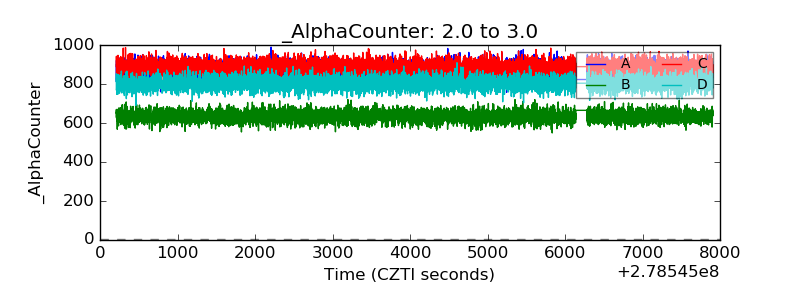 |
| _CPM_Rate | 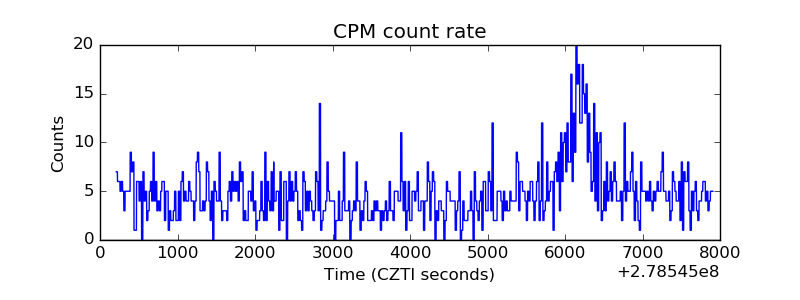 |
| CZT Counter |  |
| +2.5 Volts monitor |  |
| +5 Volts monitor | 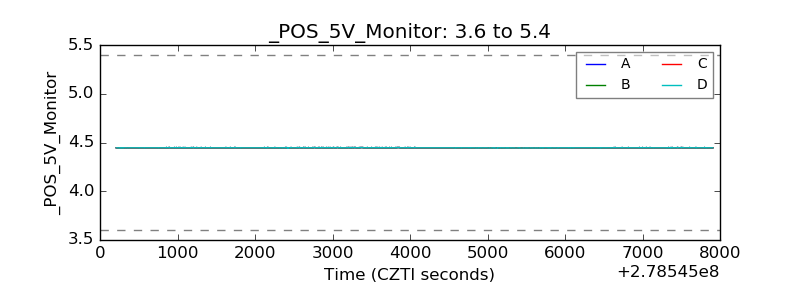 |
| _ROLL_ROT | 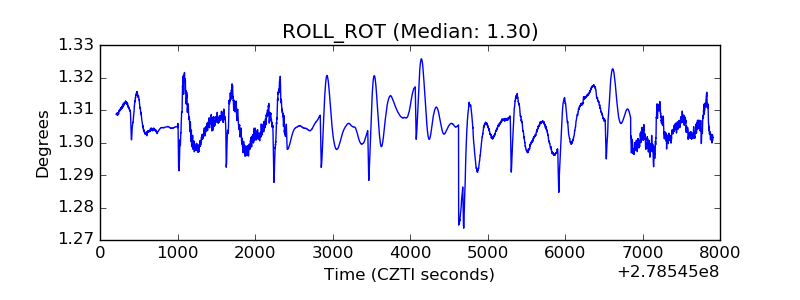 |
| _Roll_DEC | 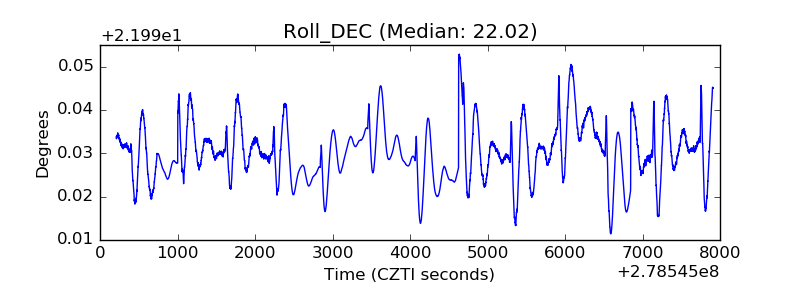 |
| _Roll_RA |  |
| Veto Counter | 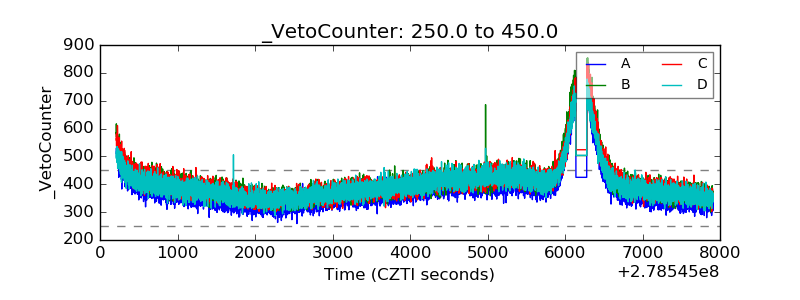 |