| Param | Original file | Final file |
|---|---|---|
| Filename | modeM0/AS1T03_024T01_9000002472_16694cztM0_level2.evt | modeM0/AS1T03_024T01_9000002472_16694cztM0_level2_quad_clean.evt |
| Size (bytes) | 475,041,600 | 67,357,440 |
| Size | 453.0 MB | 64.2 MB |
| Events in quadrant A | 3,016,449 | 454,636 |
| Events in quadrant B | 2,432,375 | 479,679 |
| Events in quadrant C | 2,399,602 | 473,219 |
| Events in quadrant D | 6,225,445 | 308,675 |
| Mode M9 | |||
|---|---|---|---|
| Quadrant | BADHDUFLAG | Total packets | Discarded packets |
| A | 0 | 2 | 0 |
| B | 0 | 2 | 1 |
| C | 0 | 3 | 1 |
| D | 0 | 2 | 0 |
| Mode M0 | |||
|---|---|---|---|
| Quadrant | BADHDUFLAG | Total packets | Discarded packets |
| A | 0 | 20812 | 8810 |
| B | 0 | 16602 | 6306 |
| C | 0 | 16187 | 5924 |
| D | 0 | 34972 | 13606 |
| Mode SS | |||
|---|---|---|---|
| Quadrant | BADHDUFLAG | Total packets | Discarded packets |
| A | 0 | 152 | 50 |
| B | 0 | 152 | 50 |
| C | 0 | 152 | 50 |
| D | 0 | 151 | 45 |
| Quadrant | Total seconds | Saturated seconds | Saturation percentage |
|---|---|---|---|
| A | 4512 | 356 | 7.890071% |
| B | 4750 | 69 | 1.452632% |
| C | 4822 | 63 | 1.306512% |
| D | 4134 | 1438 | 34.784712% |
Noise dominated data is calculated using 1-second bins in cleaned event files. If a bin has >2000 counts, and if more than 50% of those come from <1% of pixels, then it is considered to be noise-dominated and hence unusable.
| Quadrant | # 1 sec bins | Bins with >0 counts | Bins with >2000 counts | High rate bins dominated by noise | Noise dominated (total time) | Noise dominated (detector-on time) | Marked lightcurve |
|---|---|---|---|---|---|---|---|
| A | 6563 | 5225 | 141 | 141 | 2.15% | 2.70% | 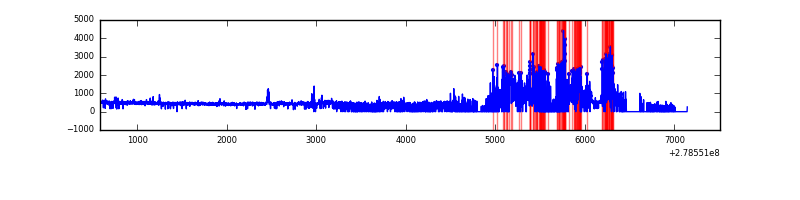 |
| B | 6442 | 5455 | 1 | 1 | 0.02% | 0.02% | 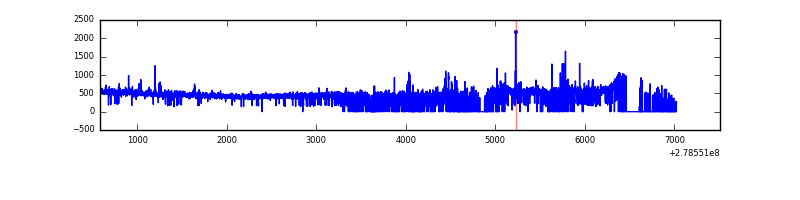 |
| C | 6928 | 5533 | 0 | 0 | 0.00% | 0.00% | 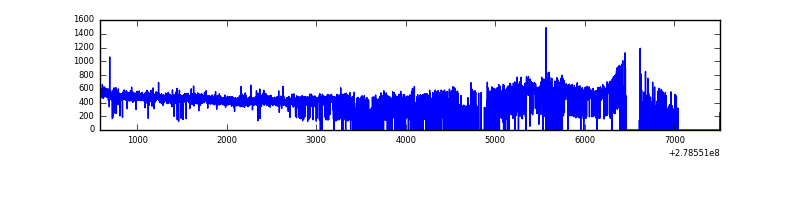 |
| D | 6466 | 4845 | 1103 | 1103 | 17.06% | 22.77% | 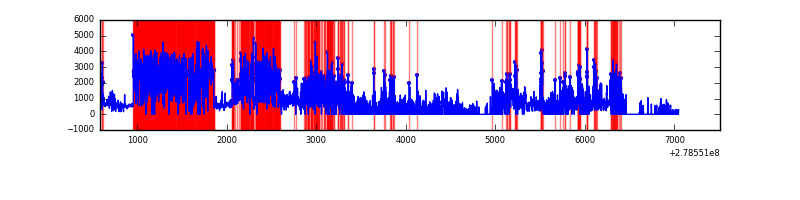 |
Top three noisy pixels from each quadrant. If the there are fewer than three noisy pixels in the level2.evt file, extra rows are filled as -1
| Pixel properties | Quadrant properties | ||||||
|---|---|---|---|---|---|---|---|
| Quadrant | DetID | PixID | Counts | Sigma | Mean | Median | Sigma |
| A | 15 | 174 | 881511 | 8056.55 | 530 | 522 | 109.4 |
| A | 12 | 96 | 41952 | 378.87 | 530 | 522 | 109.4 |
| A | 15 | 190 | 33396 | 300.63 | 530 | 522 | 109.4 |
| B | 15 | 35 | 80321 | 707.73 | 581 | 569 | 112.7 |
| B | 0 | 229 | 52340 | 459.42 | 581 | 569 | 112.7 |
| B | 0 | 189 | 15417 | 131.76 | 581 | 569 | 112.7 |
| C | 14 | 238 | 86775 | 638.02 | 567 | 574 | 135.1 |
| C | 3 | 233 | 83993 | 617.43 | 567 | 574 | 135.1 |
| C | 8 | 128 | 8298 | 57.17 | 567 | 574 | 135.1 |
| D | 1 | 52 | 4392473 | 43970.52 | 402 | 391 | 99.9 |
| D | 2 | 16 | 123113 | 1228.61 | 402 | 391 | 99.9 |
| D | 5 | 222 | 107429 | 1071.59 | 402 | 391 | 99.9 |
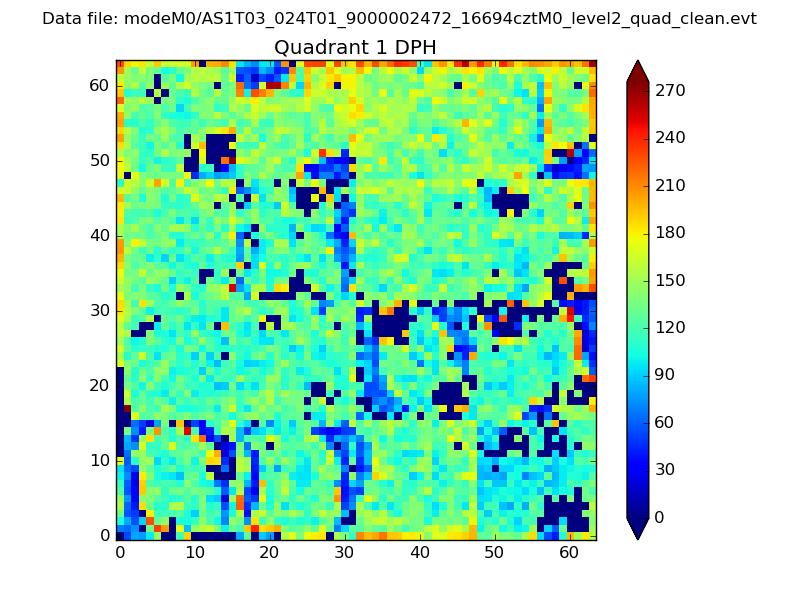
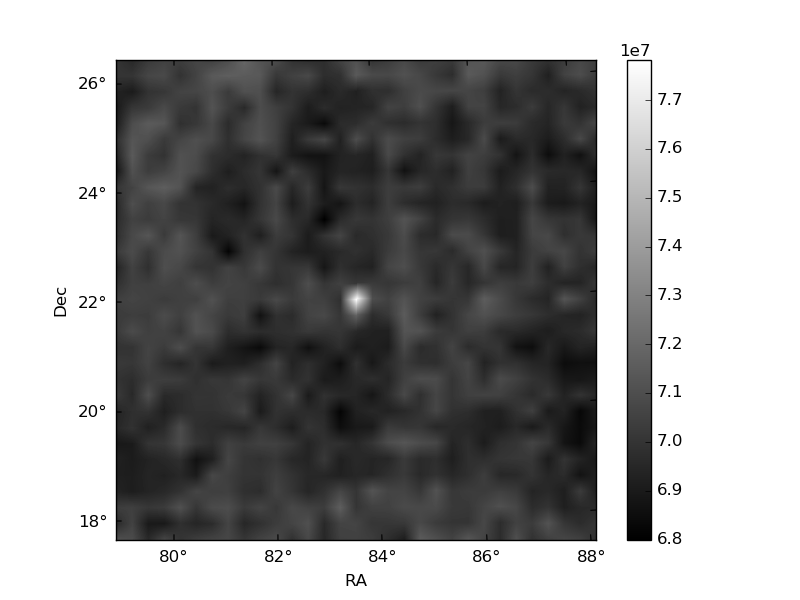
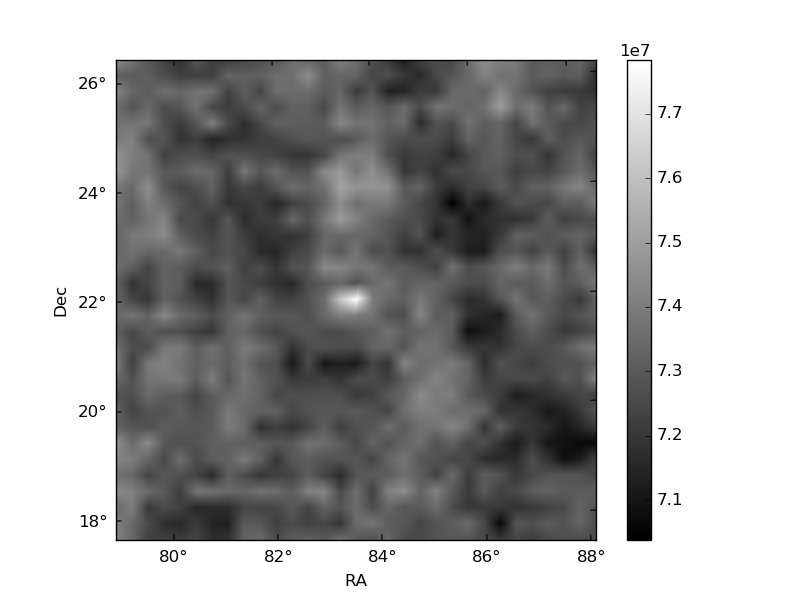
Histogram calculated using DETX and DETY for each event in the final _common_clean file
| Quadrant A |  |
 |
Quadrant B |
|---|---|---|---|
| Quadrant D | 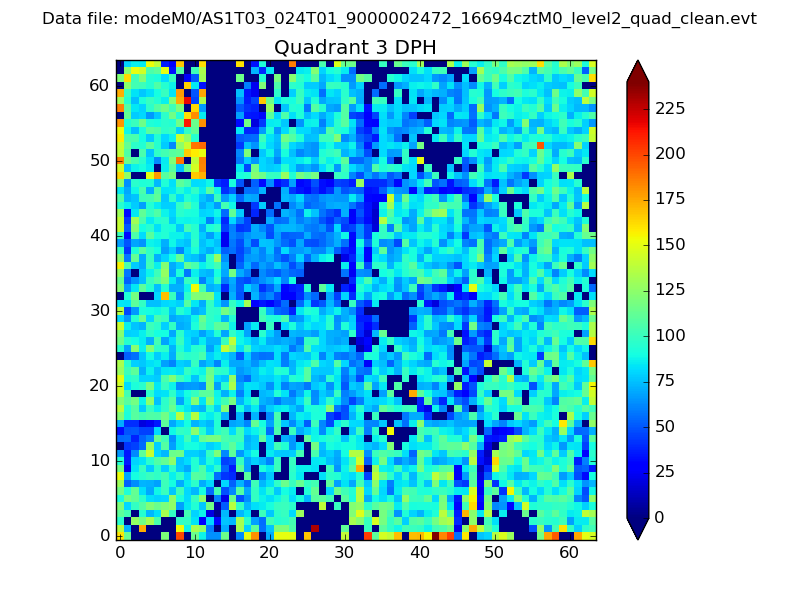 |
 |
Quadrant C |
| Plot type | Count rate plots | Images |
|---|---|---|
| Comparison with Poisson distribution Blue bars denote a histogram of data divided into 1 sec bins. Red curve is a Poisson curve with rate = median count rate of data. |
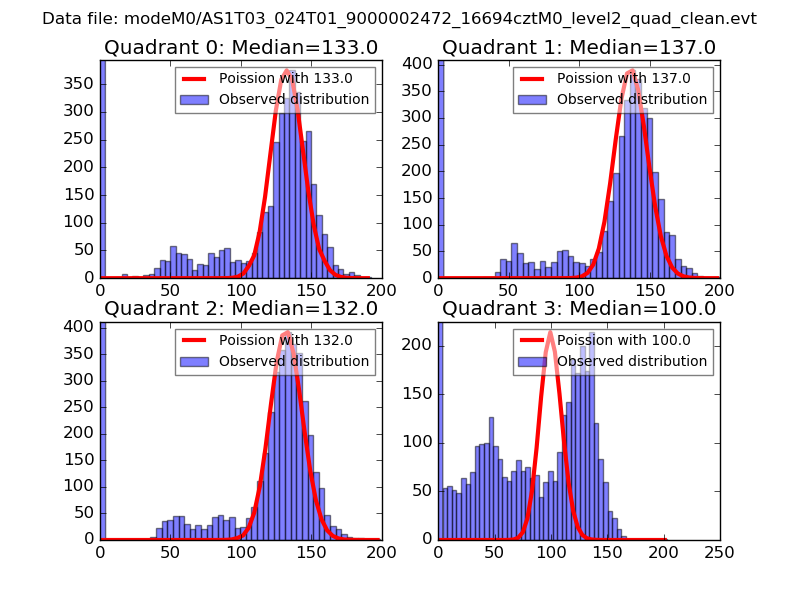 |
 |
| Quadrant-wise count rates Data is divided into 100 sec bins |
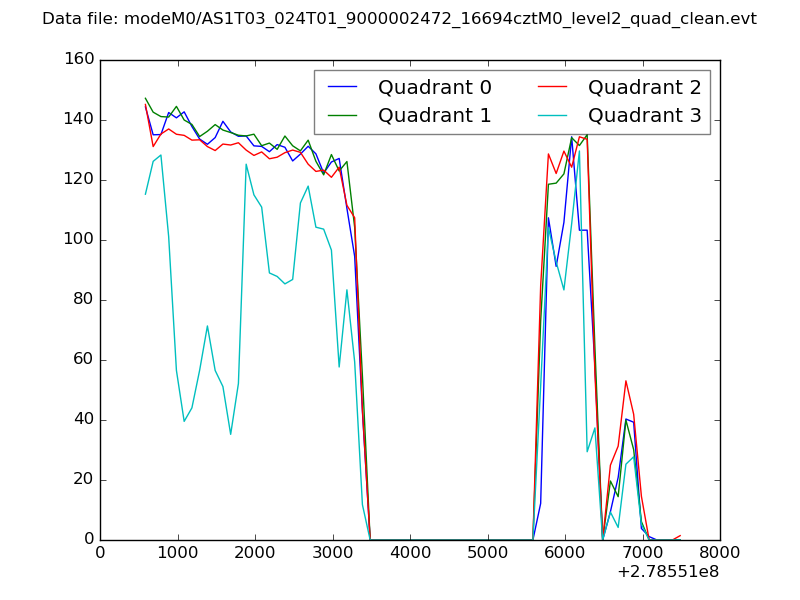 |
|
| Module-wise count rates for Quadrant A Data is divided into 100 sec bins |
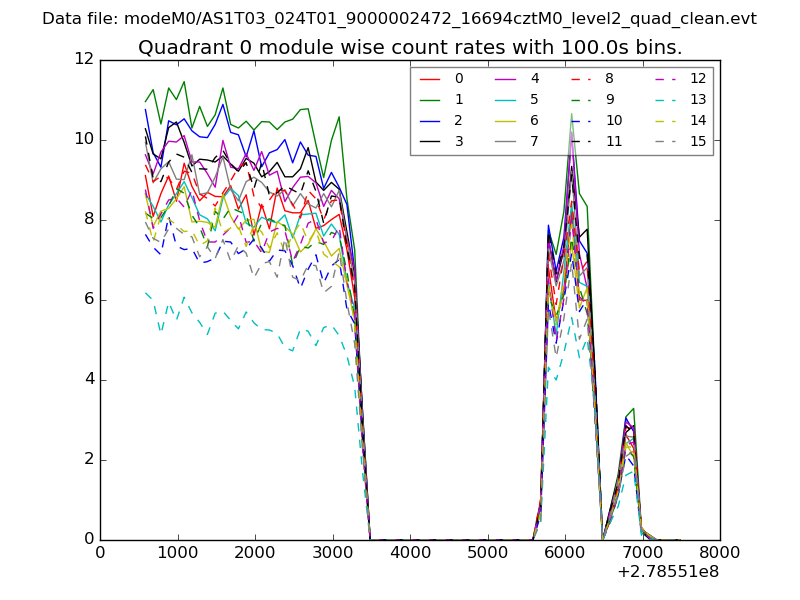 |
 |
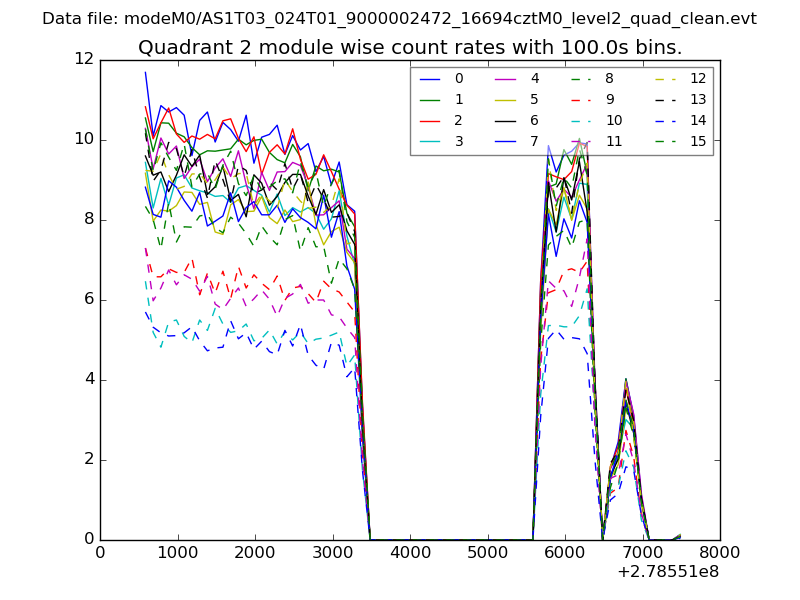
| Module-wise count rates for Quadrant B Data is divided into 100 sec bins |
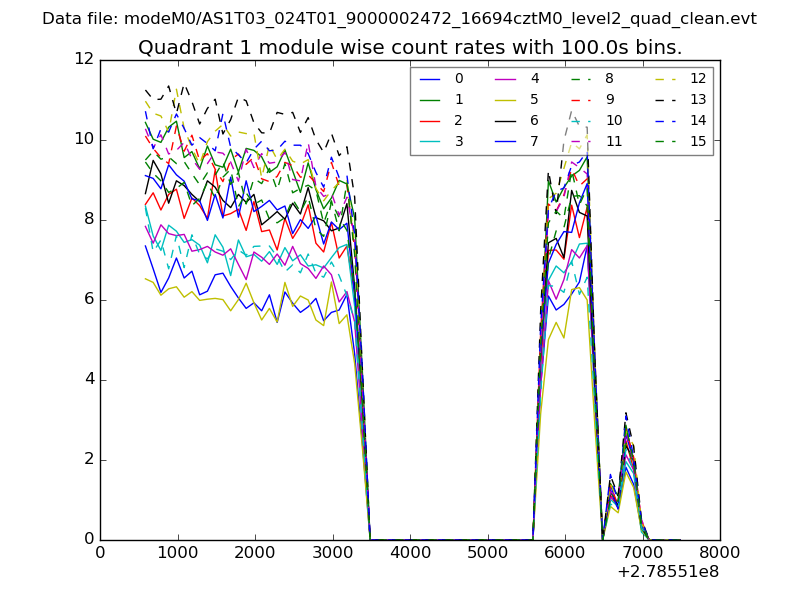 |
 |
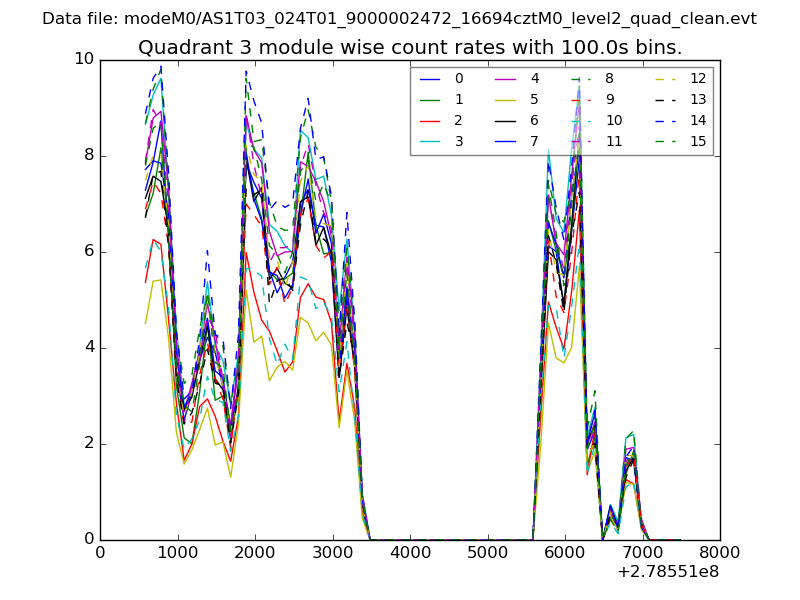
| Module-wise count rates for Quadrant C Data is divided into 100 sec bins |
 |
 |
| Module-wise count rates for Quadrant D Data is divided into 100 sec bins |
 |
 |
| Parameter | Plot |
|---|---|
| CZT HV Monitor |  |
| D_VDD | 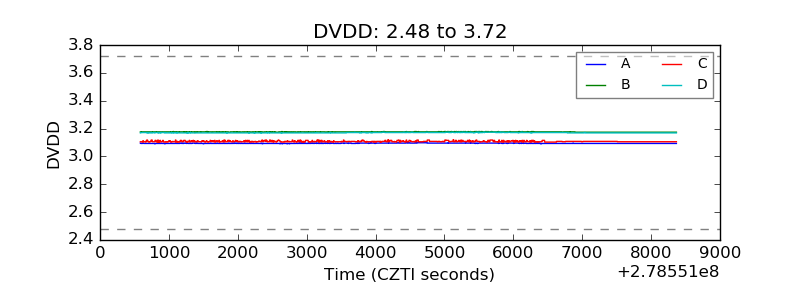 |
| Temperature 1 | 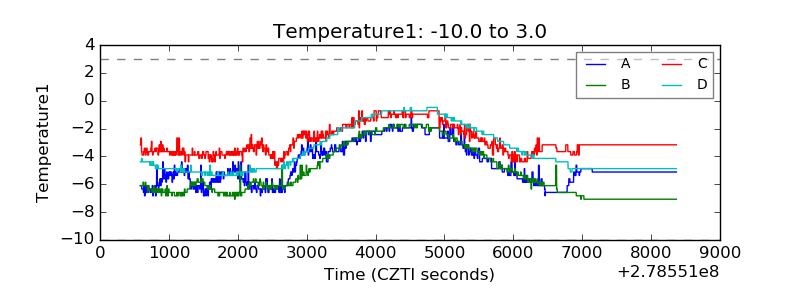 |
| Veto HV Monitor | 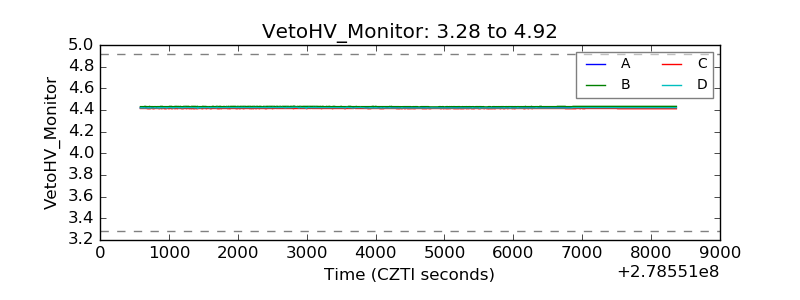 |
| Veto LLD | 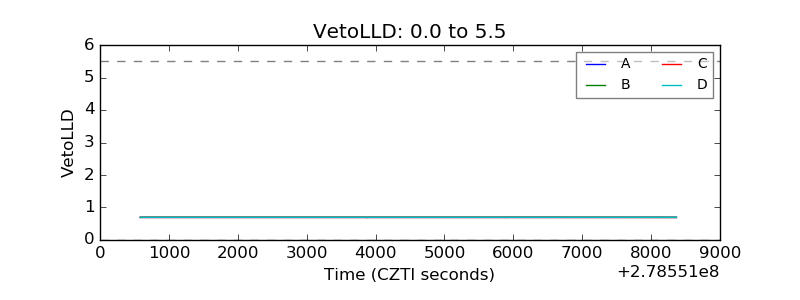 |
| Alpha Counter | 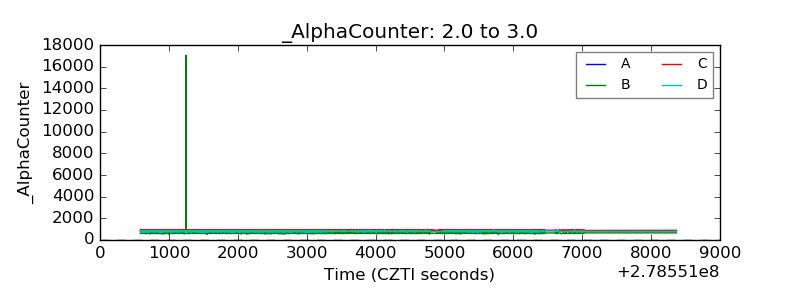 |
| _CPM_Rate | 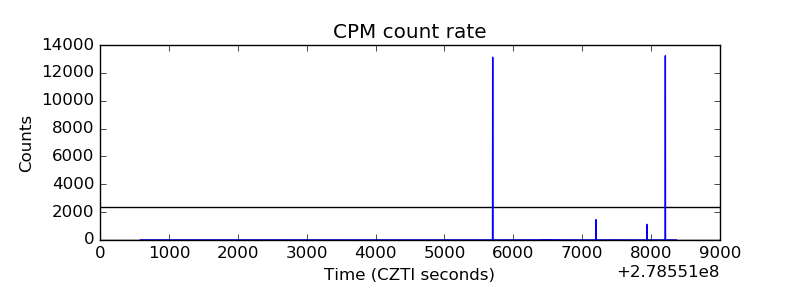 |
| CZT Counter |  |
| +2.5 Volts monitor |  |
| +5 Volts monitor | 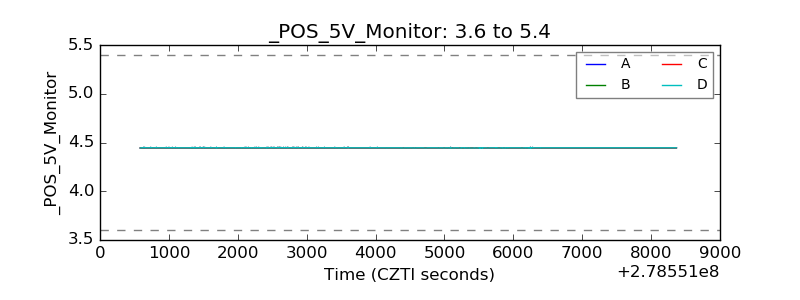 |
| _ROLL_ROT | 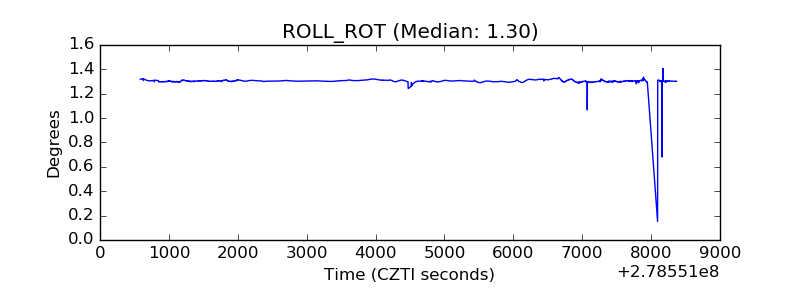 |
| _Roll_DEC | 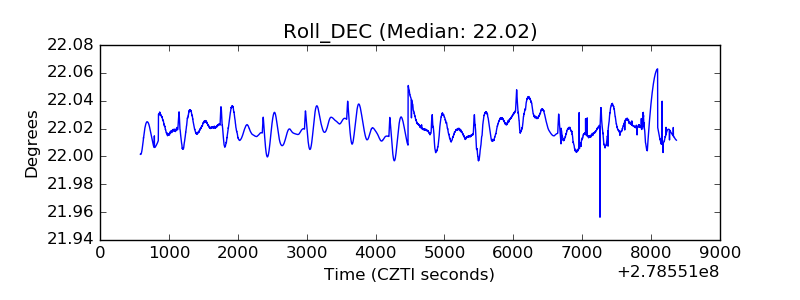 |
| _Roll_RA |  |
| Veto Counter | 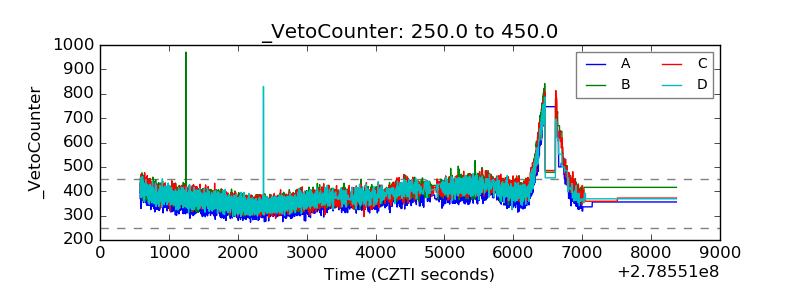 |