| Param | Original file | Final file |
|---|---|---|
| Filename | modeM0/AS1T03_024T01_9000002472_16697cztM0_level2.evt | modeM0/AS1T03_024T01_9000002472_16697cztM0_level2_quad_clean.evt |
| Size (bytes) | 2,004,540,480 | 241,712,640 |
| Size | 1.9 GB | 230.5 MB |
| Events in quadrant A | 15,024,440 | 1,586,234 |
| Events in quadrant B | 9,601,405 | 1,675,077 |
| Events in quadrant C | 9,030,181 | 1,614,569 |
| Events in quadrant D | 25,789,228 | 1,151,235 |
| Mode M9 | |||
|---|---|---|---|
| Quadrant | BADHDUFLAG | Total packets | Discarded packets |
| A | 0 | 18 | 0 |
| B | 0 | 18 | 0 |
| C | 0 | 18 | 0 |
| D | 0 | 18 | 0 |
| Mode M0 | |||
|---|---|---|---|
| Quadrant | BADHDUFLAG | Total packets | Discarded packets |
| A | 0 | 56894 | 5 |
| B | 0 | 40082 | 4 |
| C | 0 | 38468 | 4 |
| D | 0 | 89398 | 4 |
| Mode SS | |||
|---|---|---|---|
| Quadrant | BADHDUFLAG | Total packets | Discarded packets |
| A | 0 | 382 | 0 |
| B | 0 | 382 | 0 |
| C | 0 | 382 | 0 |
| D | 0 | 382 | 0 |
| Quadrant | Total seconds | Saturated seconds | Saturation percentage |
|---|---|---|---|
| A | 18744 | 1995 | 10.643406% |
| B | 18744 | 225 | 1.200384% |
| C | 18744 | 231 | 1.232394% |
| D | 18744 | 7106 | 37.910798% |
Noise dominated data is calculated using 1-second bins in cleaned event files. If a bin has >2000 counts, and if more than 50% of those come from <1% of pixels, then it is considered to be noise-dominated and hence unusable.
| Quadrant | # 1 sec bins | Bins with >0 counts | Bins with >2000 counts | High rate bins dominated by noise | Noise dominated (total time) | Noise dominated (detector-on time) | Marked lightcurve |
|---|---|---|---|---|---|---|---|
| A | 20490 | 18749 | 1377 | 1377 | 6.72% | 7.34% | 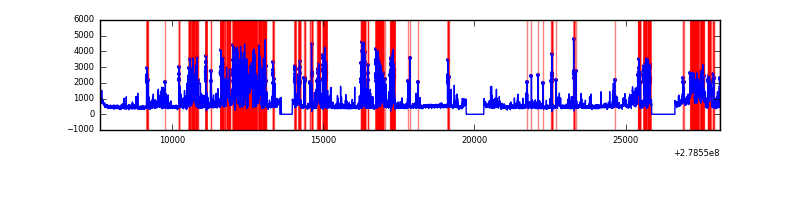 |
| B | 20490 | 18749 | 10 | 10 | 0.05% | 0.05% | 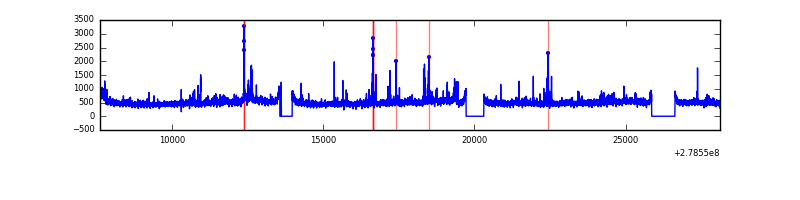 |
| C | 20490 | 18749 | 0 | 0 | 0.00% | 0.00% | 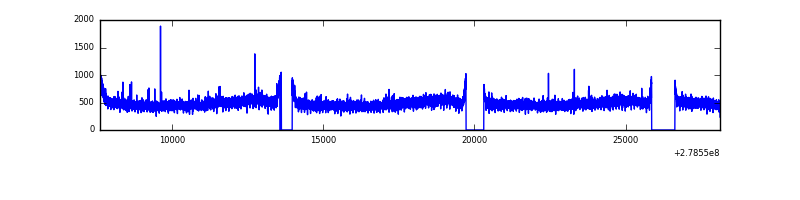 |
| D | 20490 | 18748 | 5351 | 5351 | 26.12% | 28.54% | 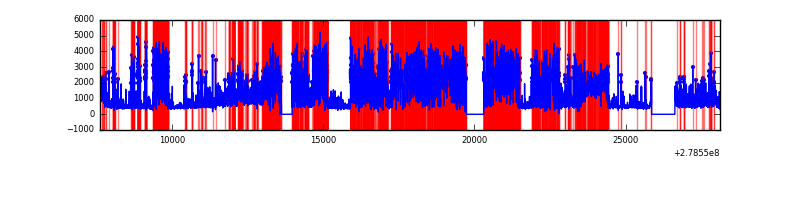 |
Top three noisy pixels from each quadrant. If the there are fewer than three noisy pixels in the level2.evt file, extra rows are filled as -1
| Pixel properties | Quadrant properties | ||||||
|---|---|---|---|---|---|---|---|
| Quadrant | DetID | PixID | Counts | Sigma | Mean | Median | Sigma |
| A | 15 | 174 | 6194684 | 13797.56 | 2209 | 2163 | 448.8 |
| A | 12 | 96 | 240428 | 530.88 | 2209 | 2163 | 448.8 |
| A | 9 | 143 | 66829 | 144.08 | 2209 | 2163 | 448.8 |
| B | 15 | 35 | 288183 | 648.6 | 2301 | 2246 | 440.9 |
| B | 0 | 229 | 107544 | 238.85 | 2301 | 2246 | 440.9 |
| B | 4 | 216 | 71324 | 156.69 | 2301 | 2246 | 440.9 |
| C | 14 | 238 | 338831 | 650.46 | 2207 | 2227 | 517.5 |
| C | 3 | 233 | 75553 | 141.7 | 2207 | 2227 | 517.5 |
| C | 7 | 247 | 19074 | 32.56 | 2207 | 2227 | 517.5 |
| D | 1 | 52 | 15654979 | 38892.85 | 1651 | 1606 | 402.5 |
| D | 2 | 16 | 3163444 | 7856.0 | 1651 | 1606 | 402.5 |
| D | 5 | 222 | 473217 | 1171.78 | 1651 | 1606 | 402.5 |
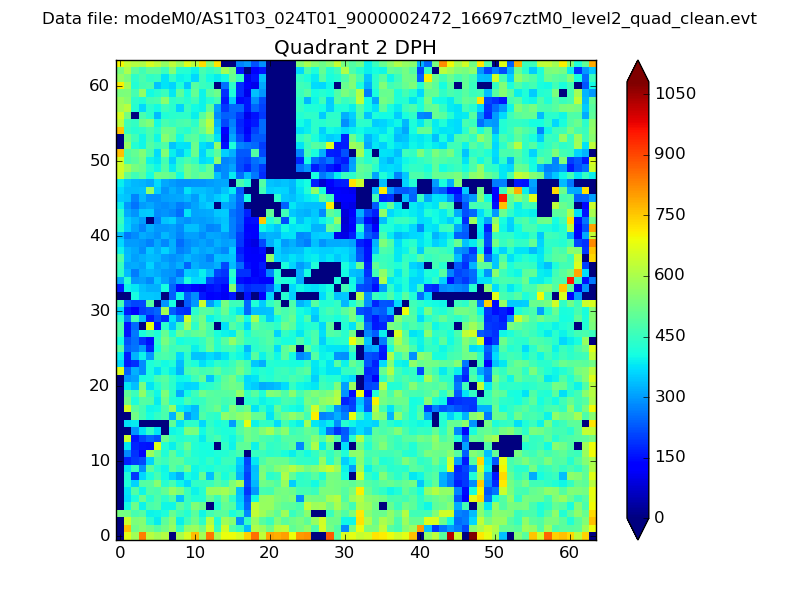
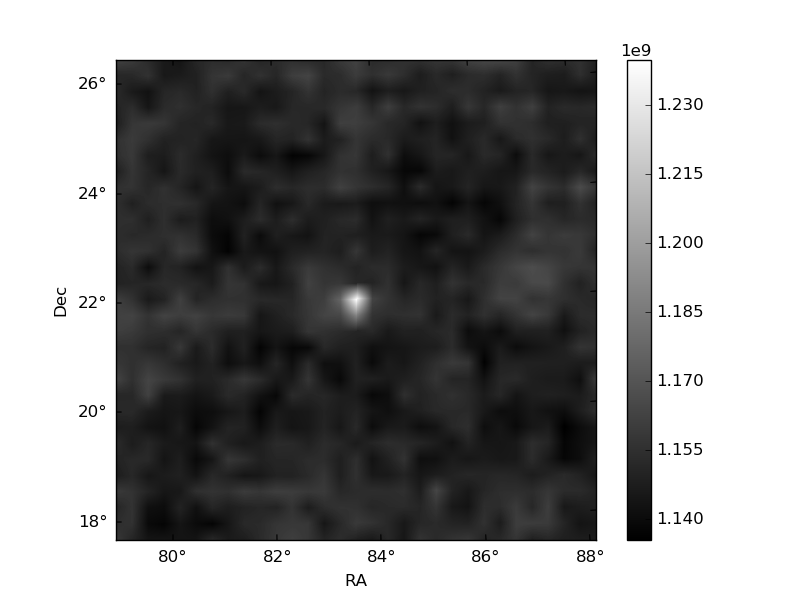
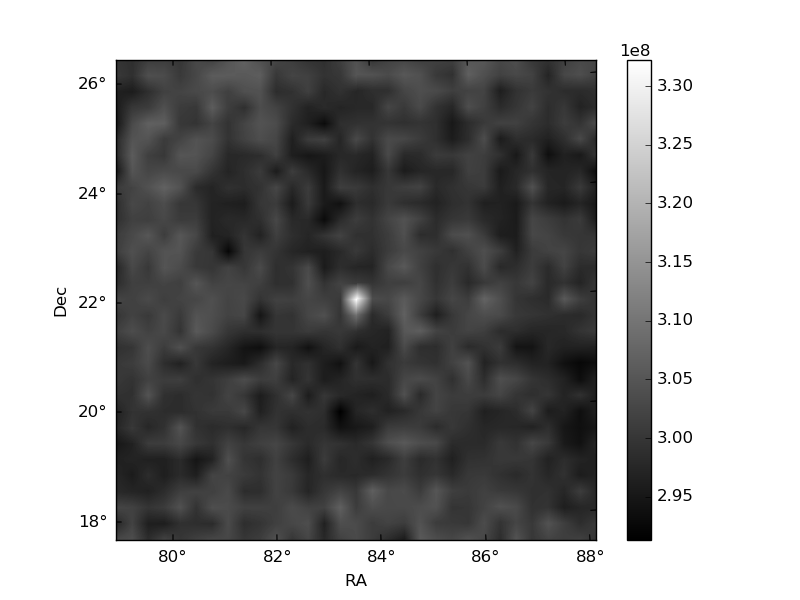
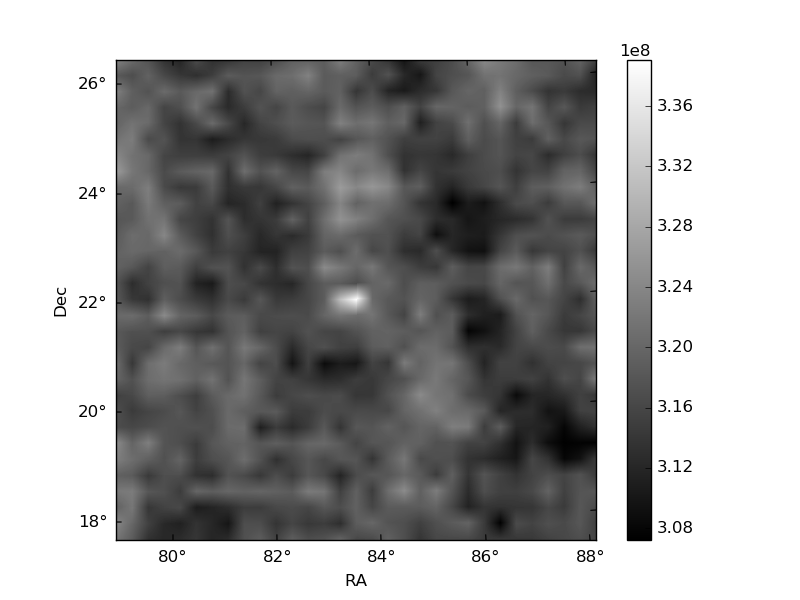
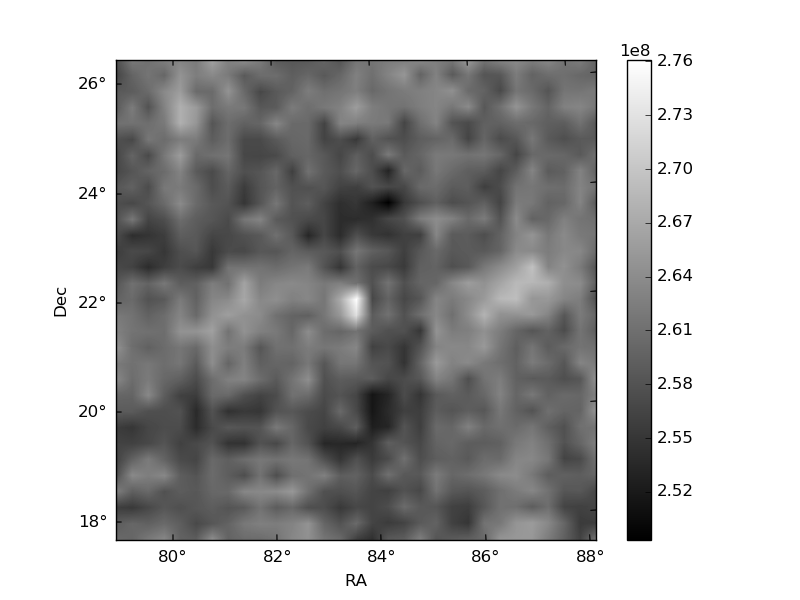
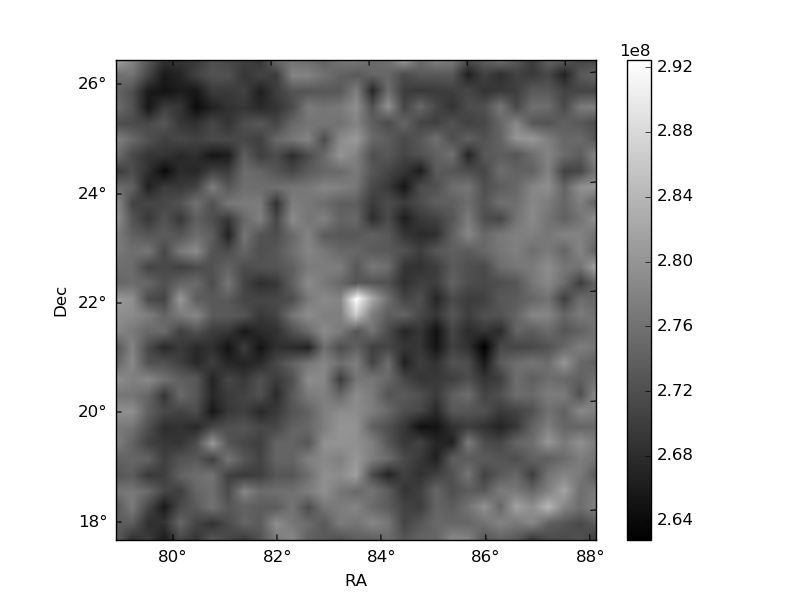
Histogram calculated using DETX and DETY for each event in the final _common_clean file
| Quadrant A | 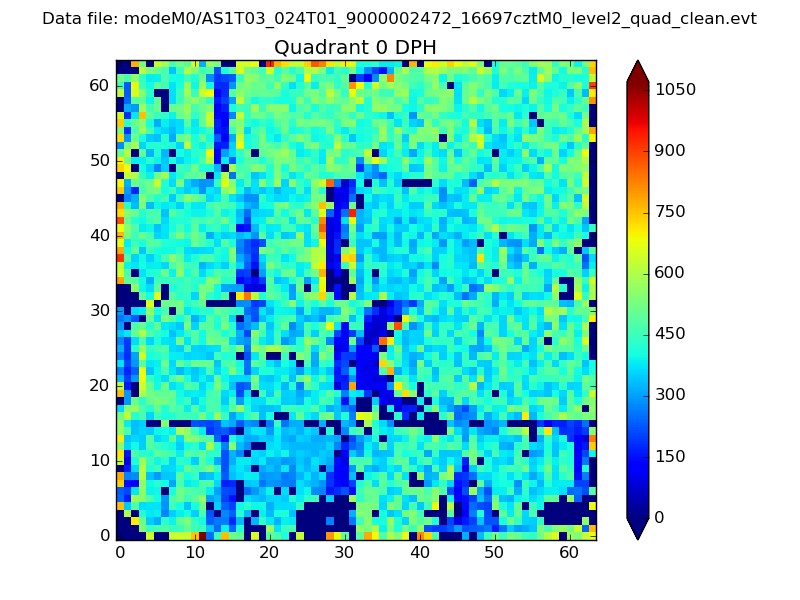 |
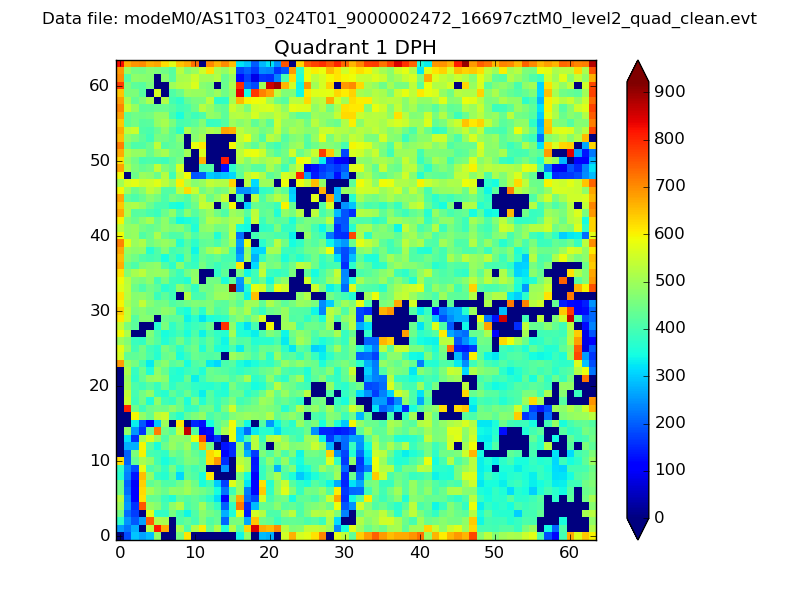 |
Quadrant B |
|---|---|---|---|
| Quadrant D | 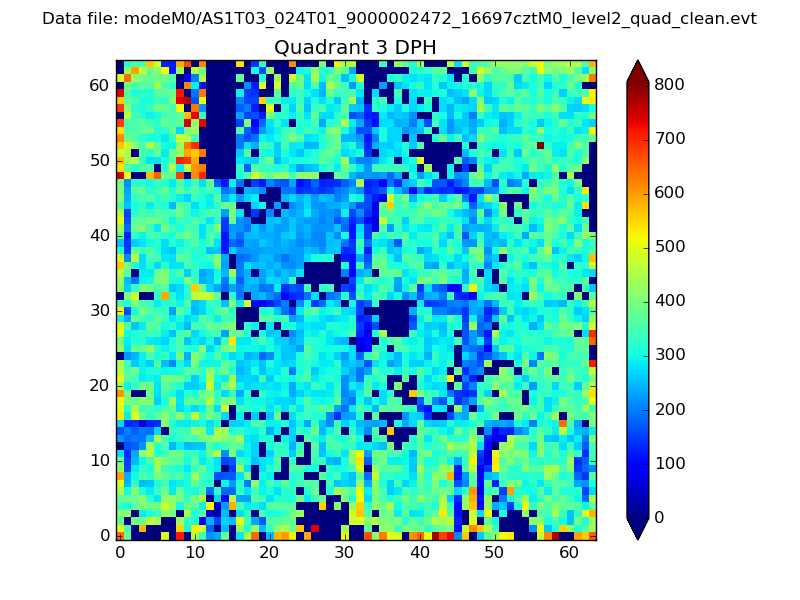 |
 |
Quadrant C |
| Plot type | Count rate plots | Images |
|---|---|---|
| Comparison with Poisson distribution Blue bars denote a histogram of data divided into 1 sec bins. Red curve is a Poisson curve with rate = median count rate of data. |
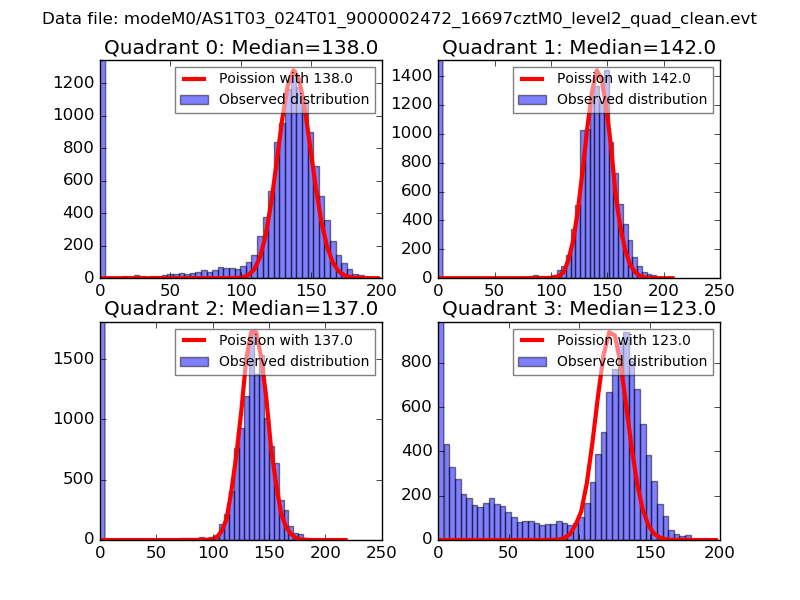 |
 |
| Quadrant-wise count rates Data is divided into 100 sec bins |
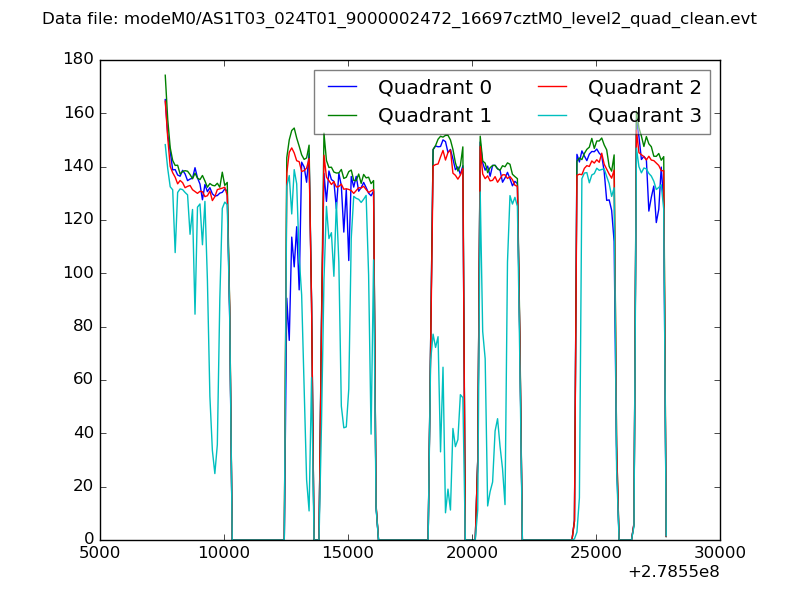 |
|
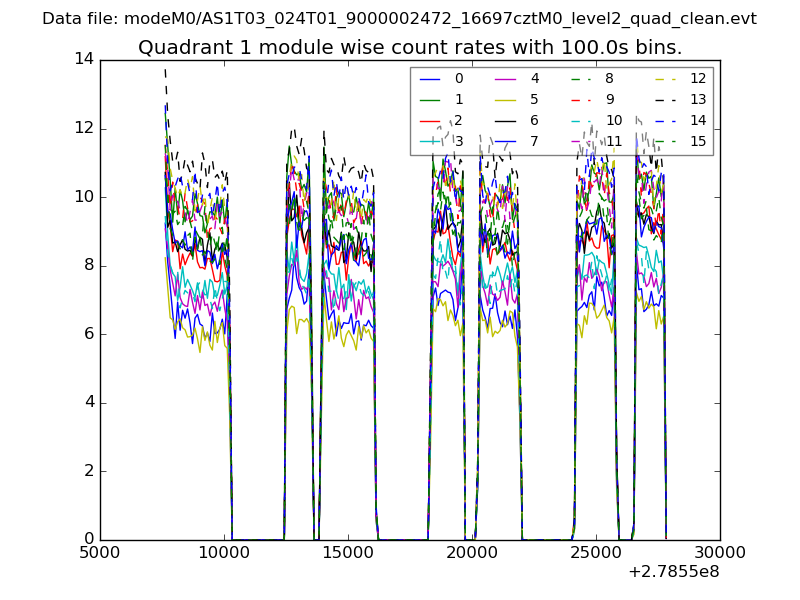
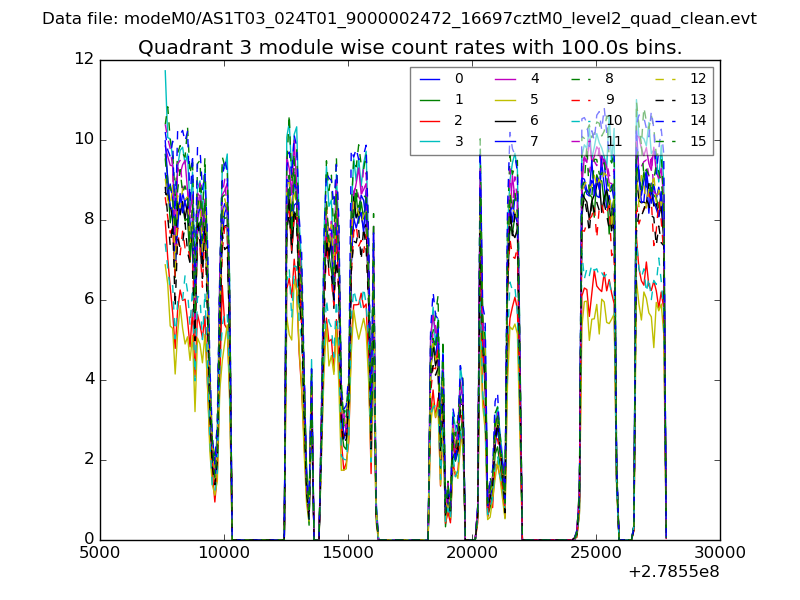
| Module-wise count rates for Quadrant A Data is divided into 100 sec bins |
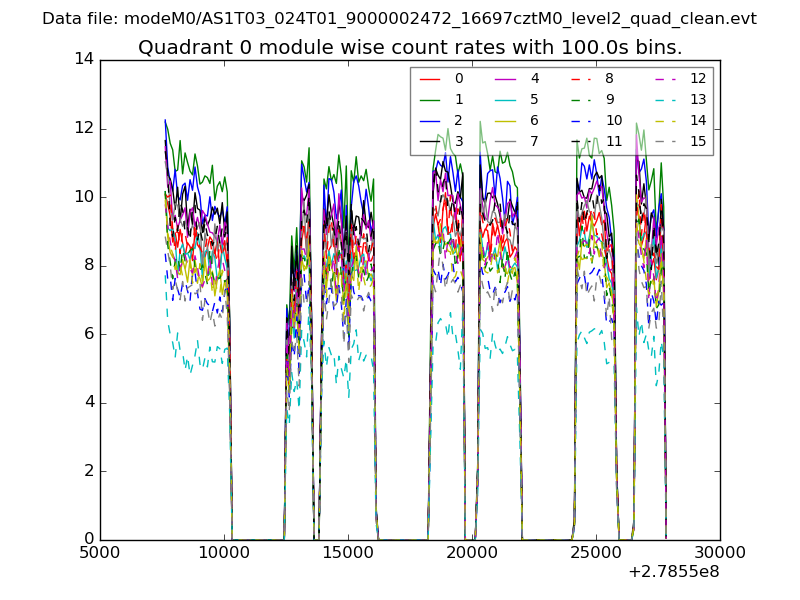 |
 |
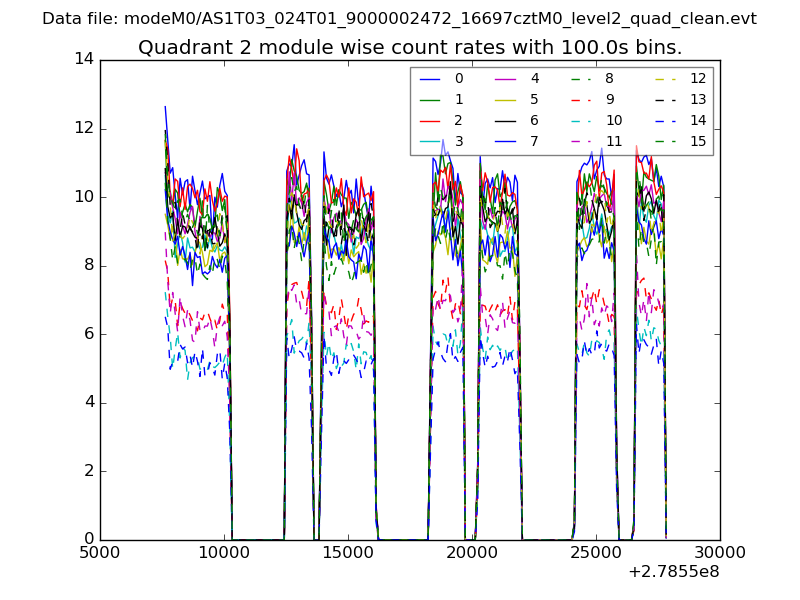
| Module-wise count rates for Quadrant B Data is divided into 100 sec bins |
 |
 |
| Module-wise count rates for Quadrant C Data is divided into 100 sec bins |
 |
 |
| Module-wise count rates for Quadrant D Data is divided into 100 sec bins |
 |
 |
| Parameter | Plot |
|---|---|
| CZT HV Monitor | 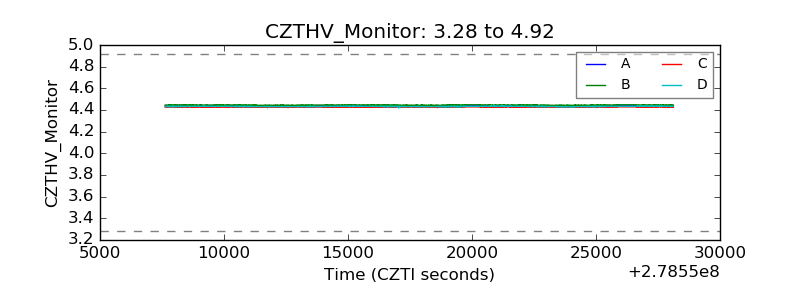 |
| D_VDD | 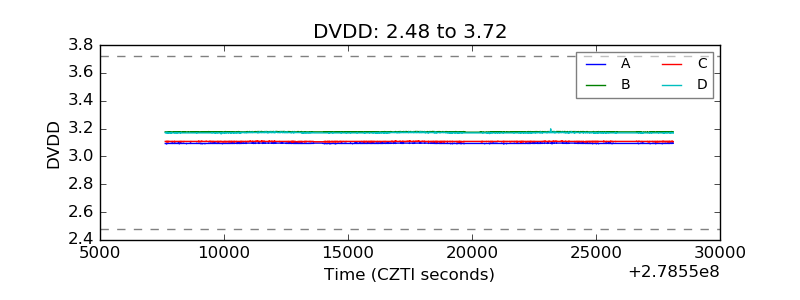 |
| Temperature 1 | 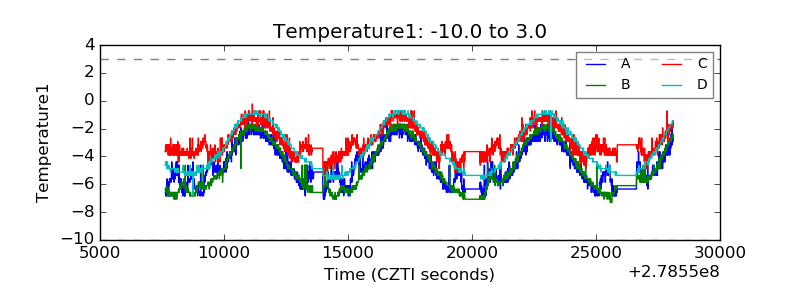 |
| Veto HV Monitor | 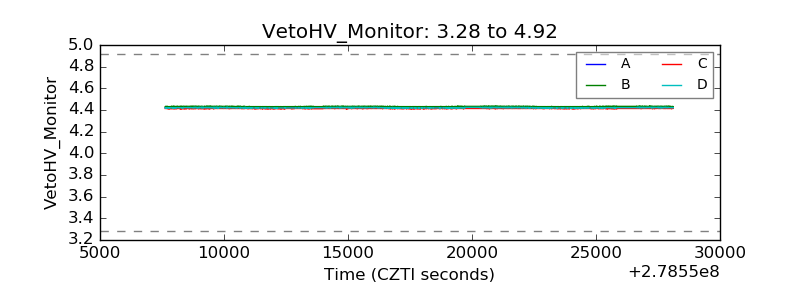 |
| Veto LLD | 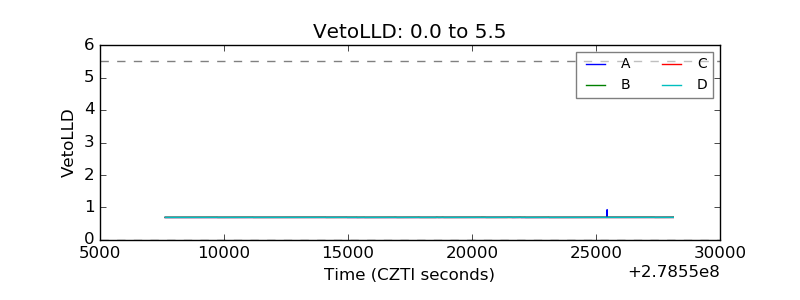 |
| Alpha Counter | 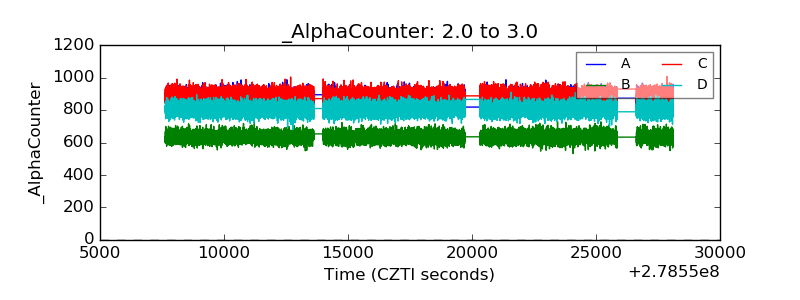 |
| _CPM_Rate | 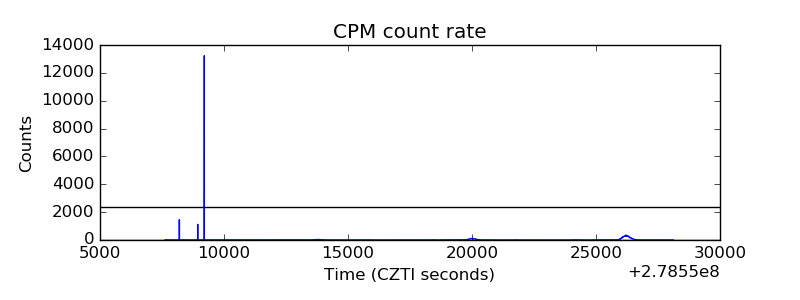 |
| CZT Counter | 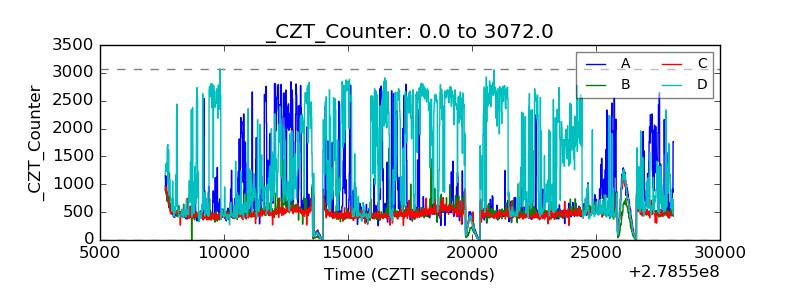 |
| +2.5 Volts monitor |  |
| +5 Volts monitor |  |
| _ROLL_ROT | 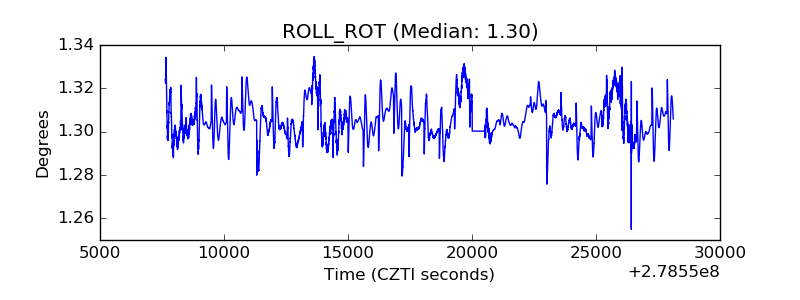 |
| _Roll_DEC | 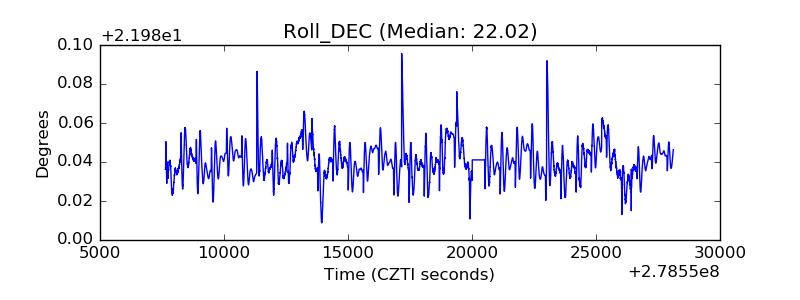 |
| _Roll_RA | 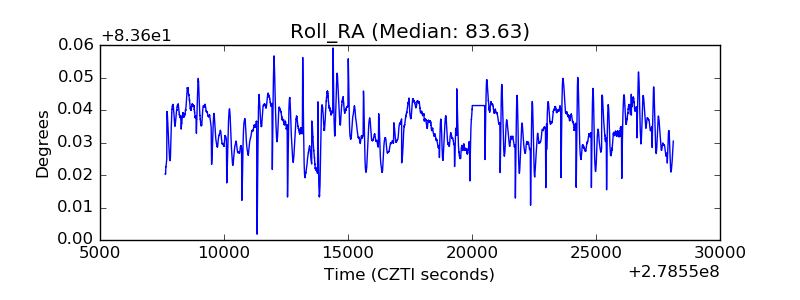 |
| Veto Counter | 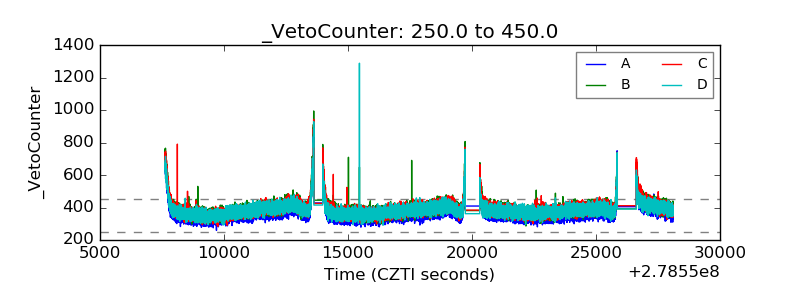 |