| Param | Original file | Final file |
|---|---|---|
| Filename | modeM0/AS1T03_024T01_9000002472_16698cztM0_level2.evt | modeM0/AS1T03_024T01_9000002472_16698cztM0_level2_quad_clean.evt |
| Size (bytes) | 3,091,956,480 | 357,396,480 |
| Size | 2.9 GB | 340.8 MB |
| Events in quadrant A | 22,681,629 | 2,317,001 |
| Events in quadrant B | 14,975,786 | 2,440,734 |
| Events in quadrant C | 14,137,149 | 2,347,890 |
| Events in quadrant D | 39,906,396 | 1,733,178 |
| Mode M9 | |||
|---|---|---|---|
| Quadrant | BADHDUFLAG | Total packets | Discarded packets |
| A | 0 | 29 | 0 |
| B | 0 | 29 | 0 |
| C | 0 | 29 | 0 |
| D | 0 | 29 | 0 |
| Mode M0 | |||
|---|---|---|---|
| Quadrant | BADHDUFLAG | Total packets | Discarded packets |
| A | 0 | 86275 | 6 |
| B | 0 | 62331 | 5 |
| C | 0 | 59952 | 5 |
| D | 0 | 138391 | 5 |
| Mode SS | |||
|---|---|---|---|
| Quadrant | BADHDUFLAG | Total packets | Discarded packets |
| A | 0 | 588 | 0 |
| B | 0 | 588 | 0 |
| C | 0 | 588 | 0 |
| D | 0 | 588 | 0 |
| Quadrant | Total seconds | Saturated seconds | Saturation percentage |
|---|---|---|---|
| A | 28843 | 3035 | 10.522484% |
| B | 28843 | 397 | 1.376417% |
| C | 28843 | 408 | 1.414555% |
| D | 28843 | 9772 | 33.879971% |
Noise dominated data is calculated using 1-second bins in cleaned event files. If a bin has >2000 counts, and if more than 50% of those come from <1% of pixels, then it is considered to be noise-dominated and hence unusable.
| Quadrant | # 1 sec bins | Bins with >0 counts | Bins with >2000 counts | High rate bins dominated by noise | Noise dominated (total time) | Noise dominated (detector-on time) | Marked lightcurve |
|---|---|---|---|---|---|---|---|
| A | 31664 | 28850 | 1974 | 1974 | 6.23% | 6.84% | 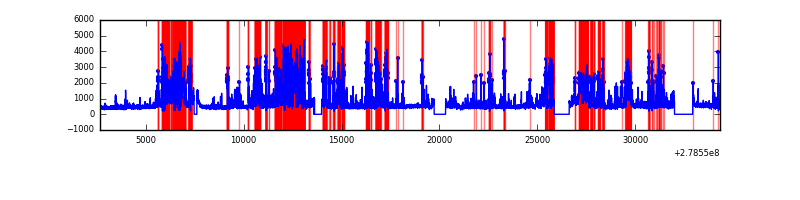 |
| B | 31664 | 28850 | 14 | 14 | 0.04% | 0.05% |  |
| C | 31664 | 28850 | 0 | 0 | 0.00% | 0.00% |  |
| D | 31664 | 28849 | 7543 | 7543 | 23.82% | 26.15% | 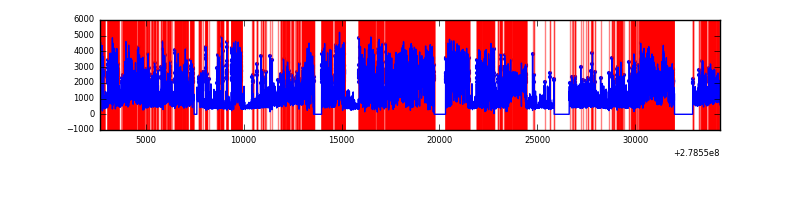 |
Top three noisy pixels from each quadrant. If the there are fewer than three noisy pixels in the level2.evt file, extra rows are filled as -1
| Pixel properties | Quadrant properties | ||||||
|---|---|---|---|---|---|---|---|
| Quadrant | DetID | PixID | Counts | Sigma | Mean | Median | Sigma |
| A | 15 | 174 | 8642053 | 12451.84 | 3427 | 3359 | 693.8 |
| A | 12 | 96 | 690767 | 990.83 | 3427 | 3359 | 693.8 |
| A | 9 | 143 | 79710 | 110.05 | 3427 | 3359 | 693.8 |
| B | 15 | 35 | 506044 | 736.56 | 3564 | 3477 | 682.3 |
| B | 0 | 229 | 214816 | 309.74 | 3564 | 3477 | 682.3 |
| B | 0 | 189 | 102253 | 144.77 | 3564 | 3477 | 682.3 |
| C | 14 | 238 | 525758 | 652.75 | 3418 | 3452 | 800.2 |
| C | 3 | 233 | 230554 | 283.82 | 3418 | 3452 | 800.2 |
| C | 0 | 207 | 30707 | 34.06 | 3418 | 3452 | 800.2 |
| D | 1 | 52 | 23292589 | 34479.48 | 2767 | 2690 | 675.5 |
| D | 2 | 16 | 4913047 | 7269.53 | 2767 | 2690 | 675.5 |
| D | 5 | 222 | 572111 | 843.0 | 2767 | 2690 | 675.5 |
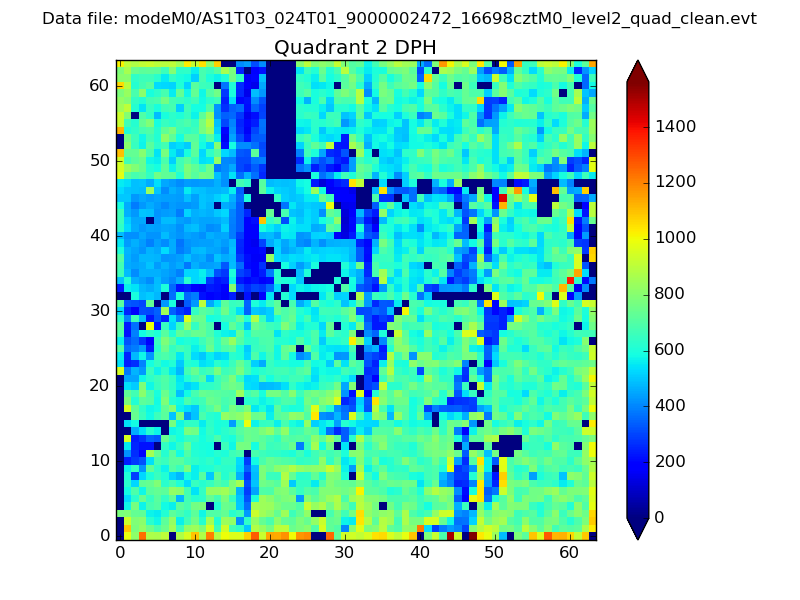
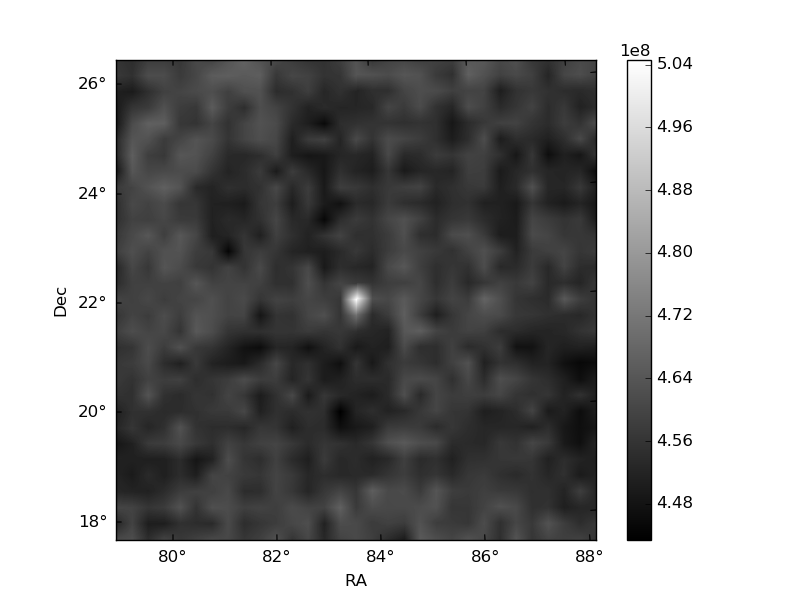
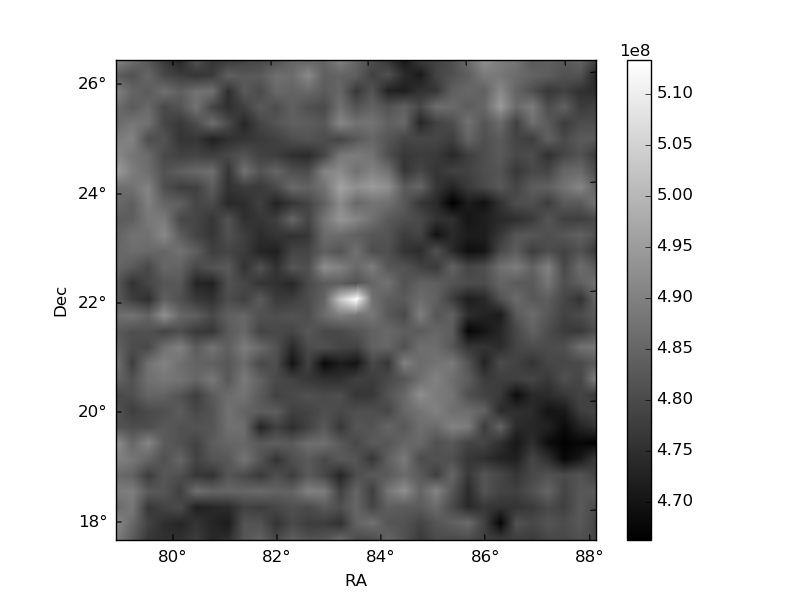
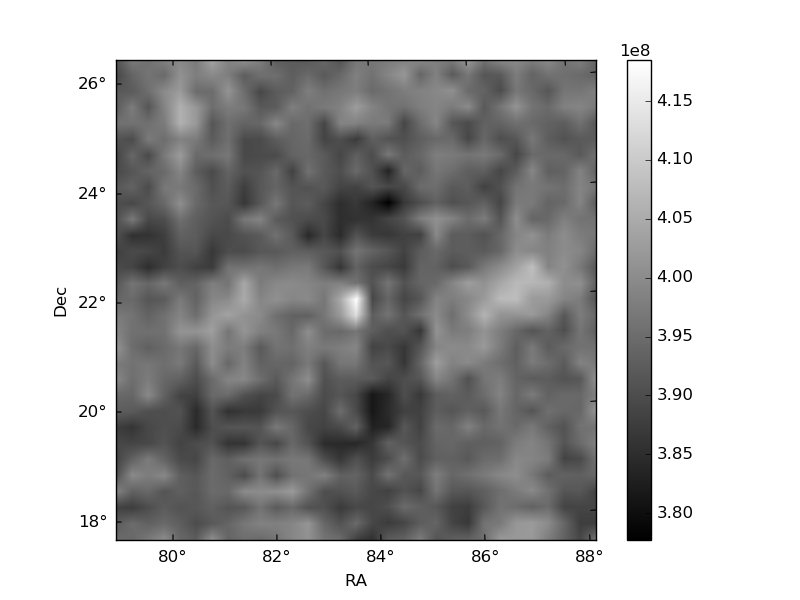
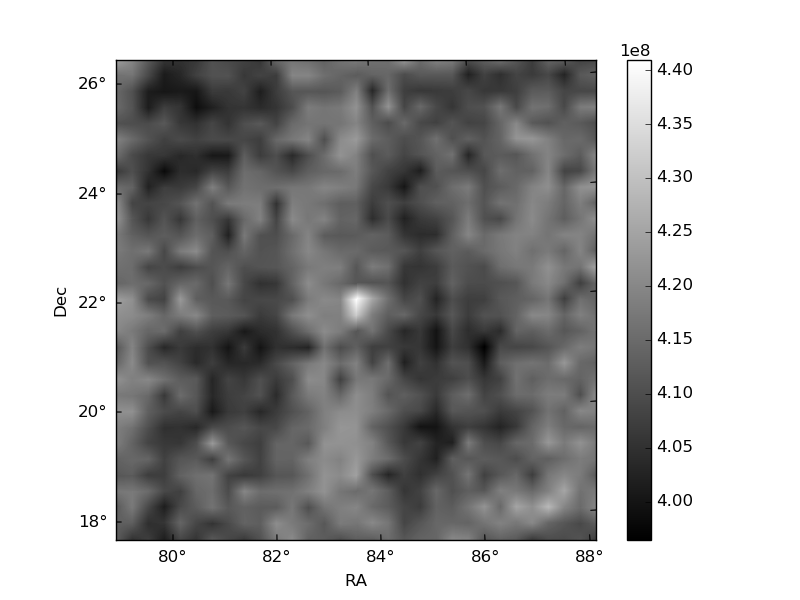
Histogram calculated using DETX and DETY for each event in the final _common_clean file
| Quadrant A | 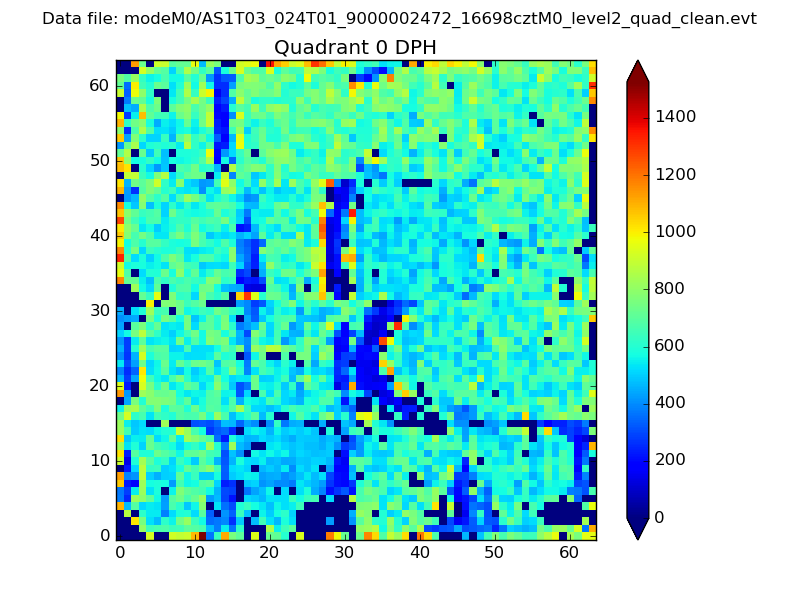 |
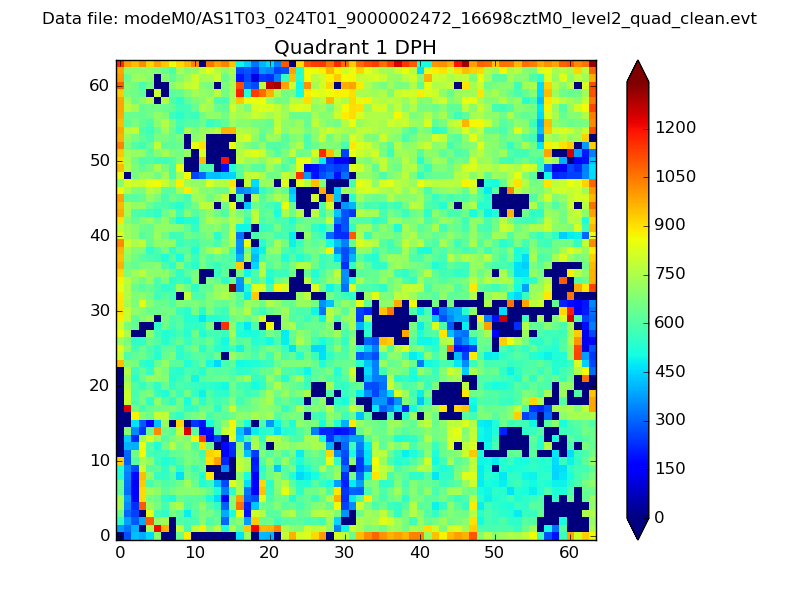 |
Quadrant B |
|---|---|---|---|
| Quadrant D | 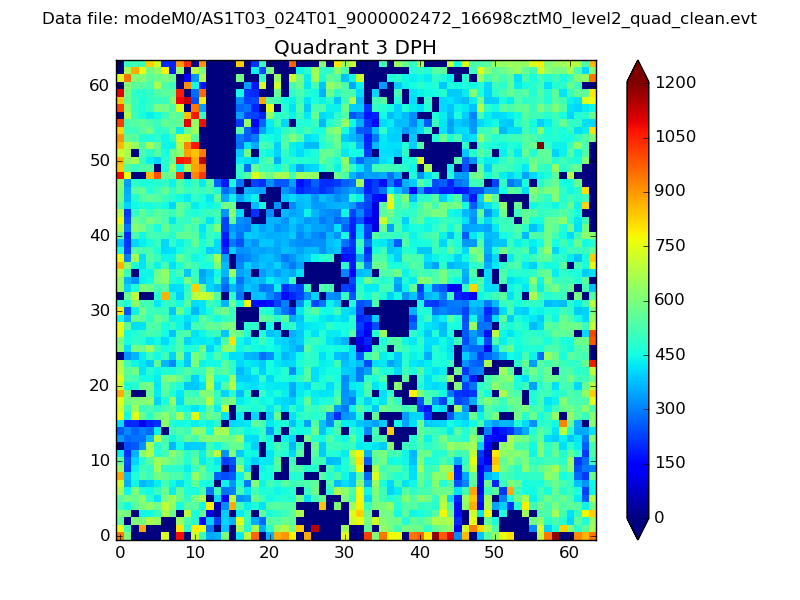 |
 |
Quadrant C |
| Plot type | Count rate plots | Images |
|---|---|---|
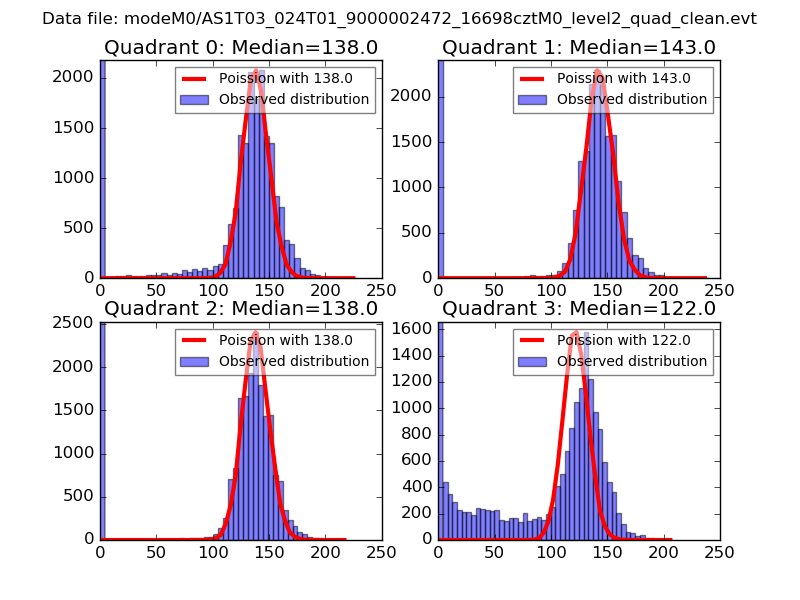
| Comparison with Poisson distribution Blue bars denote a histogram of data divided into 1 sec bins. Red curve is a Poisson curve with rate = median count rate of data. |
 |
 |
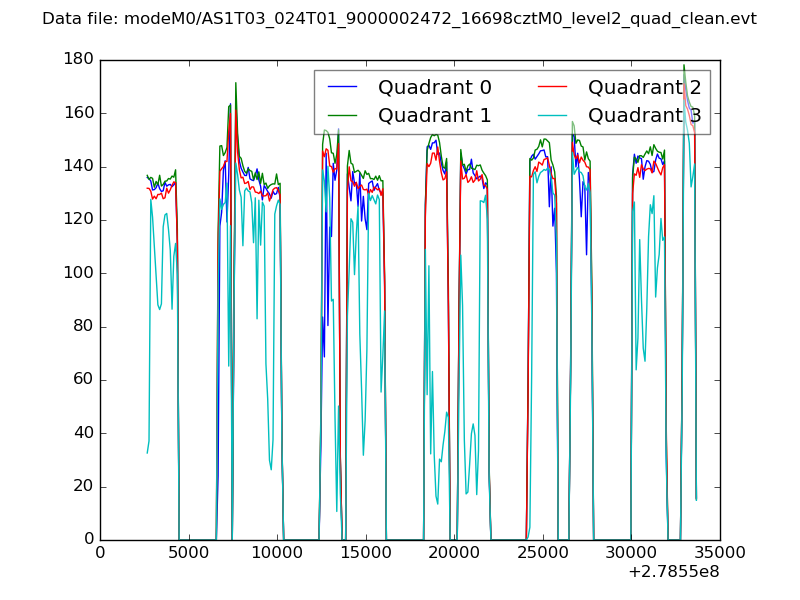
| Quadrant-wise count rates Data is divided into 100 sec bins |
 |
|
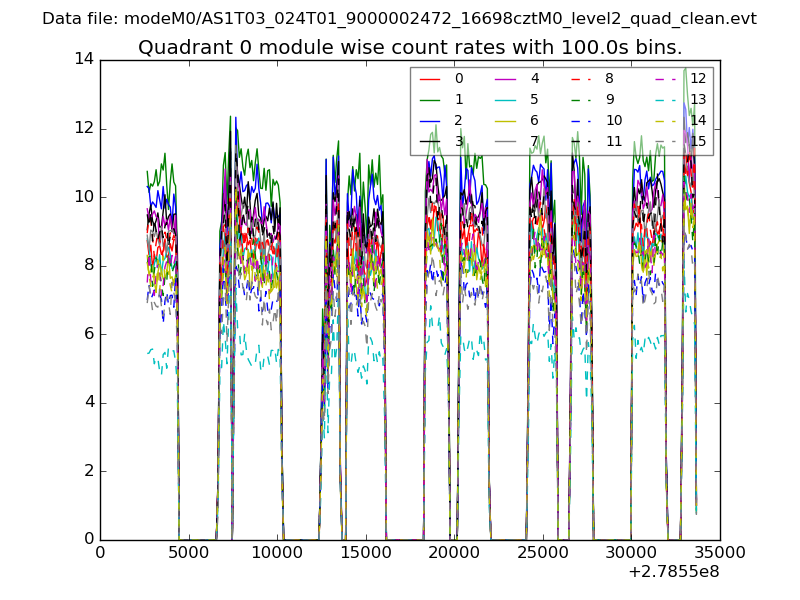
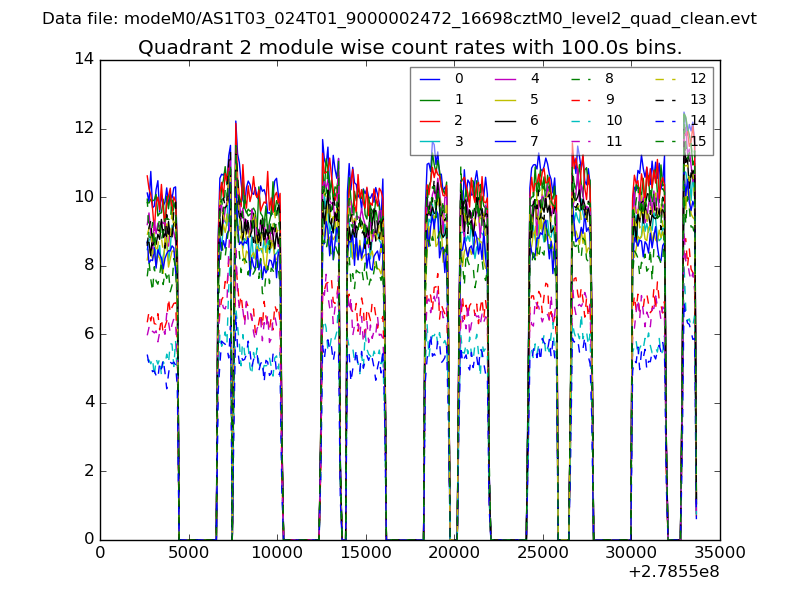
| Module-wise count rates for Quadrant A Data is divided into 100 sec bins |
 |
 |
| Module-wise count rates for Quadrant B Data is divided into 100 sec bins |
 |
 |
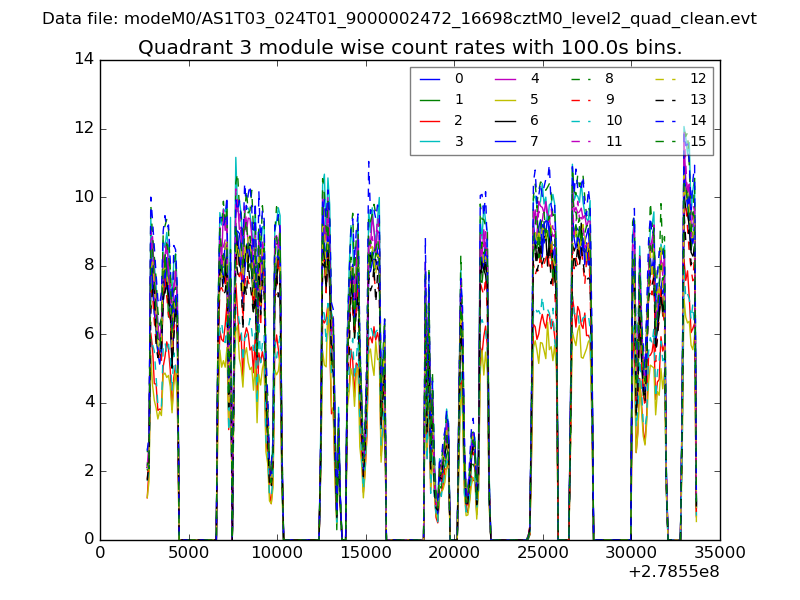
| Module-wise count rates for Quadrant C Data is divided into 100 sec bins |
 |
 |
| Module-wise count rates for Quadrant D Data is divided into 100 sec bins |
 |
 |
| Parameter | Plot |
|---|---|
| CZT HV Monitor | 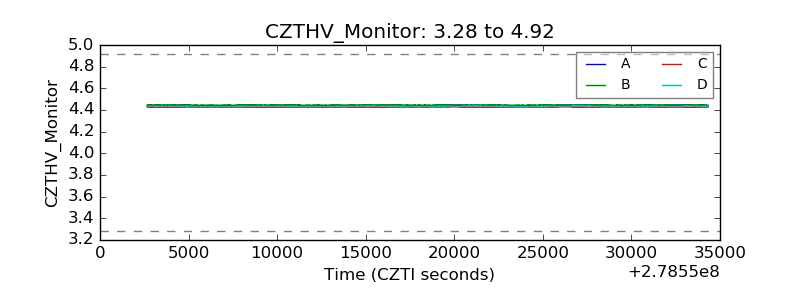 |
| D_VDD | 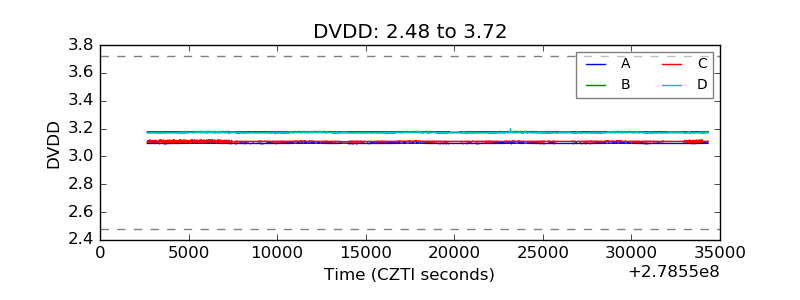 |
| Temperature 1 |  |
| Veto HV Monitor | 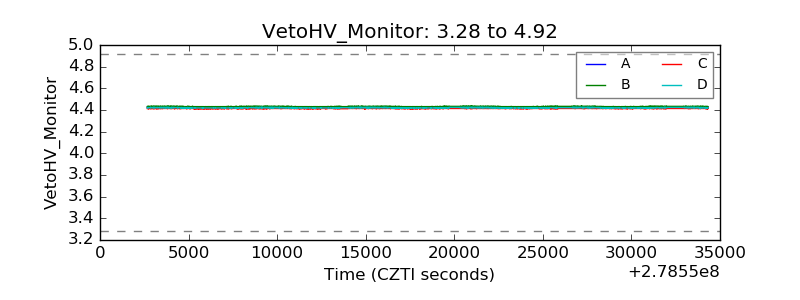 |
| Veto LLD |  |
| Alpha Counter | 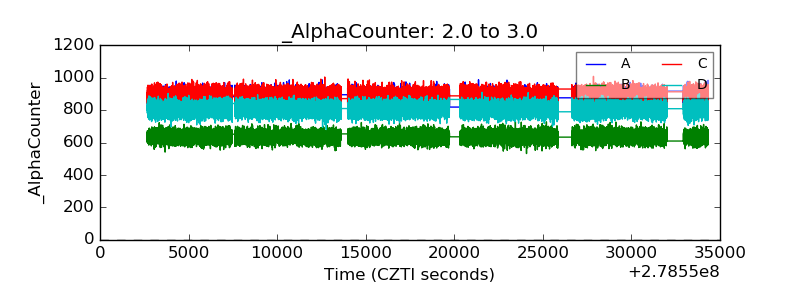 |
| _CPM_Rate | 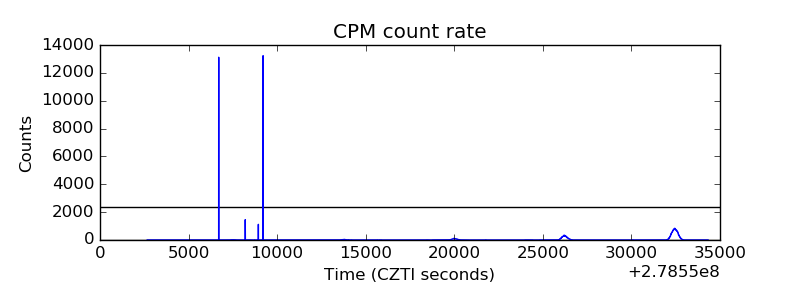 |
| CZT Counter | 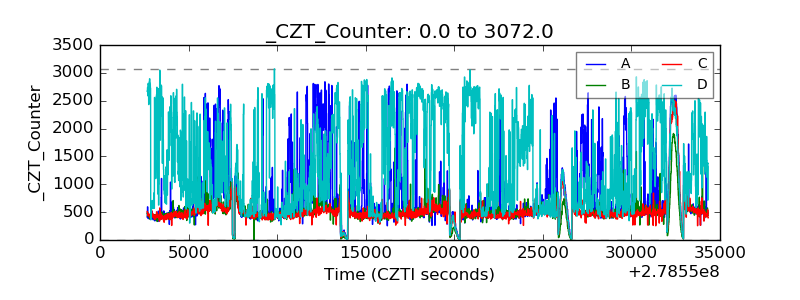 |
| +2.5 Volts monitor |  |
| +5 Volts monitor | 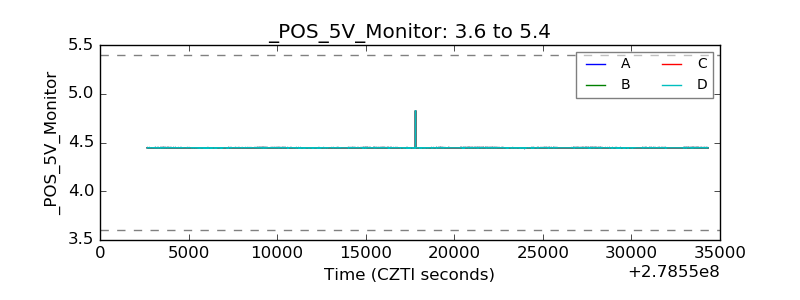 |
| _ROLL_ROT |  |
| _Roll_DEC |  |
| _Roll_RA | 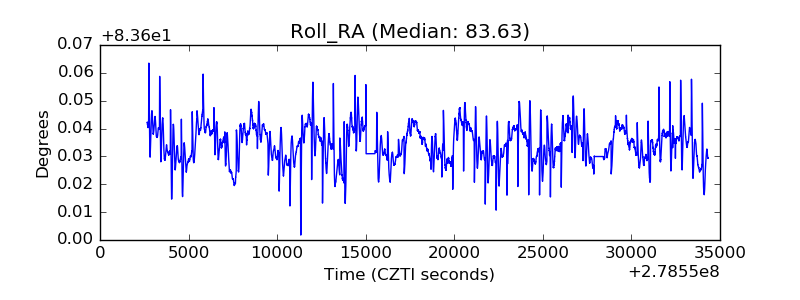 |
| Veto Counter |  |