| Param | Original file | Final file |
|---|---|---|
| Filename | modeM0/AS1T03_024T01_9000002472_16702cztM0_level2.evt | modeM0/AS1T03_024T01_9000002472_16702cztM0_level2_quad_clean.evt |
| Size (bytes) | 570,504,960 | 71,706,240 |
| Size | 544.1 MB | 68.4 MB |
| Events in quadrant A | 4,357,559 | 440,866 |
| Events in quadrant B | 3,752,627 | 448,100 |
| Events in quadrant C | 3,737,401 | 432,766 |
| Events in quadrant D | 5,005,201 | 411,379 |
| Mode M9 | |||
|---|---|---|---|
| Quadrant | BADHDUFLAG | Total packets | Discarded packets |
| A | 0 | 23 | 0 |
| B | 0 | 23 | 0 |
| C | 0 | 23 | 0 |
| D | 0 | 24 | 0 |
| Mode M0 | |||
|---|---|---|---|
| Quadrant | BADHDUFLAG | Total packets | Discarded packets |
| A | 0 | 17092 | 3 |
| B | 0 | 15249 | 2 |
| C | 0 | 15273 | 2 |
| D | 0 | 19345 | 2 |
| Mode SS | |||
|---|---|---|---|
| Quadrant | BADHDUFLAG | Total packets | Discarded packets |
| A | 0 | 128 | 0 |
| B | 0 | 128 | 0 |
| C | 0 | 128 | 0 |
| D | 0 | 128 | 0 |
| Quadrant | Total seconds | Saturated seconds | Saturation percentage |
|---|---|---|---|
| A | 6274 | 342 | 5.451068% |
| B | 6274 | 95 | 1.514186% |
| C | 6274 | 101 | 1.609818% |
| D | 6274 | 536 | 8.543194% |
Noise dominated data is calculated using 1-second bins in cleaned event files. If a bin has >2000 counts, and if more than 50% of those come from <1% of pixels, then it is considered to be noise-dominated and hence unusable.
| Quadrant | # 1 sec bins | Bins with >0 counts | Bins with >2000 counts | High rate bins dominated by noise | Noise dominated (total time) | Noise dominated (detector-on time) | Marked lightcurve |
|---|---|---|---|---|---|---|---|
| A | 7580 | 6276 | 149 | 149 | 1.97% | 2.37% | 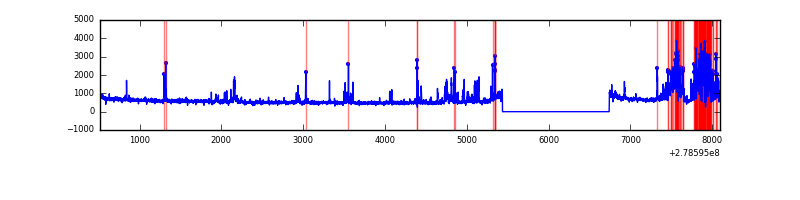 |
| B | 7580 | 6276 | 15 | 15 | 0.20% | 0.24% | 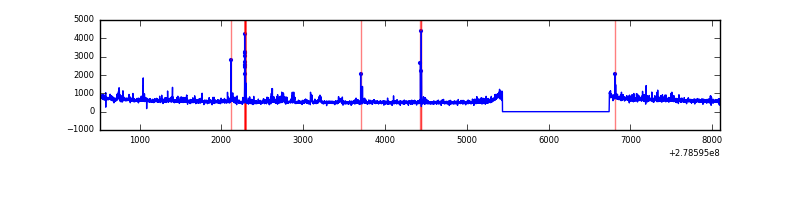 |
| C | 7580 | 6276 | 0 | 0 | 0.00% | 0.00% |  |
| D | 7580 | 6276 | 168 | 168 | 2.22% | 2.68% | 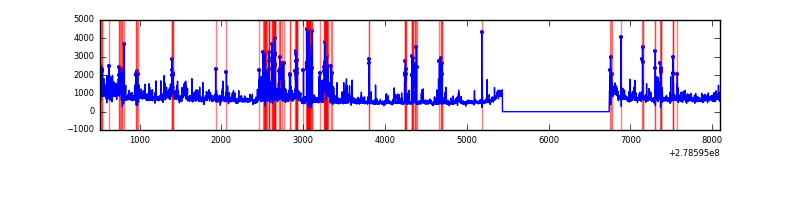 |
Top three noisy pixels from each quadrant. If the there are fewer than three noisy pixels in the level2.evt file, extra rows are filled as -1
| Pixel properties | Quadrant properties | ||||||
|---|---|---|---|---|---|---|---|
| Quadrant | DetID | PixID | Counts | Sigma | Mean | Median | Sigma |
| A | 15 | 174 | 715151 | 4038.35 | 884 | 871 | 176.9 |
| A | 12 | 96 | 145637 | 818.47 | 884 | 871 | 176.9 |
| A | 9 | 143 | 48735 | 270.61 | 884 | 871 | 176.9 |
| B | 15 | 35 | 81158 | 488.05 | 893 | 874 | 164.5 |
| B | 5 | 236 | 54735 | 327.42 | 893 | 874 | 164.5 |
| B | 0 | 189 | 35905 | 212.96 | 893 | 874 | 164.5 |
| C | 3 | 233 | 192939 | 970.4 | 868 | 879 | 197.9 |
| C | 14 | 238 | 136312 | 684.29 | 868 | 879 | 197.9 |
| C | 0 | 207 | 16541 | 79.13 | 868 | 879 | 197.9 |
| D | 1 | 52 | 1202857 | 5978.88 | 826 | 805 | 201.0 |
| D | 5 | 222 | 267720 | 1327.61 | 826 | 805 | 201.0 |
| D | 2 | 16 | 215371 | 1067.23 | 826 | 805 | 201.0 |
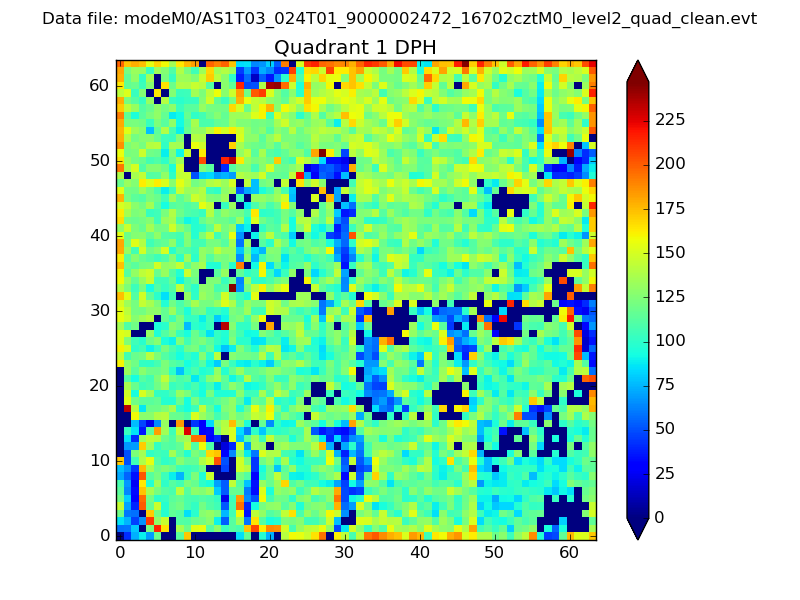
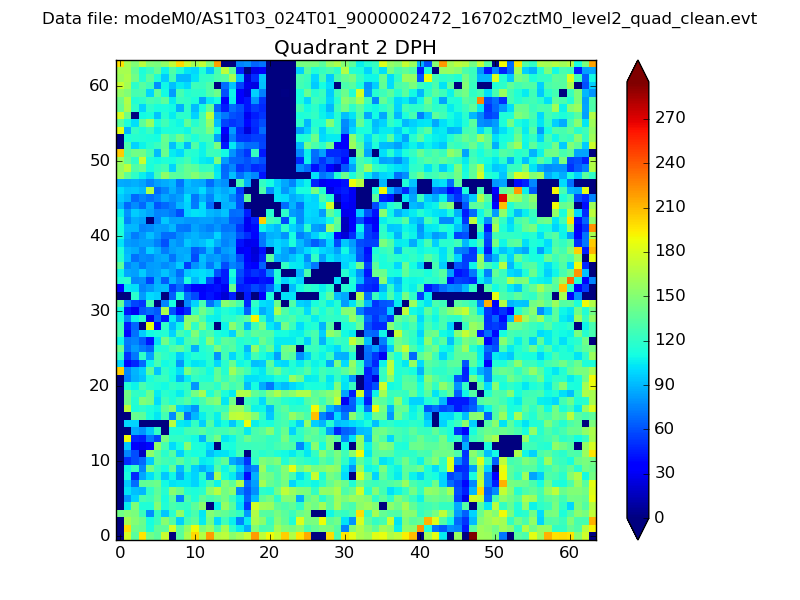
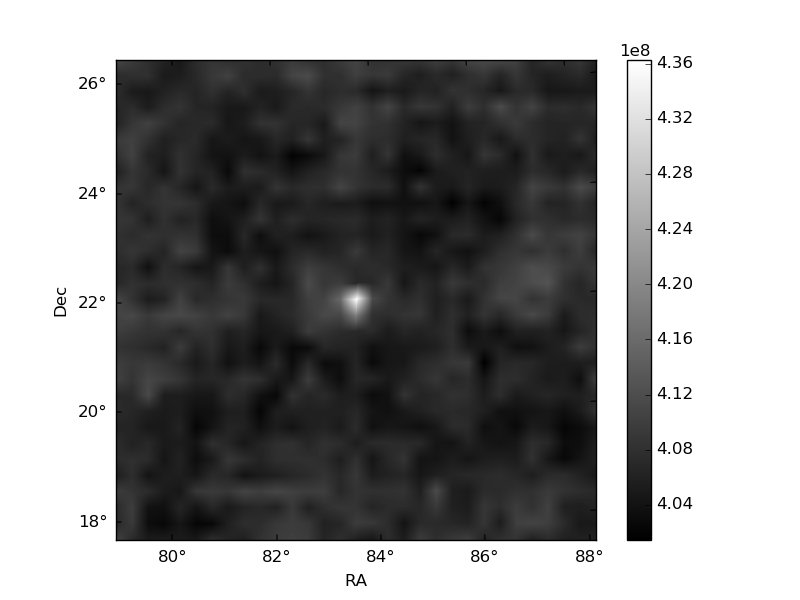
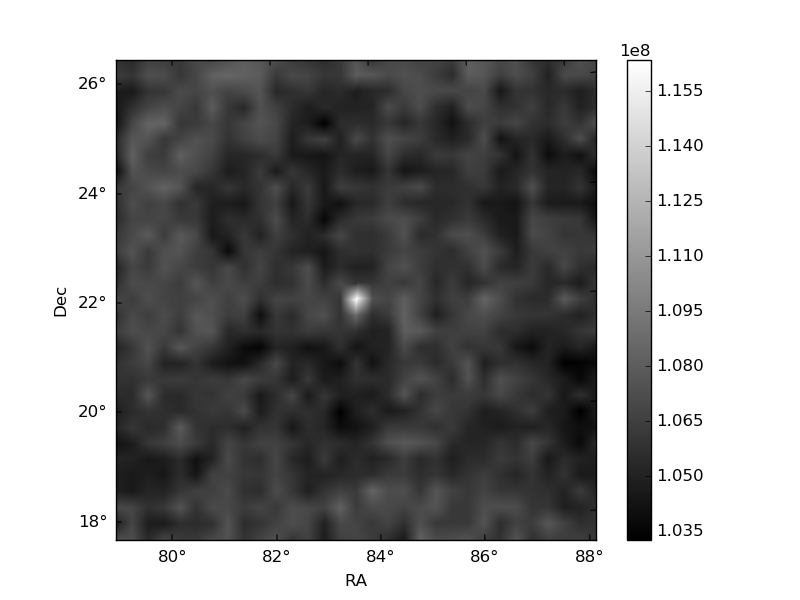
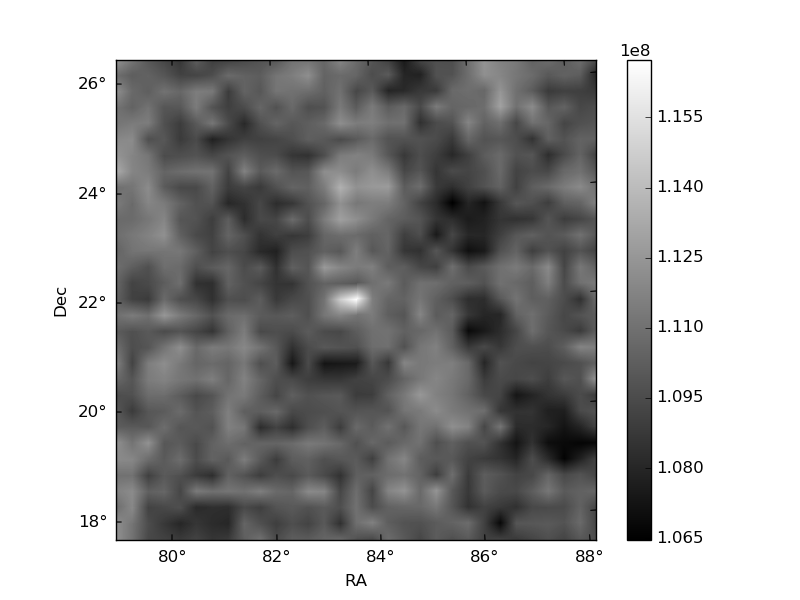
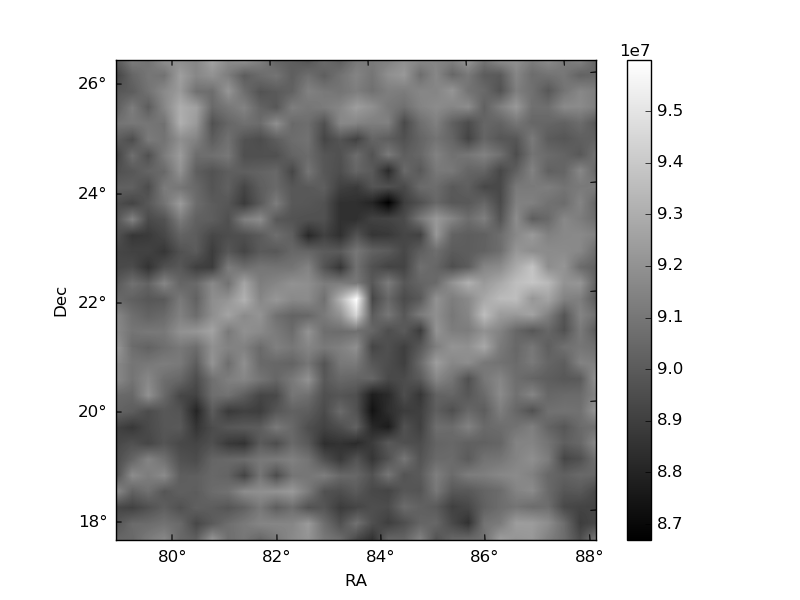
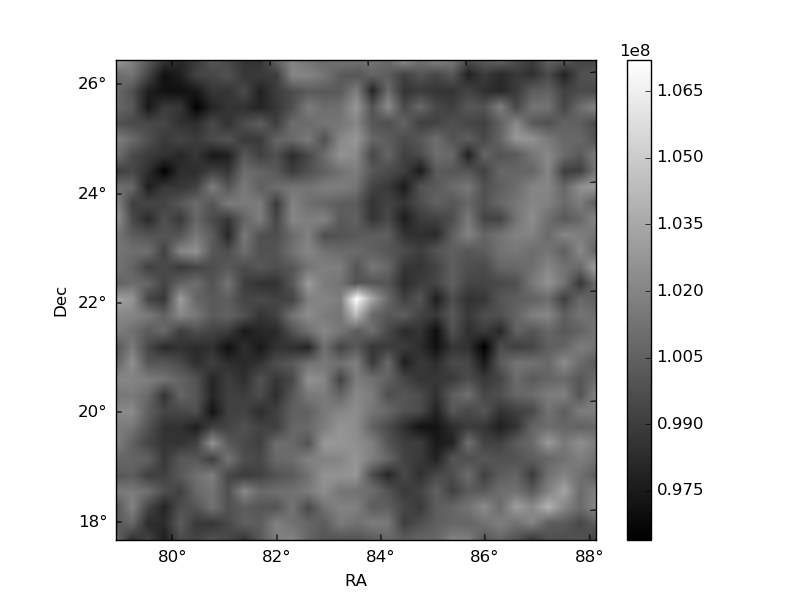
Histogram calculated using DETX and DETY for each event in the final _common_clean file
| Quadrant A | 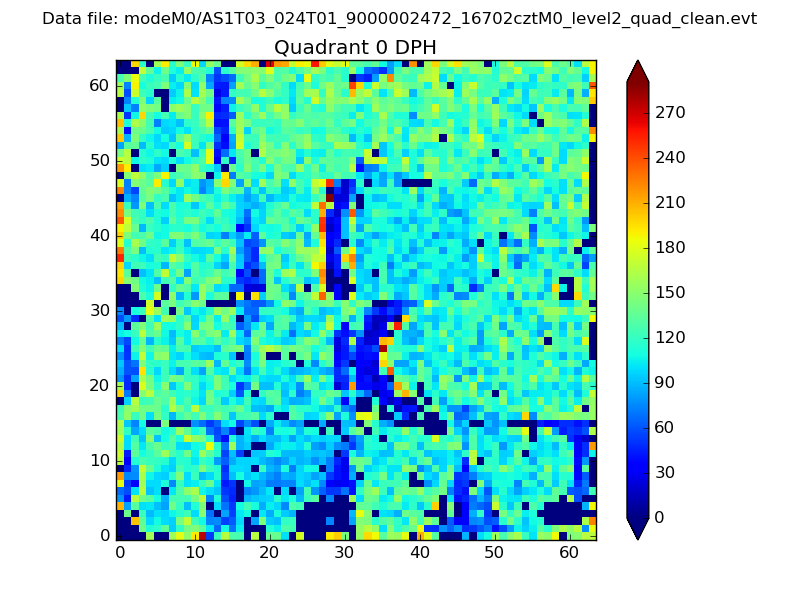 |
 |
Quadrant B |
|---|---|---|---|
| Quadrant D | 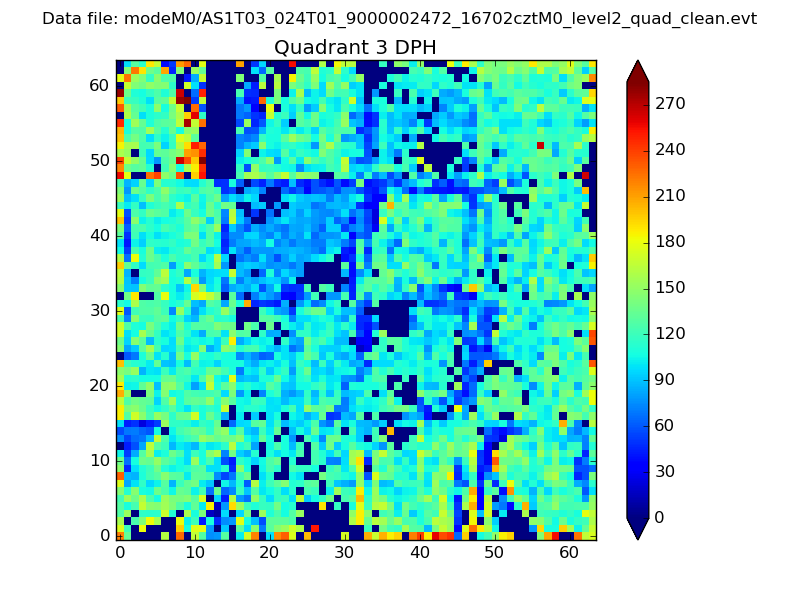 |
 |
Quadrant C |
| Plot type | Count rate plots | Images |
|---|---|---|
| Comparison with Poisson distribution Blue bars denote a histogram of data divided into 1 sec bins. Red curve is a Poisson curve with rate = median count rate of data. |
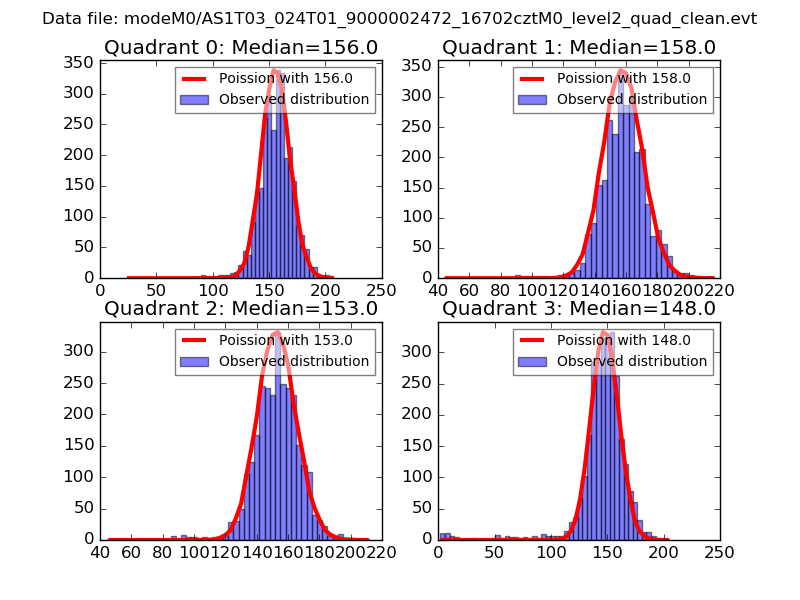 |
 |
| Quadrant-wise count rates Data is divided into 100 sec bins |
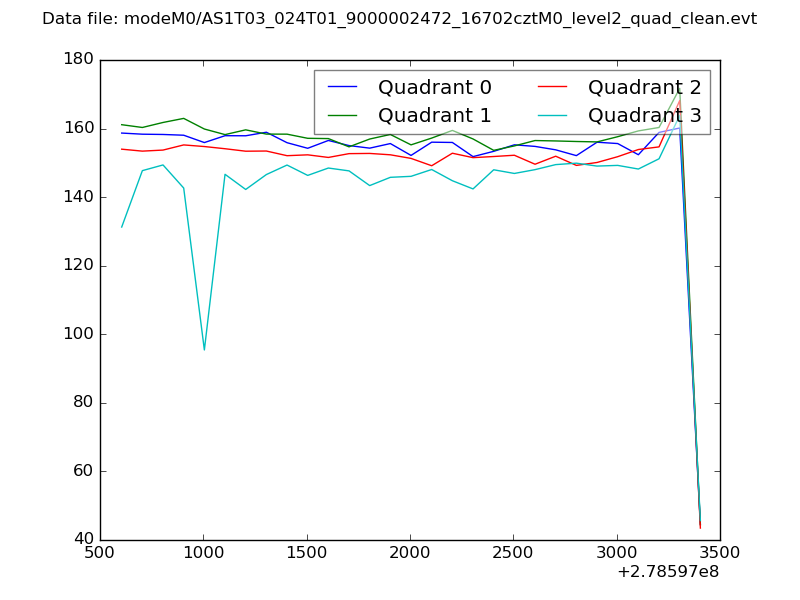 |
|
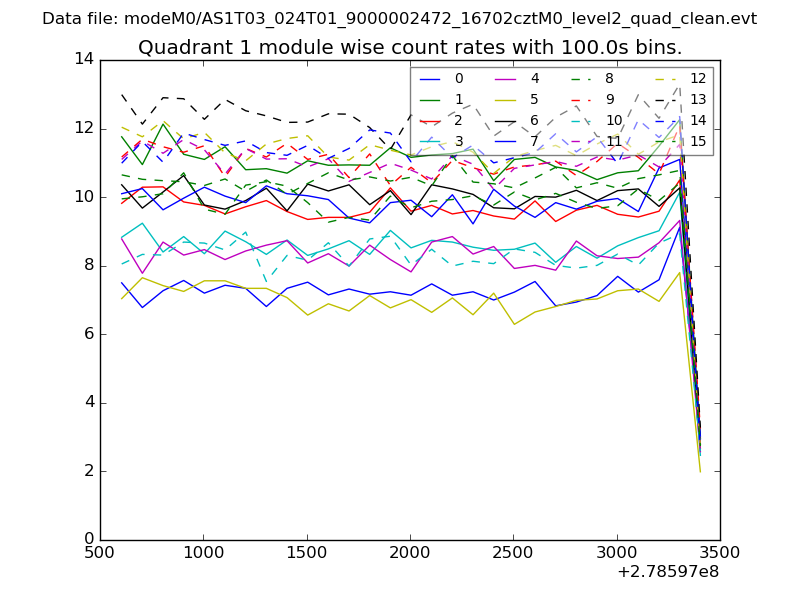
| Module-wise count rates for Quadrant A Data is divided into 100 sec bins |
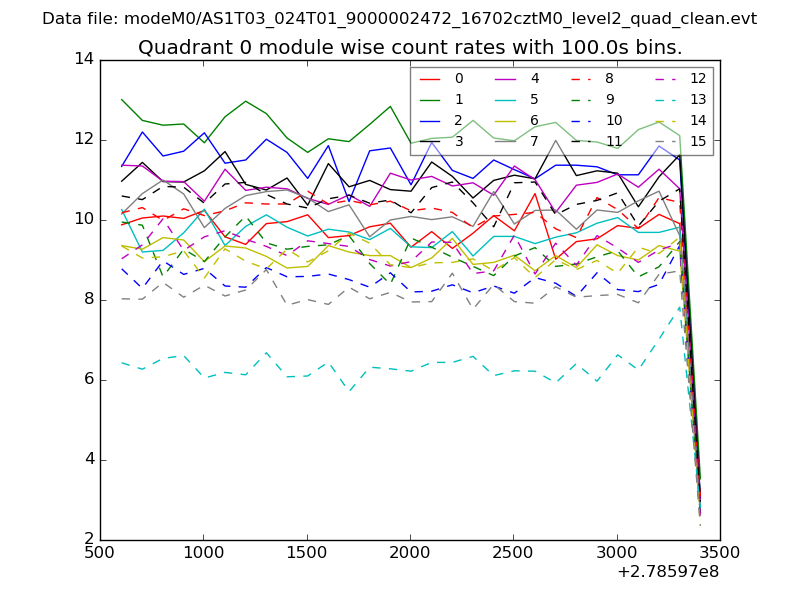 |
 |
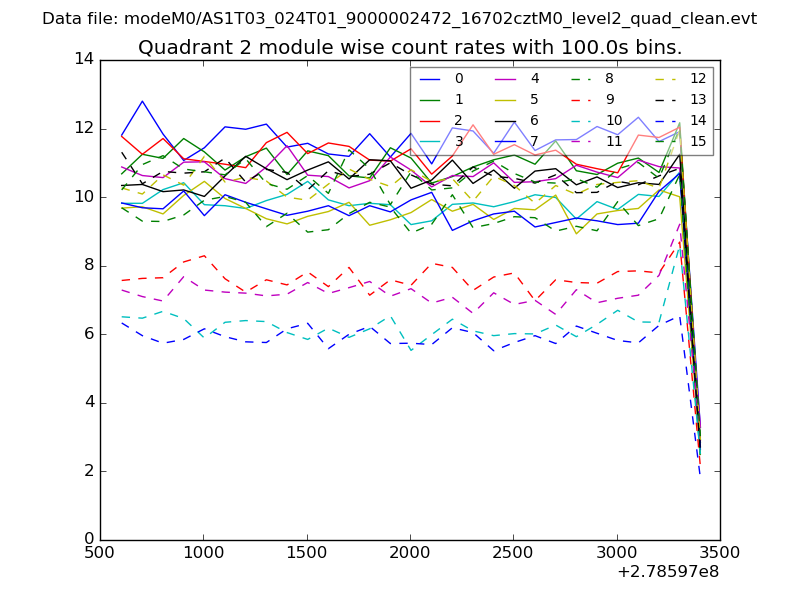
| Module-wise count rates for Quadrant B Data is divided into 100 sec bins |
 |
 |
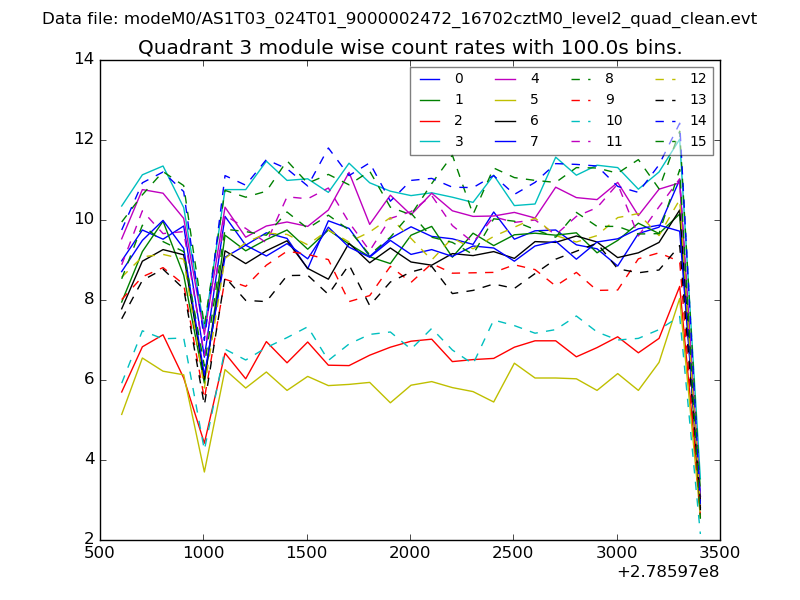
| Module-wise count rates for Quadrant C Data is divided into 100 sec bins |
 |
 |
| Module-wise count rates for Quadrant D Data is divided into 100 sec bins |
 |
 |
| Parameter | Plot |
|---|---|
| CZT HV Monitor | 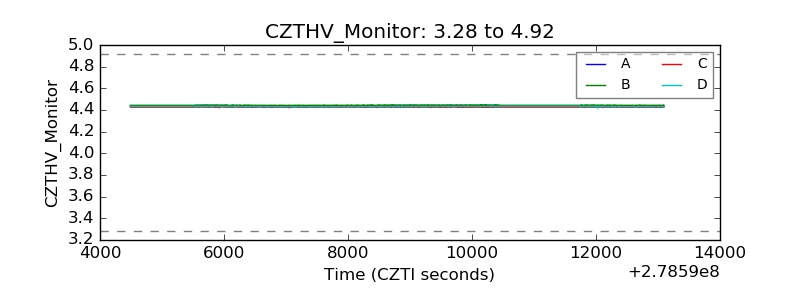 |
| D_VDD | 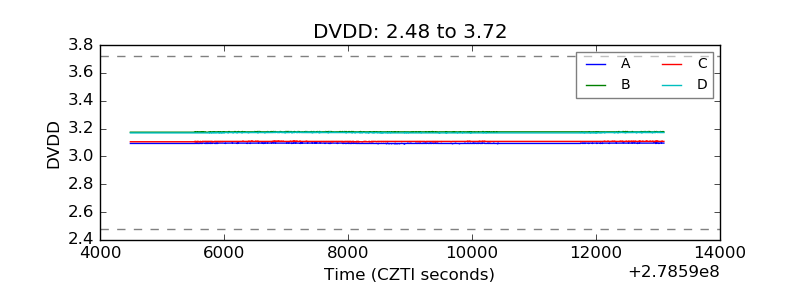 |
| Temperature 1 | 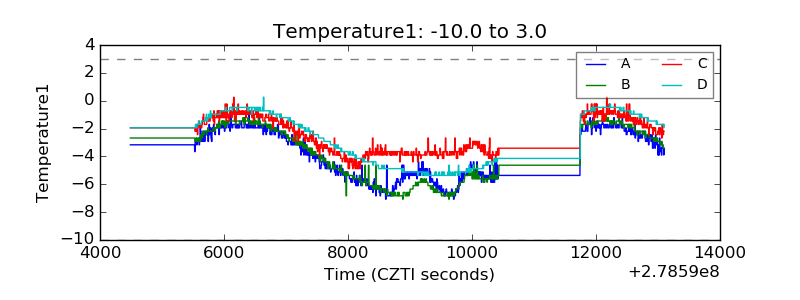 |
| Veto HV Monitor |  |
| Veto LLD | 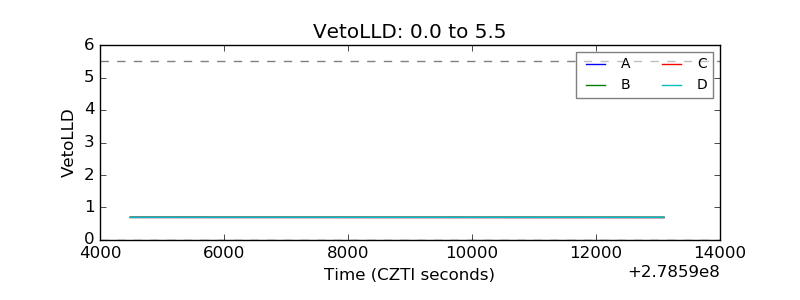 |
| Alpha Counter | 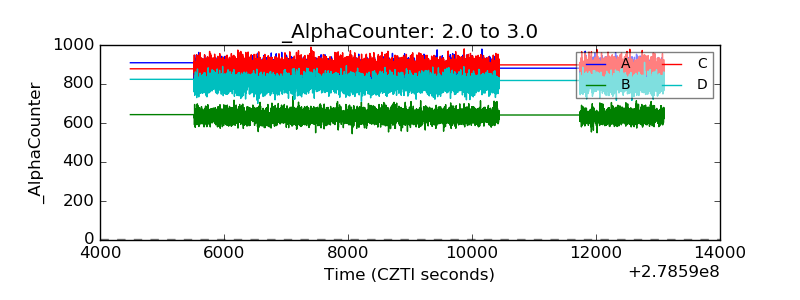 |
| _CPM_Rate | 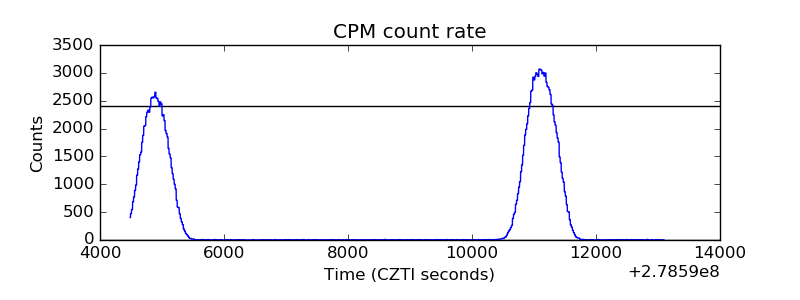 |
| CZT Counter | 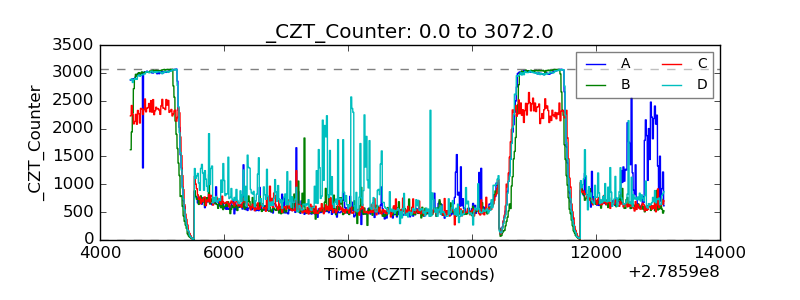 |
| +2.5 Volts monitor |  |
| +5 Volts monitor |  |
| _ROLL_ROT | 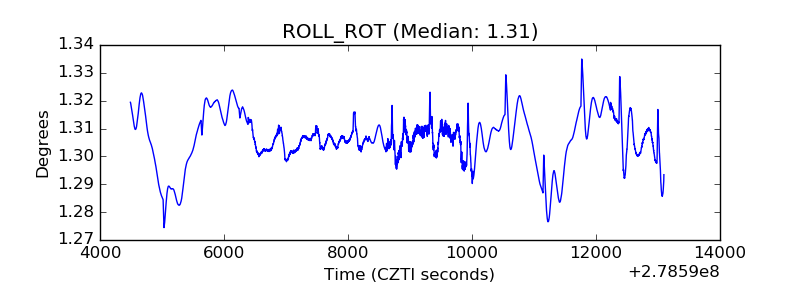 |
| _Roll_DEC | 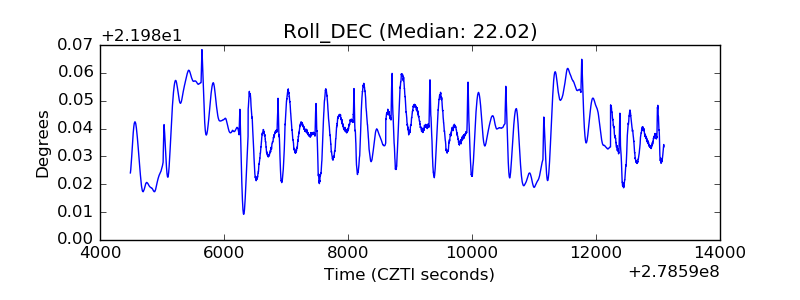 |
| _Roll_RA | 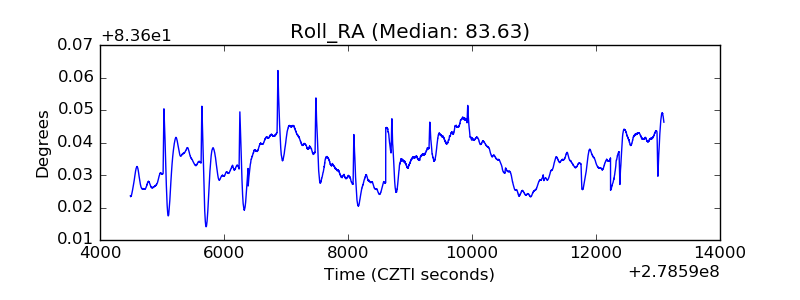 |
| Veto Counter | 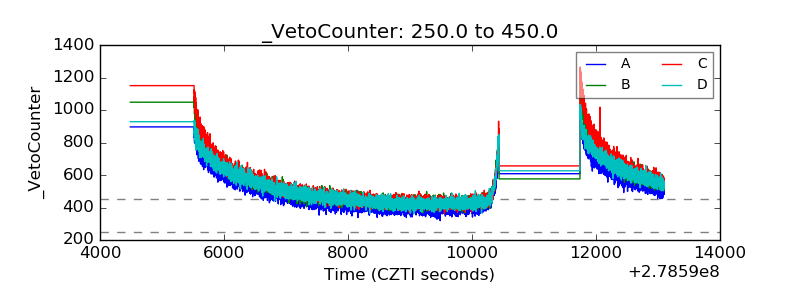 |