| Param | Original file | Final file |
|---|---|---|
| Filename | modeM0/AS1T03_024T01_9000002472_16703cztM0_level2.evt | modeM0/AS1T03_024T01_9000002472_16703cztM0_level2_quad_clean.evt |
| Size (bytes) | 712,912,320 | 77,837,760 |
| Size | 679.9 MB | 74.2 MB |
| Events in quadrant A | 5,999,802 | 502,279 |
| Events in quadrant B | 3,688,907 | 519,296 |
| Events in quadrant C | 3,700,723 | 503,526 |
| Events in quadrant D | 7,784,897 | 401,118 |
| Mode M9 | |||
|---|---|---|---|
| Quadrant | BADHDUFLAG | Total packets | Discarded packets |
| A | 0 | 17 | 0 |
| B | 0 | 17 | 0 |
| C | 0 | 17 | 0 |
| D | 0 | 18 | 0 |
| Mode M0 | |||
|---|---|---|---|
| Quadrant | BADHDUFLAG | Total packets | Discarded packets |
| A | 0 | 22011 | 3 |
| B | 0 | 15123 | 2 |
| C | 0 | 15114 | 2 |
| D | 0 | 27489 | 2 |
| Mode SS | |||
|---|---|---|---|
| Quadrant | BADHDUFLAG | Total packets | Discarded packets |
| A | 0 | 126 | 0 |
| B | 0 | 126 | 0 |
| C | 0 | 126 | 0 |
| D | 0 | 126 | 0 |
| Quadrant | Total seconds | Saturated seconds | Saturation percentage |
|---|---|---|---|
| A | 6158 | 1149 | 18.658655% |
| B | 6158 | 119 | 1.932446% |
| C | 6158 | 147 | 2.387139% |
| D | 6158 | 1719 | 27.914907% |
Noise dominated data is calculated using 1-second bins in cleaned event files. If a bin has >2000 counts, and if more than 50% of those come from <1% of pixels, then it is considered to be noise-dominated and hence unusable.
| Quadrant | # 1 sec bins | Bins with >0 counts | Bins with >2000 counts | High rate bins dominated by noise | Noise dominated (total time) | Noise dominated (detector-on time) | Marked lightcurve |
|---|---|---|---|---|---|---|---|
| A | 7504 | 6160 | 635 | 635 | 8.46% | 10.31% | 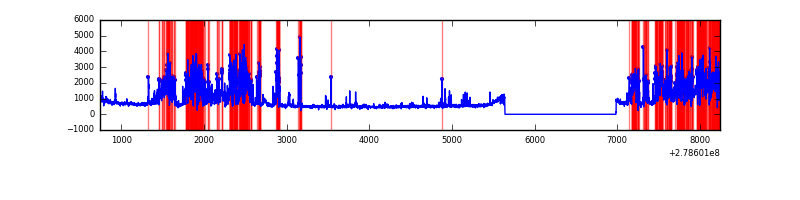 |
| B | 7504 | 6160 | 2 | 2 | 0.03% | 0.03% | 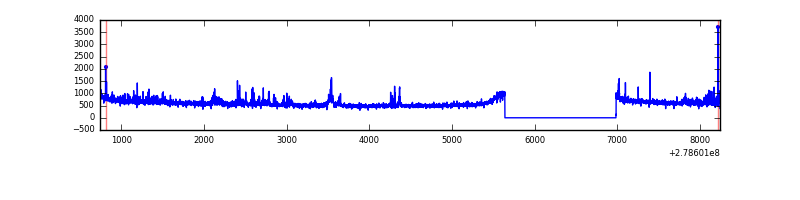 |
| C | 7504 | 6160 | 4 | 4 | 0.05% | 0.06% | 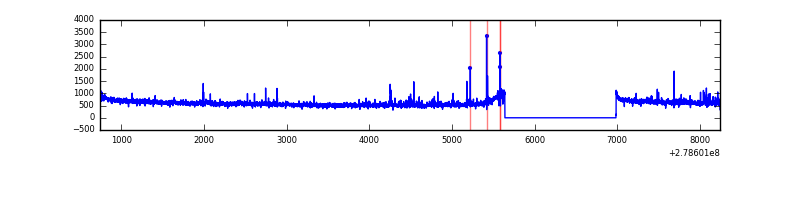 |
| D | 7504 | 6160 | 1419 | 1419 | 18.91% | 23.04% | 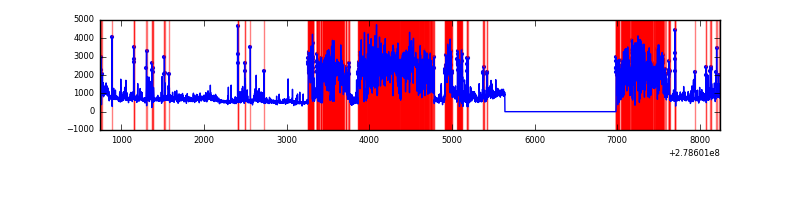 |
Top three noisy pixels from each quadrant. If the there are fewer than three noisy pixels in the level2.evt file, extra rows are filled as -1
| Pixel properties | Quadrant properties | ||||||
|---|---|---|---|---|---|---|---|
| Quadrant | DetID | PixID | Counts | Sigma | Mean | Median | Sigma |
| A | 15 | 174 | 2559705 | 15265.0 | 840 | 828 | 167.6 |
| A | 12 | 96 | 142122 | 842.89 | 840 | 828 | 167.6 |
| A | 3 | 1 | 23204 | 133.48 | 840 | 828 | 167.6 |
| B | 15 | 35 | 74830 | 450.69 | 892 | 875 | 164.1 |
| B | 5 | 236 | 44674 | 266.92 | 892 | 875 | 164.1 |
| B | 0 | 189 | 40009 | 238.49 | 892 | 875 | 164.1 |
| C | 14 | 238 | 137260 | 685.38 | 870 | 882 | 199.0 |
| C | 0 | 207 | 79471 | 394.96 | 870 | 882 | 199.0 |
| C | 3 | 233 | 64618 | 320.31 | 870 | 882 | 199.0 |
| D | 2 | 16 | 2856042 | 15436.78 | 767 | 749 | 185.0 |
| D | 1 | 52 | 1771643 | 9574.11 | 767 | 749 | 185.0 |
| D | 5 | 222 | 133891 | 719.82 | 767 | 749 | 185.0 |
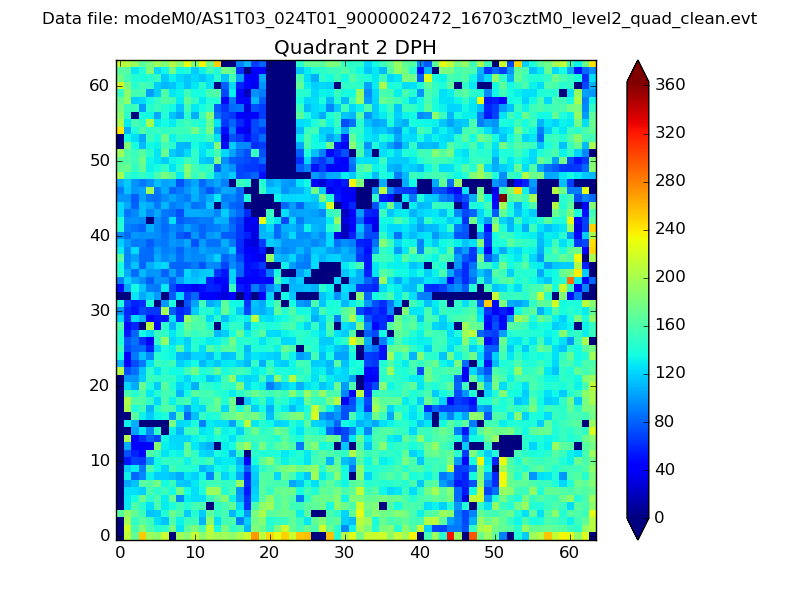
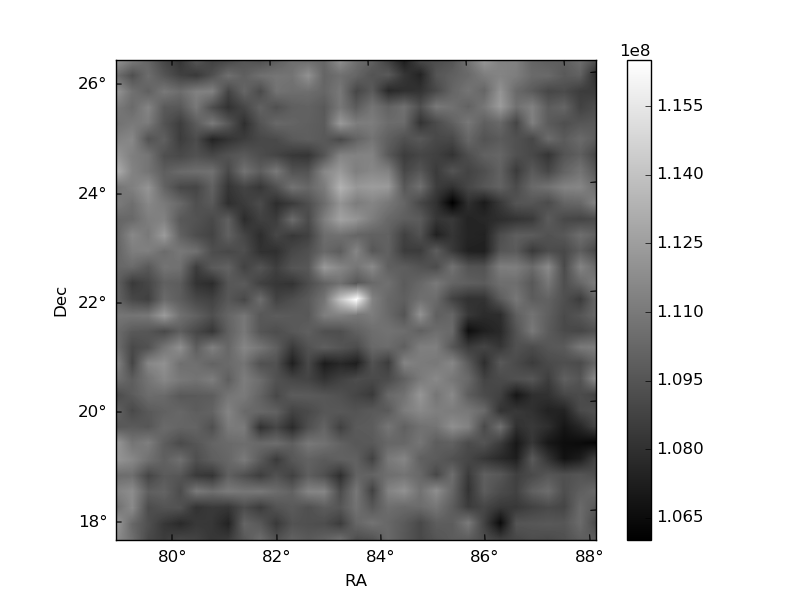
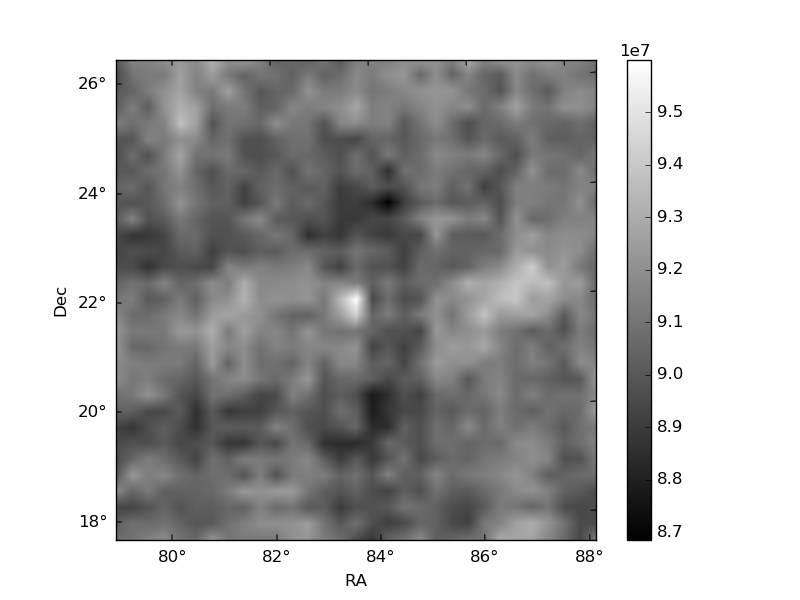
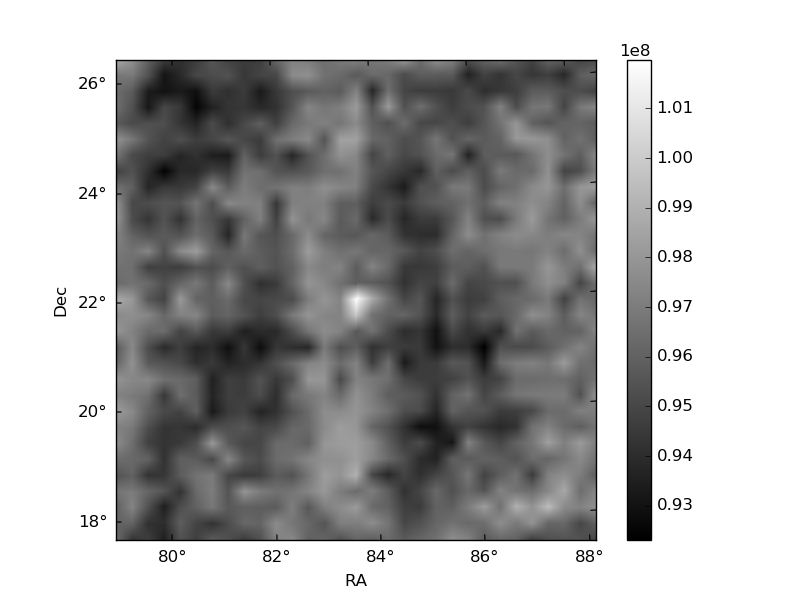
Histogram calculated using DETX and DETY for each event in the final _common_clean file
| Quadrant A | 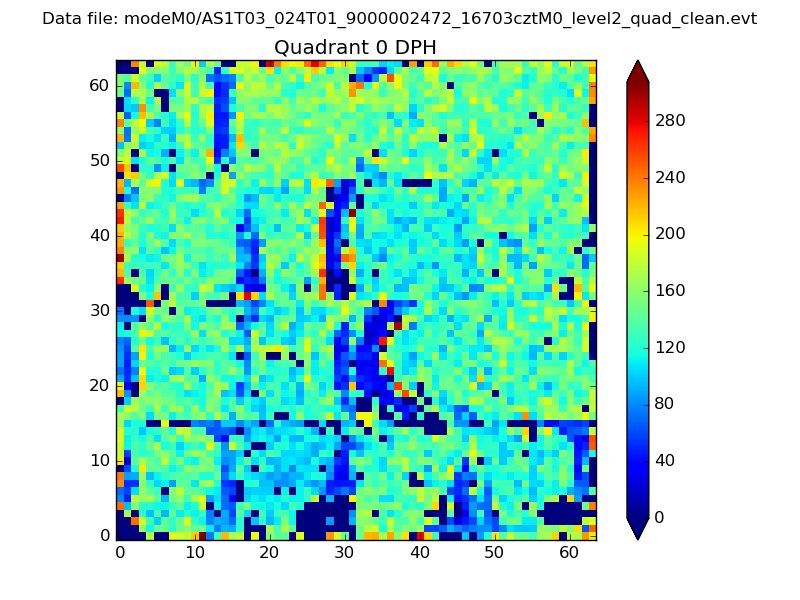 |
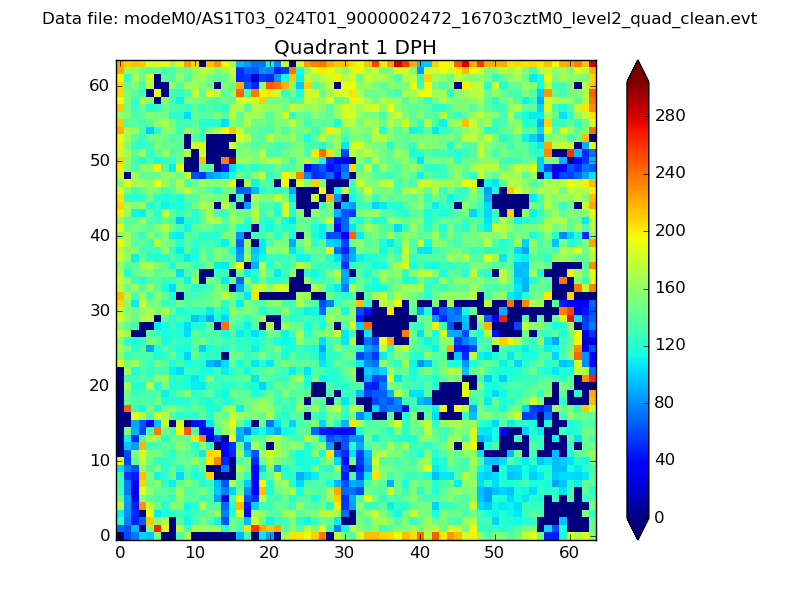 |
Quadrant B |
|---|---|---|---|
| Quadrant D | 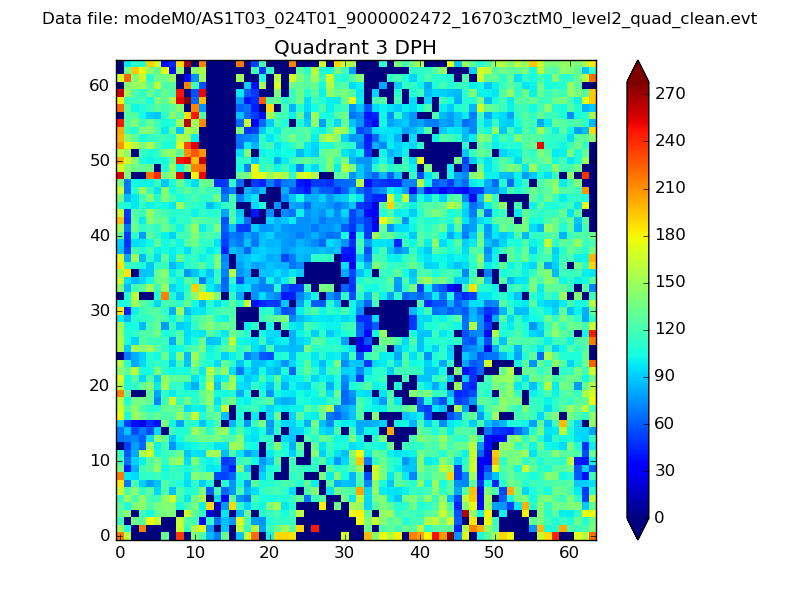 |
 |
Quadrant C |
| Plot type | Count rate plots | Images |
|---|---|---|
| Comparison with Poisson distribution Blue bars denote a histogram of data divided into 1 sec bins. Red curve is a Poisson curve with rate = median count rate of data. |
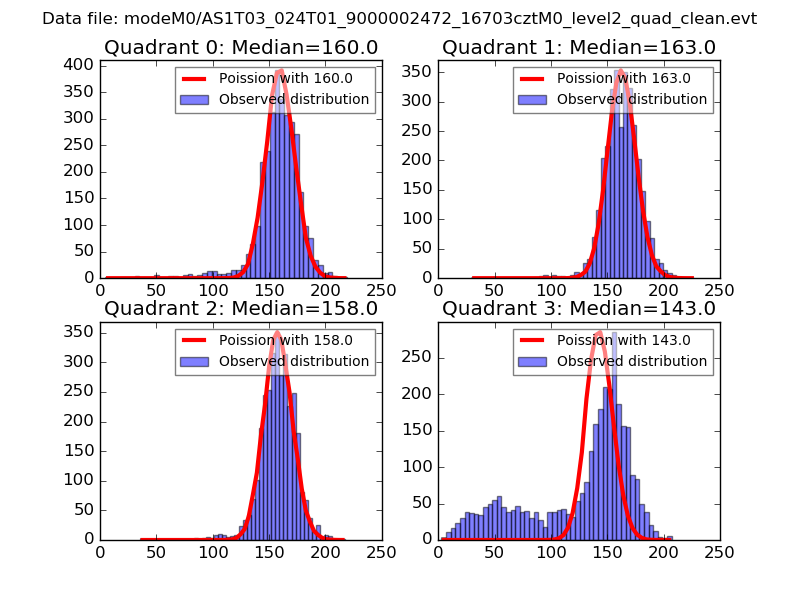 |
 |
| Quadrant-wise count rates Data is divided into 100 sec bins |
 |
|
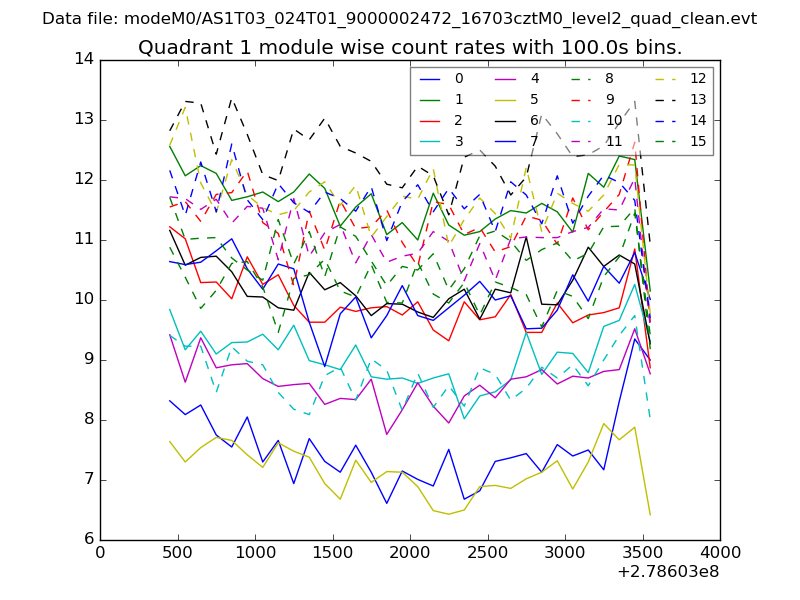
| Module-wise count rates for Quadrant A Data is divided into 100 sec bins |
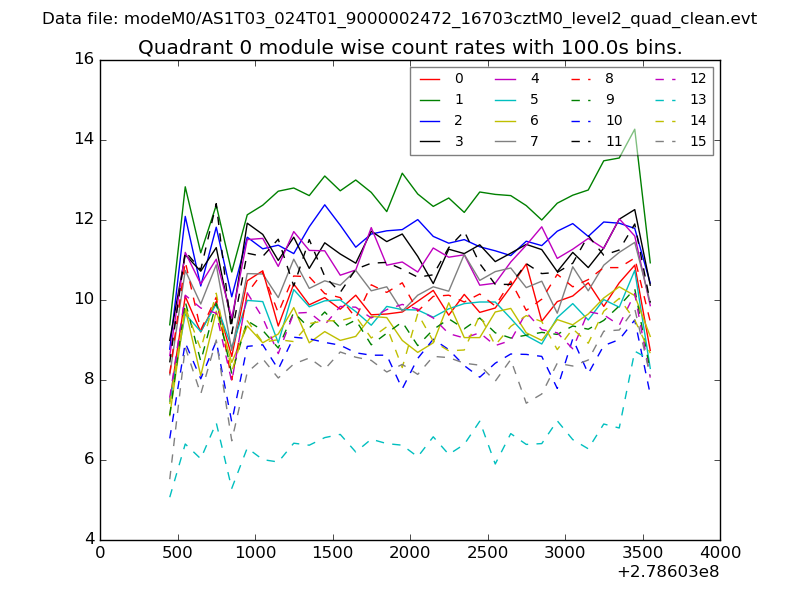 |
 |
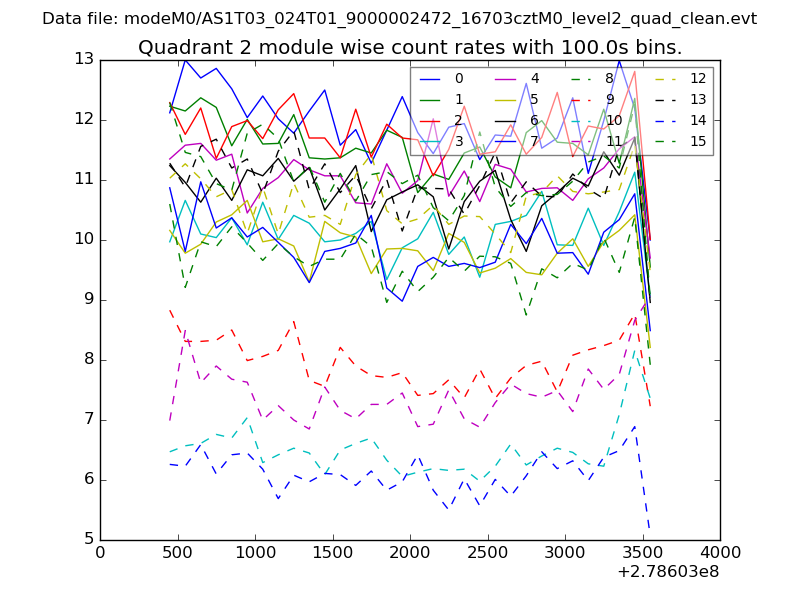
| Module-wise count rates for Quadrant B Data is divided into 100 sec bins |
 |
 |
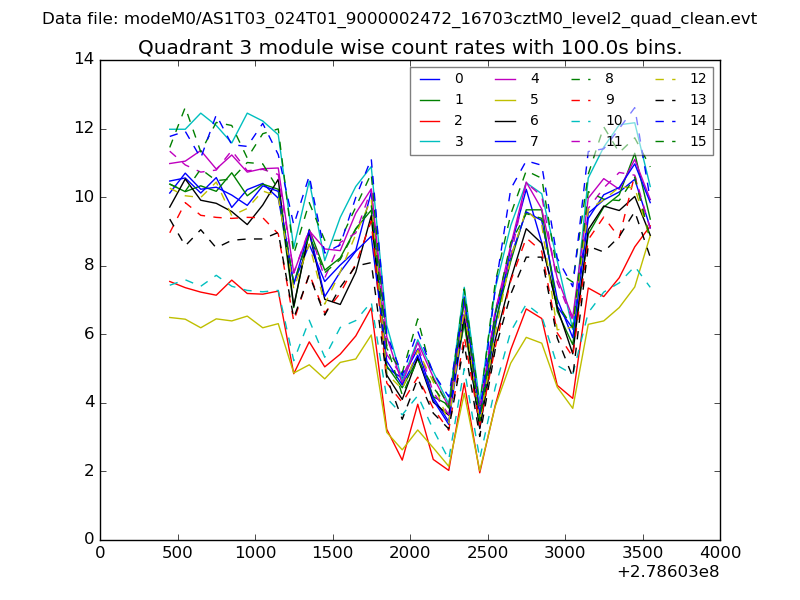
| Module-wise count rates for Quadrant C Data is divided into 100 sec bins |
 |
 |
| Module-wise count rates for Quadrant D Data is divided into 100 sec bins |
 |
 |
| Parameter | Plot |
|---|---|
| CZT HV Monitor | 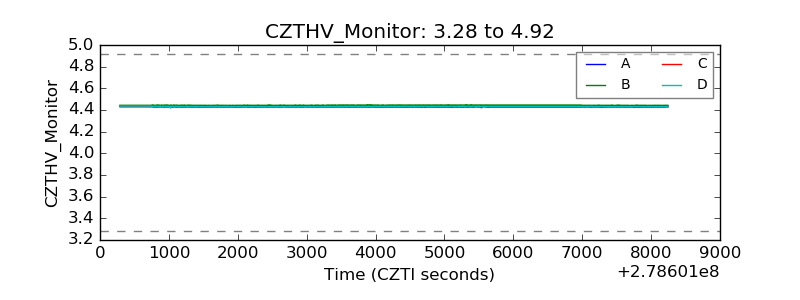 |
| D_VDD | 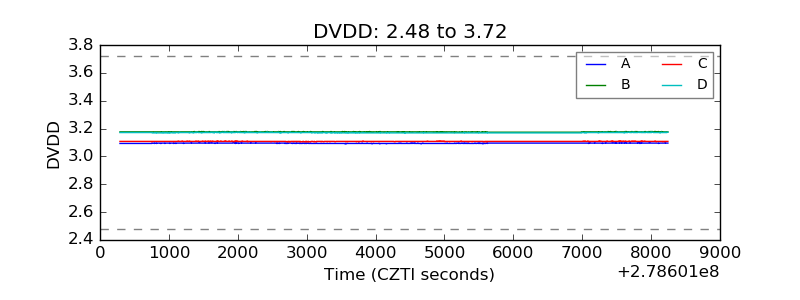 |
| Temperature 1 | 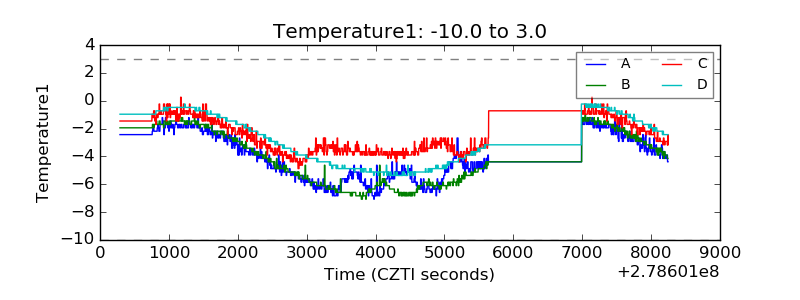 |
| Veto HV Monitor | 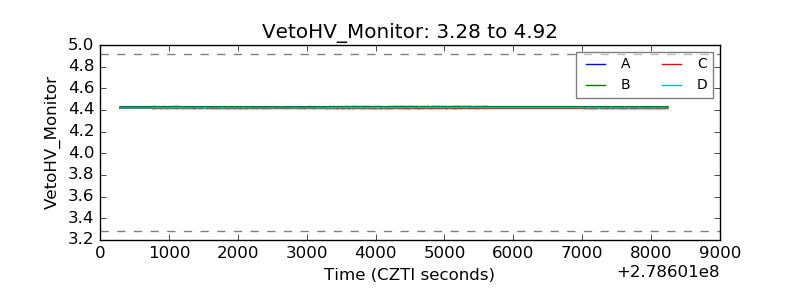 |
| Veto LLD | 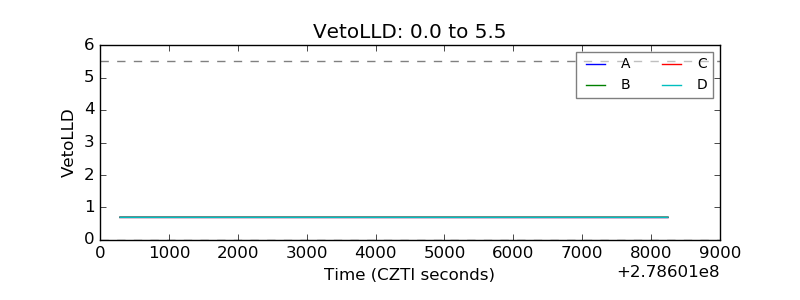 |
| Alpha Counter | 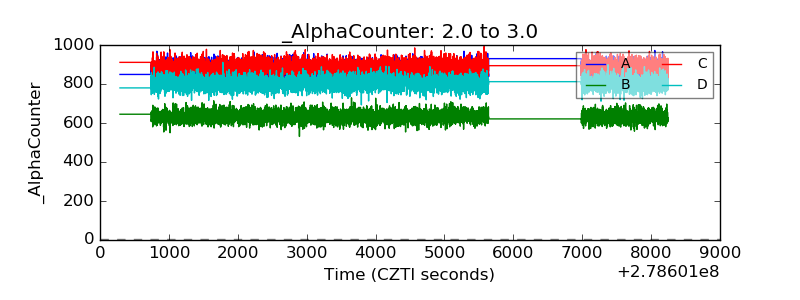 |
| _CPM_Rate | 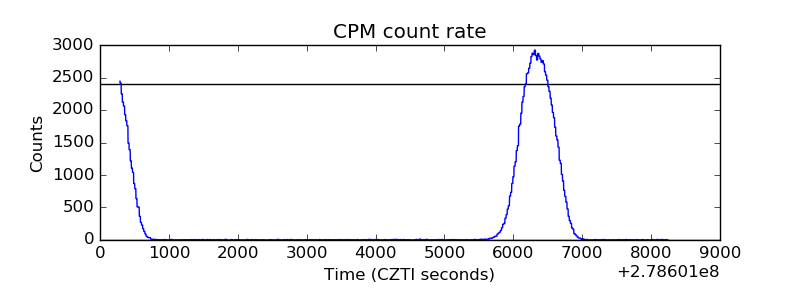 |
| CZT Counter | 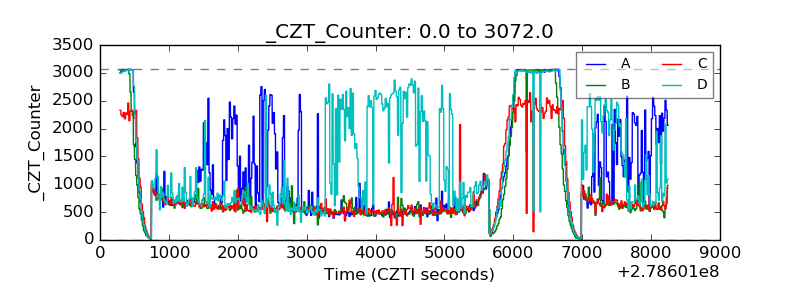 |
| +2.5 Volts monitor |  |
| +5 Volts monitor |  |
| _ROLL_ROT | 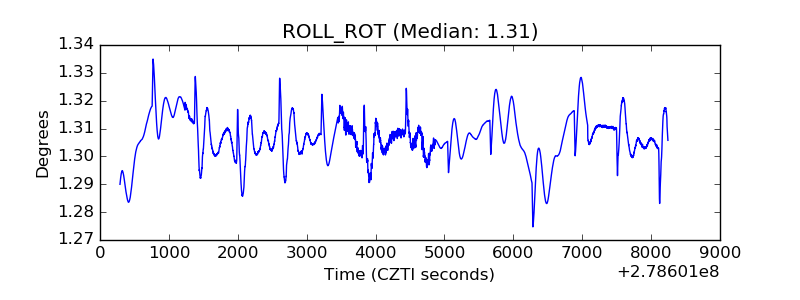 |
| _Roll_DEC | 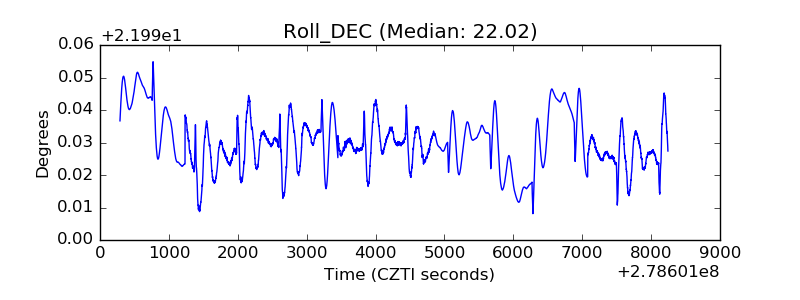 |
| _Roll_RA | 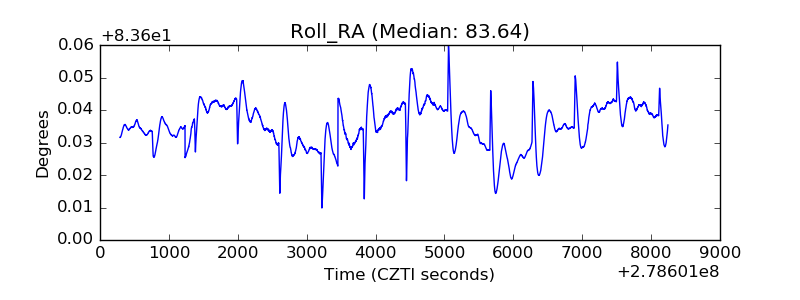 |
| Veto Counter | 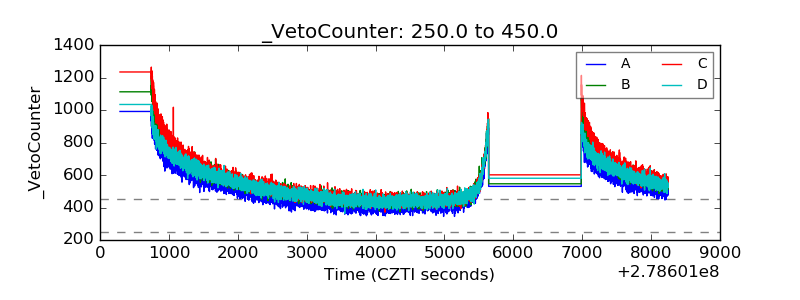 |