| Param | Original file | Final file |
|---|---|---|
| Filename | modeM0/AS1T03_024T01_9000002472_16705cztM0_level2.evt | modeM0/AS1T03_024T01_9000002472_16705cztM0_level2_quad_clean.evt |
| Size (bytes) | 634,703,040 | 101,692,800 |
| Size | 605.3 MB | 97.0 MB |
| Events in quadrant A | 5,169,522 | 662,944 |
| Events in quadrant B | 3,543,115 | 696,358 |
| Events in quadrant C | 3,511,394 | 674,342 |
| Events in quadrant D | 6,586,359 | 620,593 |
| Mode M9 | |||
|---|---|---|---|
| Quadrant | BADHDUFLAG | Total packets | Discarded packets |
| A | 0 | 12 | 0 |
| B | 0 | 12 | 0 |
| C | 0 | 12 | 0 |
| D | 0 | 12 | 0 |
| Mode M0 | |||
|---|---|---|---|
| Quadrant | BADHDUFLAG | Total packets | Discarded packets |
| A | 0 | 19313 | 2 |
| B | 0 | 14421 | 1 |
| C | 0 | 14196 | 1 |
| D | 0 | 23961 | 1 |
| Mode SS | |||
|---|---|---|---|
| Quadrant | BADHDUFLAG | Total packets | Discarded packets |
| A | 0 | 124 | 0 |
| B | 0 | 124 | 0 |
| C | 0 | 124 | 0 |
| D | 0 | 124 | 0 |
| Quadrant | Total seconds | Saturated seconds | Saturation percentage |
|---|---|---|---|
| A | 6091 | 541 | 8.881957% |
| B | 6091 | 96 | 1.576096% |
| C | 6091 | 138 | 2.265638% |
| D | 6091 | 782 | 12.838614% |
Noise dominated data is calculated using 1-second bins in cleaned event files. If a bin has >2000 counts, and if more than 50% of those come from <1% of pixels, then it is considered to be noise-dominated and hence unusable.
| Quadrant | # 1 sec bins | Bins with >0 counts | Bins with >2000 counts | High rate bins dominated by noise | Noise dominated (total time) | Noise dominated (detector-on time) | Marked lightcurve |
|---|---|---|---|---|---|---|---|
| A | 7272 | 6093 | 411 | 411 | 5.65% | 6.75% | 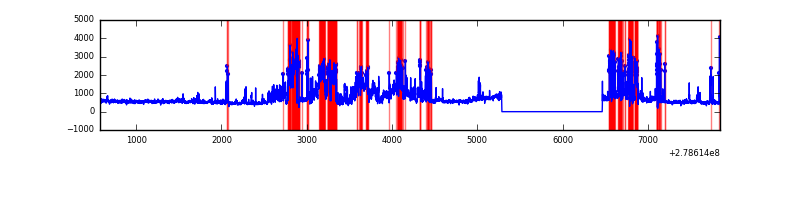 |
| B | 7272 | 6093 | 8 | 8 | 0.11% | 0.13% | 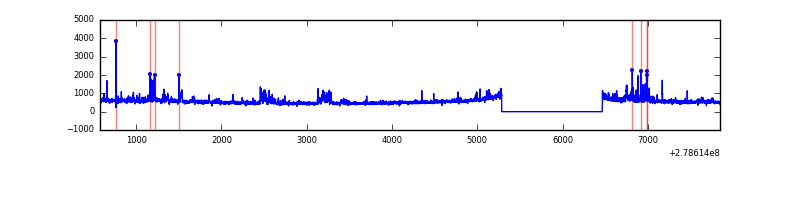 |
| C | 7272 | 6093 | 14 | 14 | 0.19% | 0.23% | 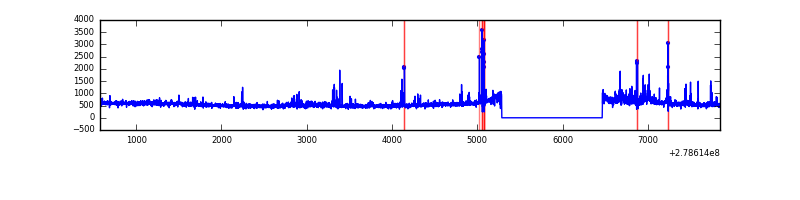 |
| D | 7272 | 6093 | 523 | 523 | 7.19% | 8.58% | 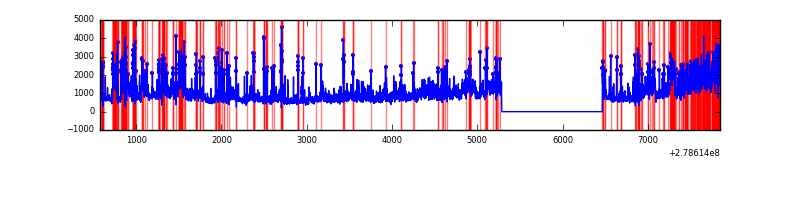 |
Top three noisy pixels from each quadrant. If the there are fewer than three noisy pixels in the level2.evt file, extra rows are filled as -1
| Pixel properties | Quadrant properties | ||||||
|---|---|---|---|---|---|---|---|
| Quadrant | DetID | PixID | Counts | Sigma | Mean | Median | Sigma |
| A | 15 | 174 | 2147673 | 13458.56 | 784 | 768 | 159.5 |
| A | 0 | 226 | 6826 | 37.98 | 784 | 768 | 159.5 |
| A | 3 | 1 | 6473 | 35.76 | 784 | 768 | 159.5 |
| B | 15 | 35 | 170857 | 1103.92 | 812 | 794 | 154.1 |
| B | 0 | 229 | 48805 | 311.65 | 812 | 794 | 154.1 |
| B | 0 | 246 | 48543 | 309.95 | 812 | 794 | 154.1 |
| C | 0 | 207 | 178621 | 969.99 | 786 | 795 | 183.3 |
| C | 3 | 233 | 132572 | 718.8 | 786 | 795 | 183.3 |
| C | 14 | 238 | 121425 | 658.0 | 786 | 795 | 183.3 |
| D | 2 | 16 | 2073548 | 11238.17 | 757 | 739 | 184.4 |
| D | 1 | 52 | 1519274 | 8233.06 | 757 | 739 | 184.4 |
| D | 10 | 70 | 59782 | 320.11 | 757 | 739 | 184.4 |
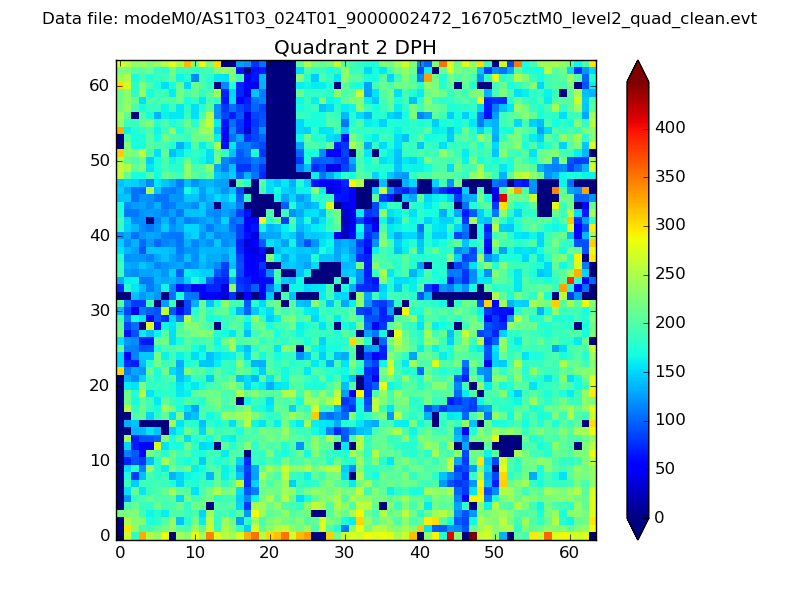
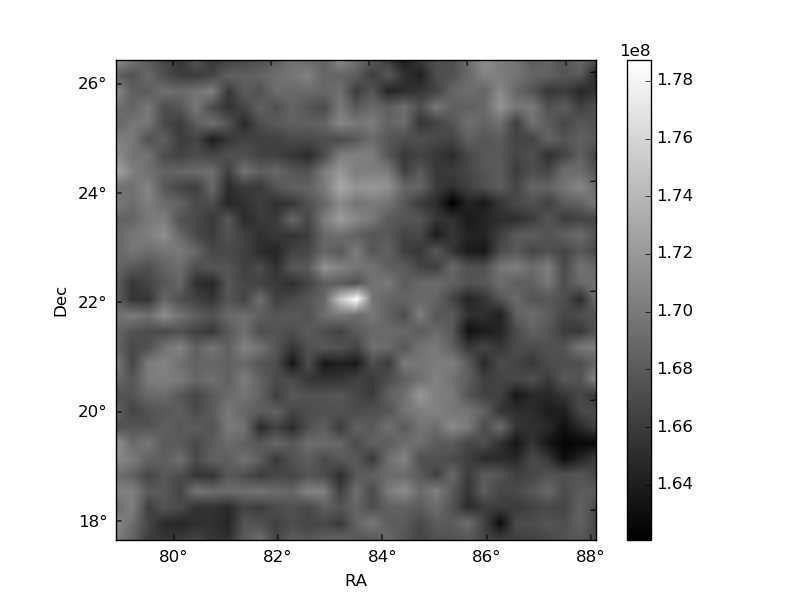
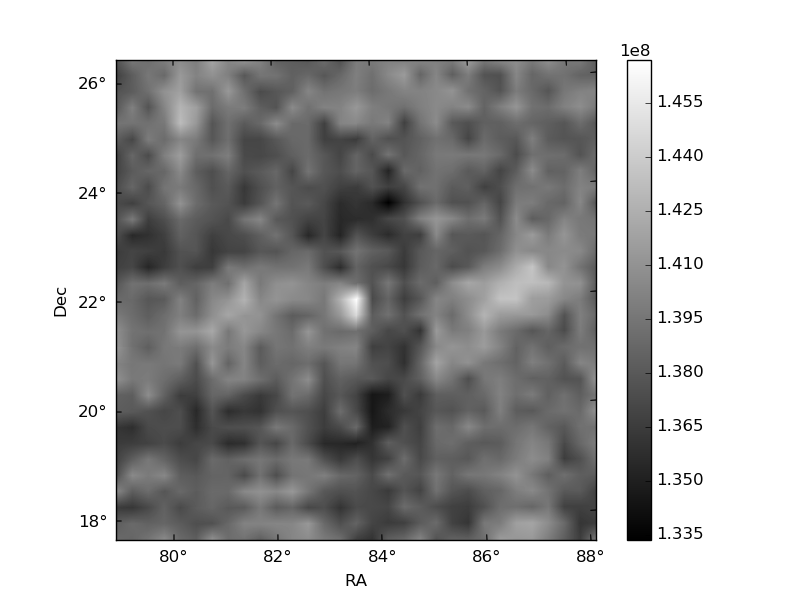
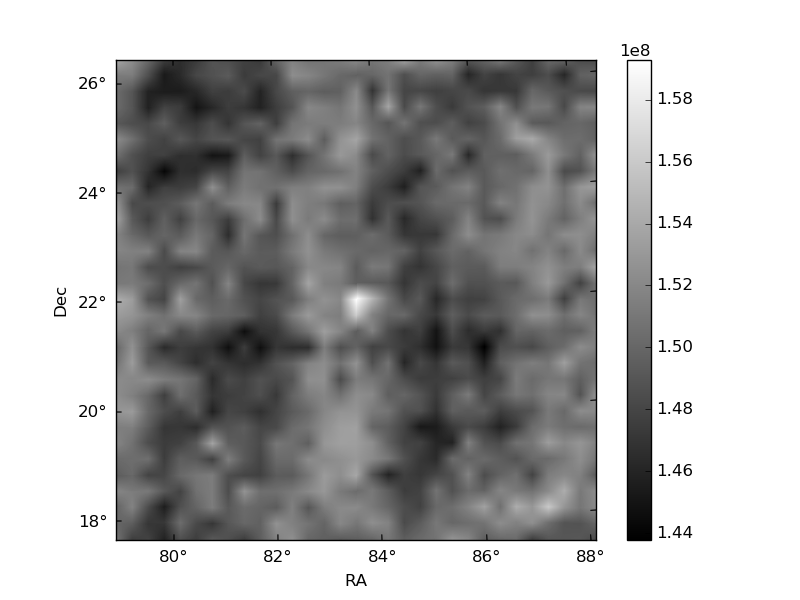
Histogram calculated using DETX and DETY for each event in the final _common_clean file
| Quadrant A | 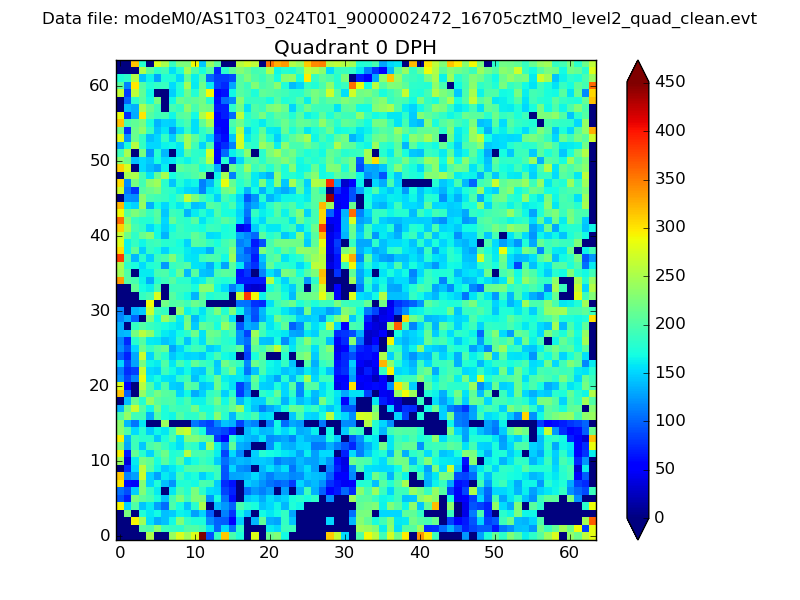 |
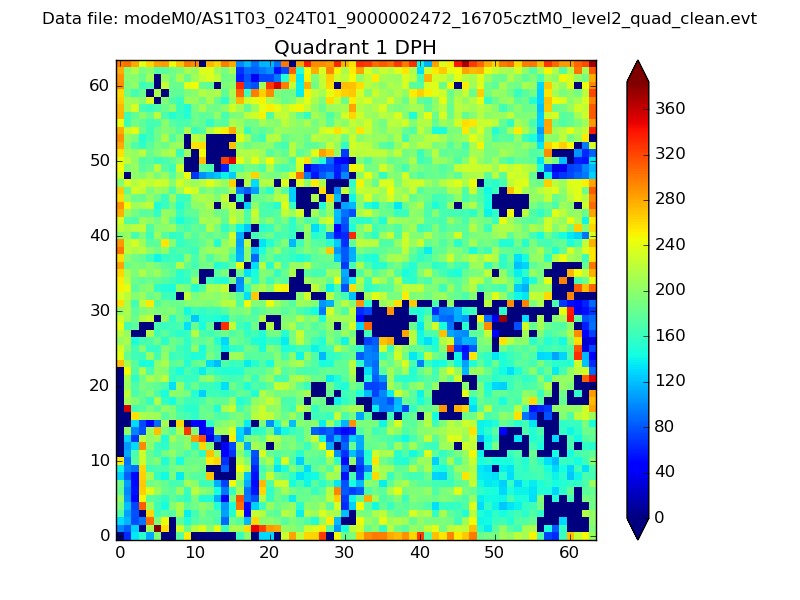 |
Quadrant B |
|---|---|---|---|
| Quadrant D | 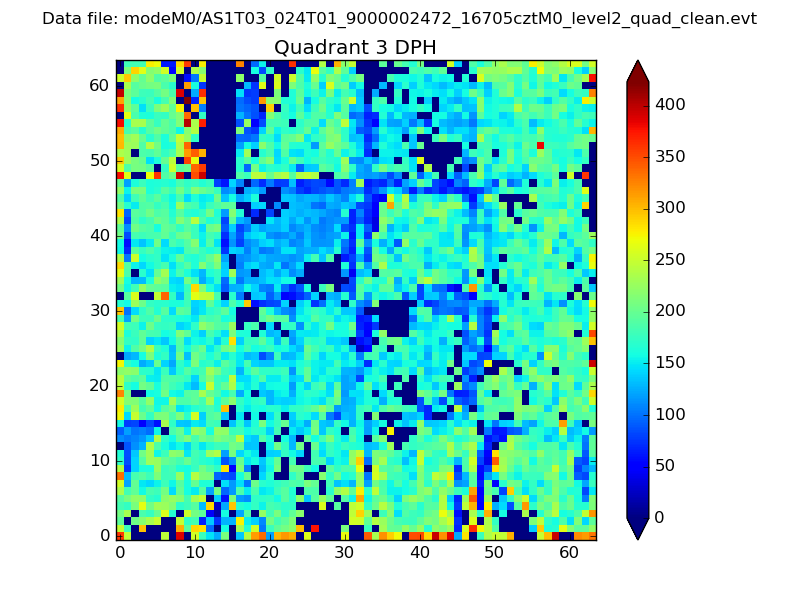 |
 |
Quadrant C |
| Plot type | Count rate plots | Images |
|---|---|---|
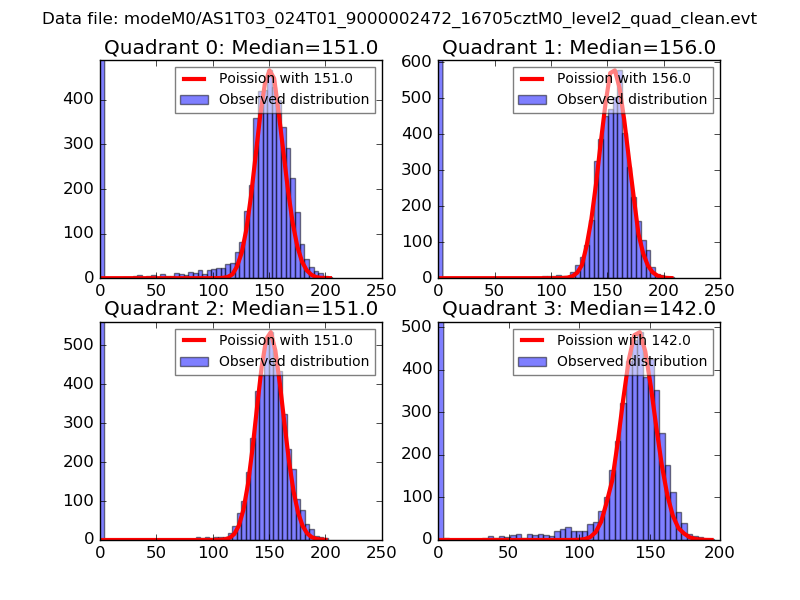
| Comparison with Poisson distribution Blue bars denote a histogram of data divided into 1 sec bins. Red curve is a Poisson curve with rate = median count rate of data. |
 |
 |
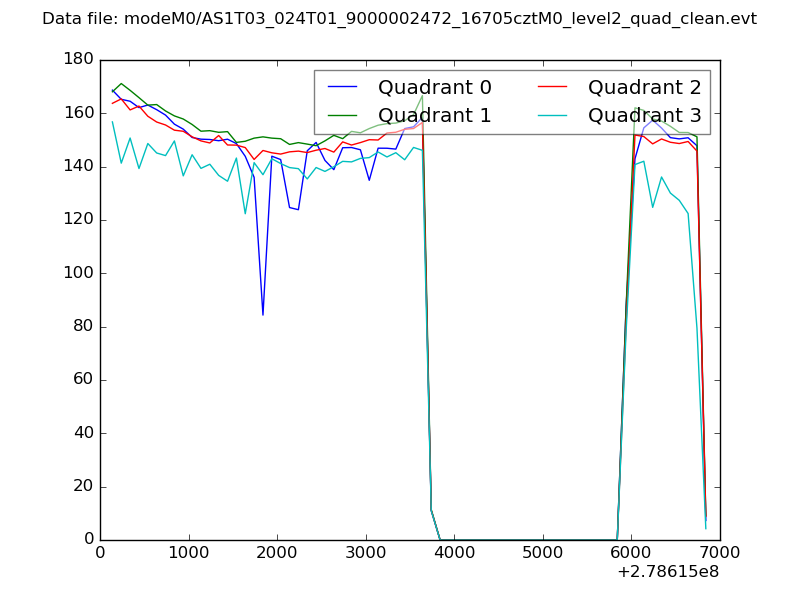
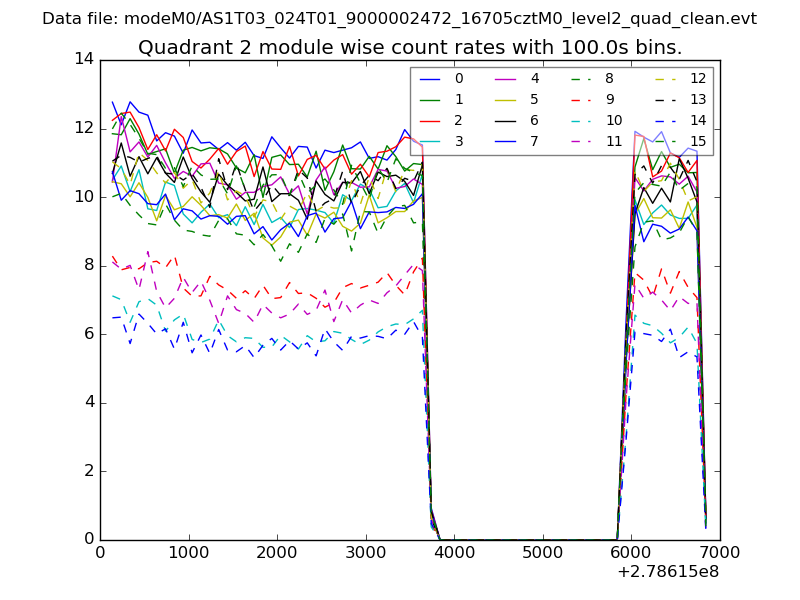
| Quadrant-wise count rates Data is divided into 100 sec bins |
 |
|
| Module-wise count rates for Quadrant A Data is divided into 100 sec bins |
 |
 |
| Module-wise count rates for Quadrant B Data is divided into 100 sec bins |
 |
 |
| Module-wise count rates for Quadrant C Data is divided into 100 sec bins |
 |
 |
| Module-wise count rates for Quadrant D Data is divided into 100 sec bins |
 |
 |
| Parameter | Plot |
|---|---|
| CZT HV Monitor | 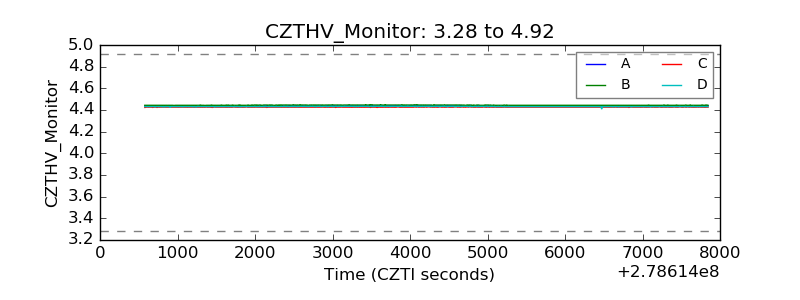 |
| D_VDD |  |
| Temperature 1 | 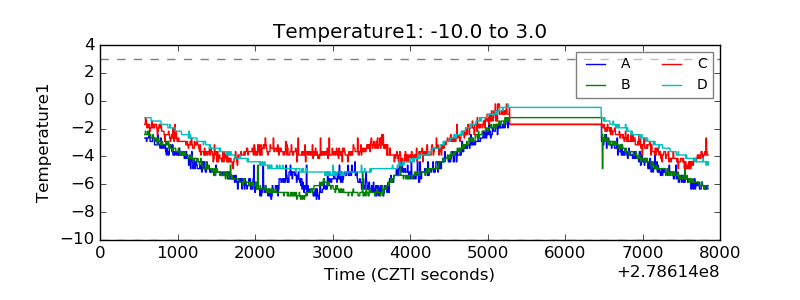 |
| Veto HV Monitor | 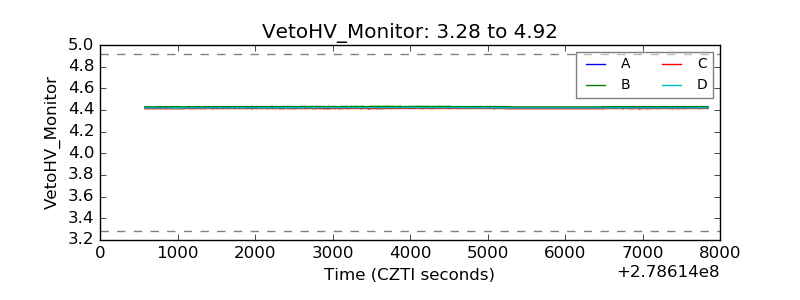 |
| Veto LLD |  |
| Alpha Counter | 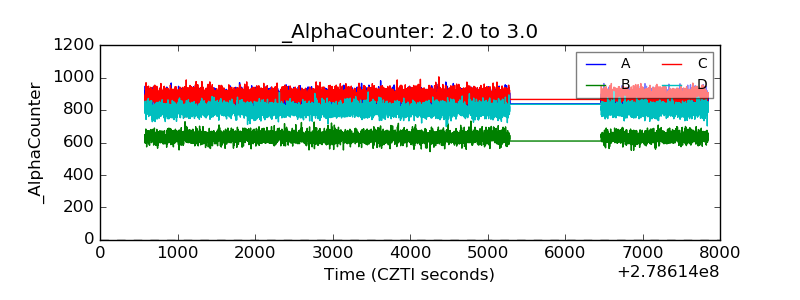 |
| _CPM_Rate | 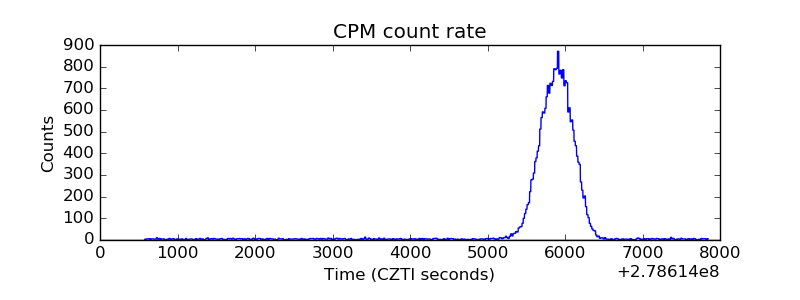 |
| CZT Counter | 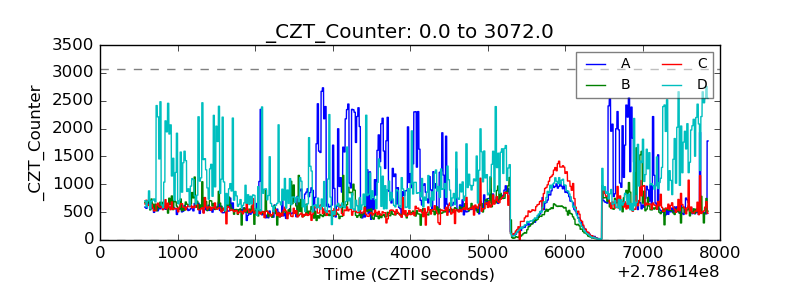 |
| +2.5 Volts monitor |  |
| +5 Volts monitor |  |
| _ROLL_ROT |  |
| _Roll_DEC | 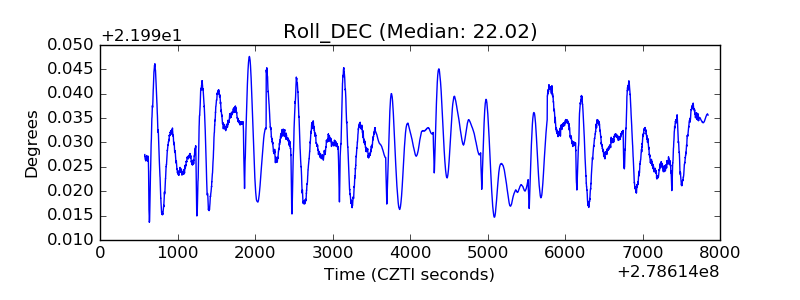 |
| _Roll_RA | 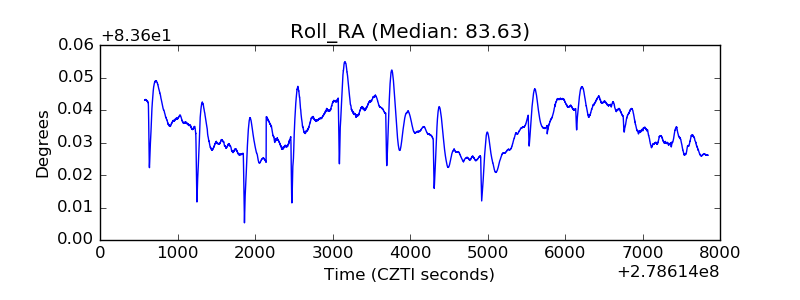 |
| Veto Counter | 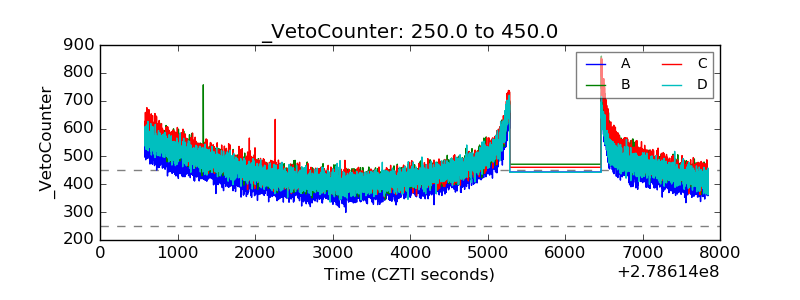 |