| Param | Original file | Final file |
|---|---|---|
| Filename | modeM0/AS1T03_024T01_9000002472_16706cztM0_level2.evt | modeM0/AS1T03_024T01_9000002472_16706cztM0_level2_quad_clean.evt |
| Size (bytes) | 852,168,960 | 97,657,920 |
| Size | 812.7 MB | 93.1 MB |
| Events in quadrant A | 4,162,323 | 700,401 |
| Events in quadrant B | 3,578,534 | 714,915 |
| Events in quadrant C | 3,758,047 | 687,712 |
| Events in quadrant D | 13,873,570 | 402,968 |
| Mode M9 | |||
|---|---|---|---|
| Quadrant | BADHDUFLAG | Total packets | Discarded packets |
| A | 0 | 8 | 0 |
| B | 0 | 8 | 0 |
| C | 0 | 8 | 0 |
| D | 0 | 8 | 0 |
| Mode M0 | |||
|---|---|---|---|
| Quadrant | BADHDUFLAG | Total packets | Discarded packets |
| A | 0 | 16558 | 2 |
| B | 0 | 14632 | 1 |
| C | 0 | 15191 | 1 |
| D | 0 | 45673 | 1 |
| Mode SS | |||
|---|---|---|---|
| Quadrant | BADHDUFLAG | Total packets | Discarded packets |
| A | 0 | 132 | 0 |
| B | 0 | 132 | 0 |
| C | 0 | 132 | 0 |
| D | 0 | 132 | 0 |
| Quadrant | Total seconds | Saturated seconds | Saturation percentage |
|---|---|---|---|
| A | 6447 | 421 | 6.530169% |
| B | 6447 | 96 | 1.489065% |
| C | 6447 | 174 | 2.698930% |
| D | 6447 | 4463 | 69.225997% |
Noise dominated data is calculated using 1-second bins in cleaned event files. If a bin has >2000 counts, and if more than 50% of those come from <1% of pixels, then it is considered to be noise-dominated and hence unusable.
| Quadrant | # 1 sec bins | Bins with >0 counts | Bins with >2000 counts | High rate bins dominated by noise | Noise dominated (total time) | Noise dominated (detector-on time) | Marked lightcurve |
|---|---|---|---|---|---|---|---|
| A | 7263 | 6450 | 246 | 246 | 3.39% | 3.81% | 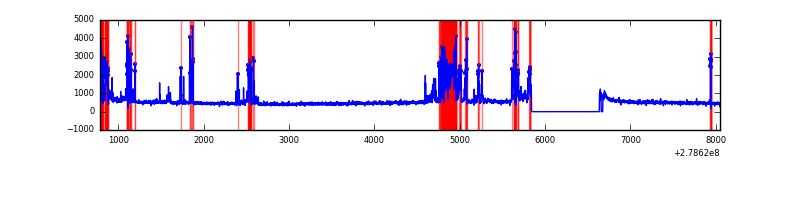 |
| B | 7263 | 6450 | 9 | 9 | 0.12% | 0.14% | 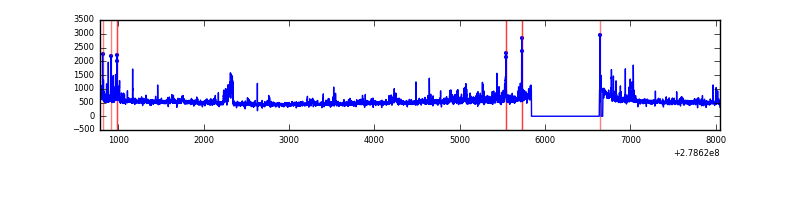 |
| C | 7263 | 6450 | 41 | 41 | 0.56% | 0.64% |  |
| D | 7263 | 6450 | 3810 | 3810 | 52.46% | 59.07% | 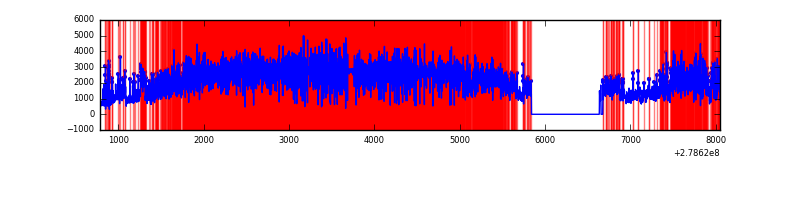 |
Top three noisy pixels from each quadrant. If the there are fewer than three noisy pixels in the level2.evt file, extra rows are filled as -1
| Pixel properties | Quadrant properties | ||||||
|---|---|---|---|---|---|---|---|
| Quadrant | DetID | PixID | Counts | Sigma | Mean | Median | Sigma |
| A | 15 | 174 | 1019604 | 6258.96 | 799 | 784 | 162.8 |
| A | 4 | 2 | 22173 | 131.4 | 799 | 784 | 162.8 |
| A | 15 | 190 | 13450 | 77.81 | 799 | 784 | 162.8 |
| B | 15 | 35 | 171646 | 1089.05 | 822 | 802 | 156.9 |
| B | 5 | 236 | 55983 | 351.75 | 822 | 802 | 156.9 |
| B | 0 | 246 | 34398 | 214.16 | 822 | 802 | 156.9 |
| C | 0 | 207 | 356713 | 1928.29 | 790 | 799 | 184.6 |
| C | 3 | 233 | 191842 | 1035.04 | 790 | 799 | 184.6 |
| C | 14 | 238 | 123838 | 666.61 | 790 | 799 | 184.6 |
| D | 2 | 16 | 9880861 | 72192.08 | 552 | 537 | 136.9 |
| D | 1 | 52 | 1754563 | 12816.06 | 552 | 537 | 136.9 |
| D | 5 | 222 | 39860 | 287.32 | 552 | 537 | 136.9 |
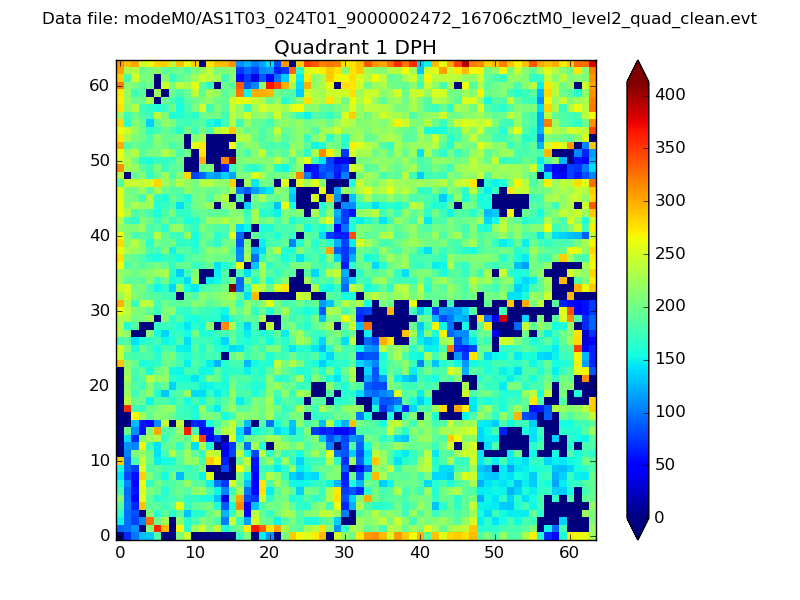
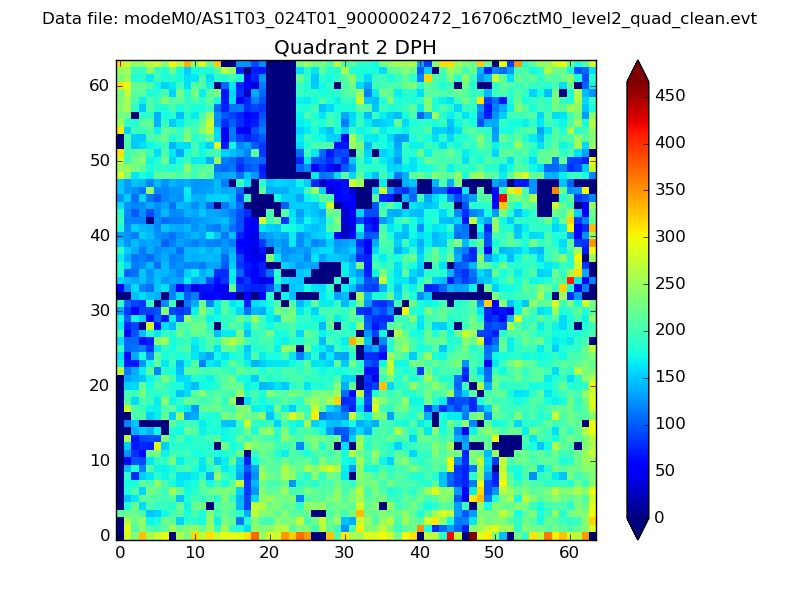
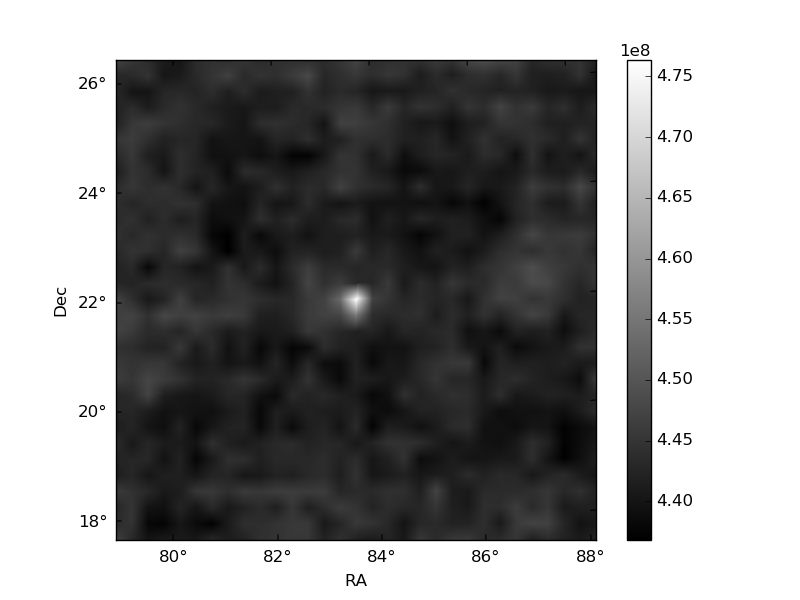
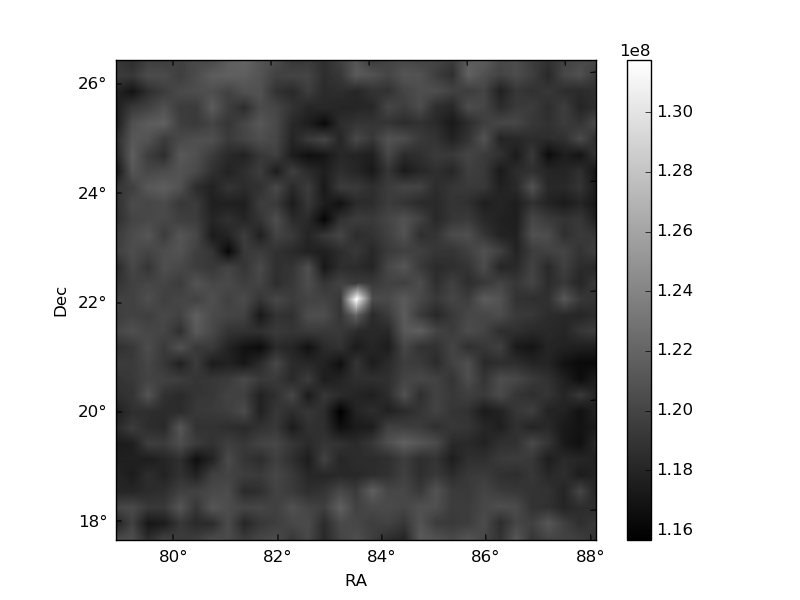
Histogram calculated using DETX and DETY for each event in the final _common_clean file
| Quadrant A | 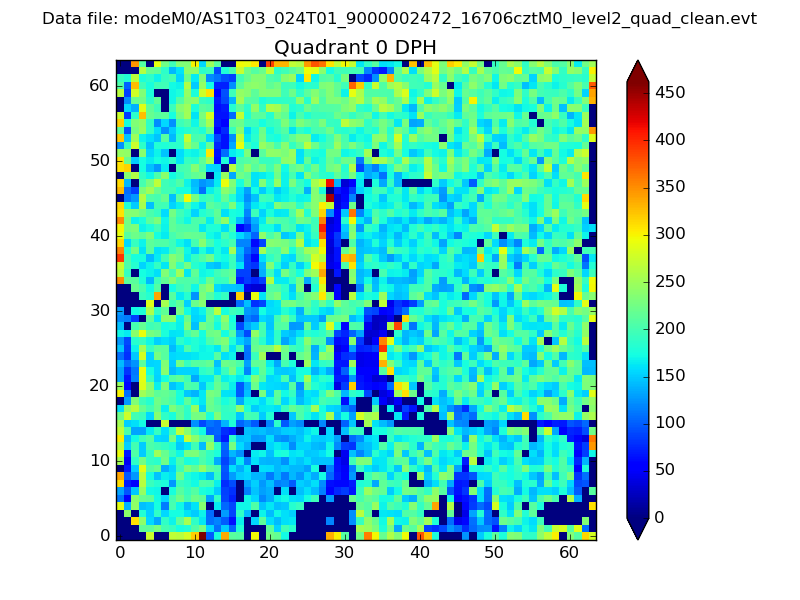 |
 |
Quadrant B |
|---|---|---|---|
| Quadrant D | 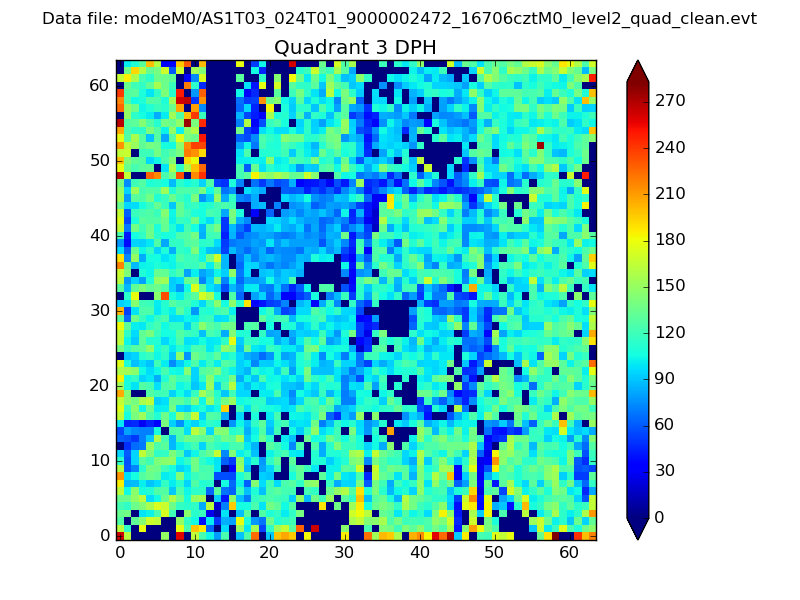 |
 |
Quadrant C |
| Plot type | Count rate plots | Images |
|---|---|---|
| Comparison with Poisson distribution Blue bars denote a histogram of data divided into 1 sec bins. Red curve is a Poisson curve with rate = median count rate of data. |
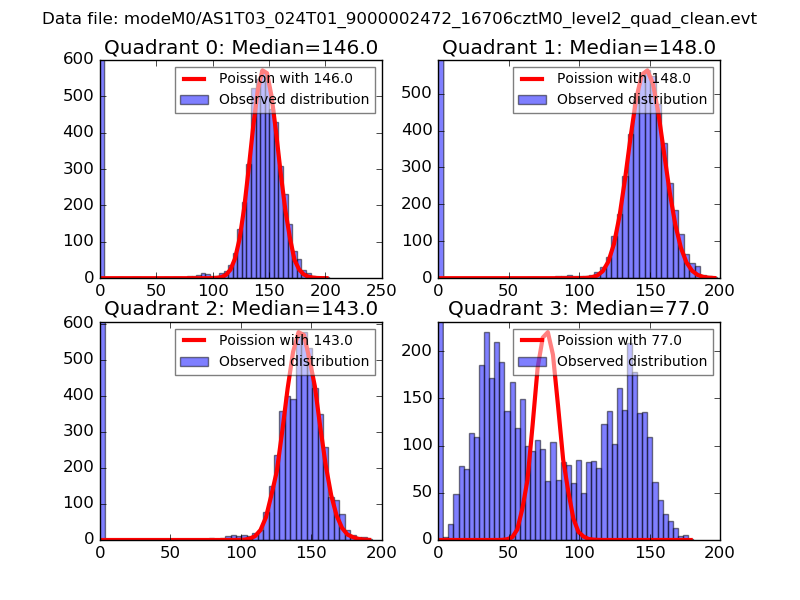 |
 |
| Quadrant-wise count rates Data is divided into 100 sec bins |
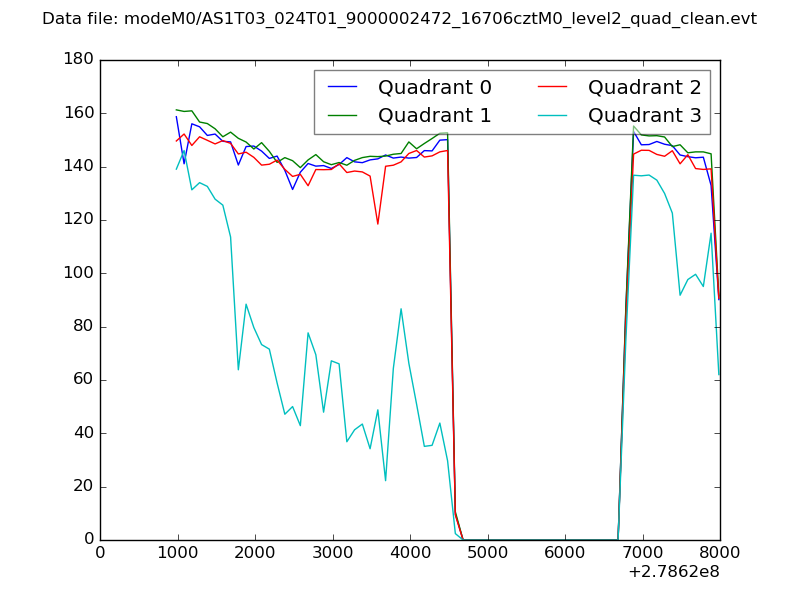 |
|
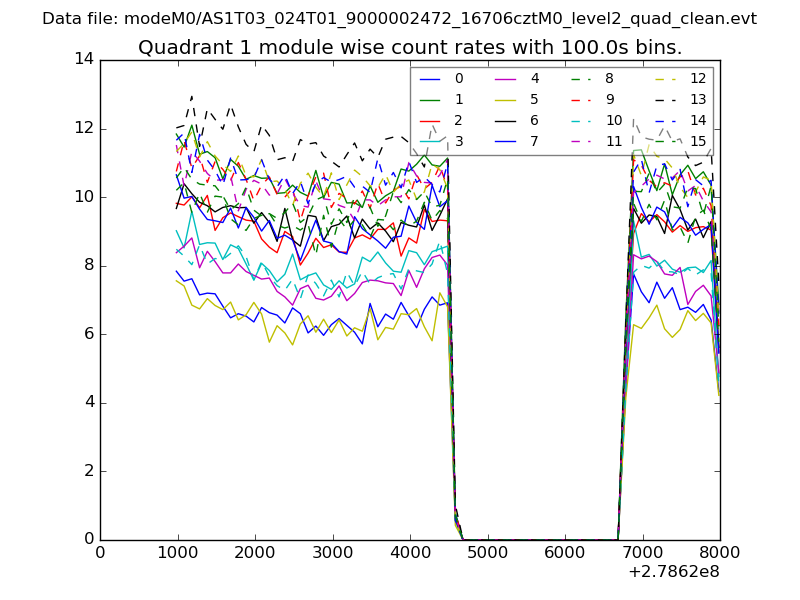
| Module-wise count rates for Quadrant A Data is divided into 100 sec bins |
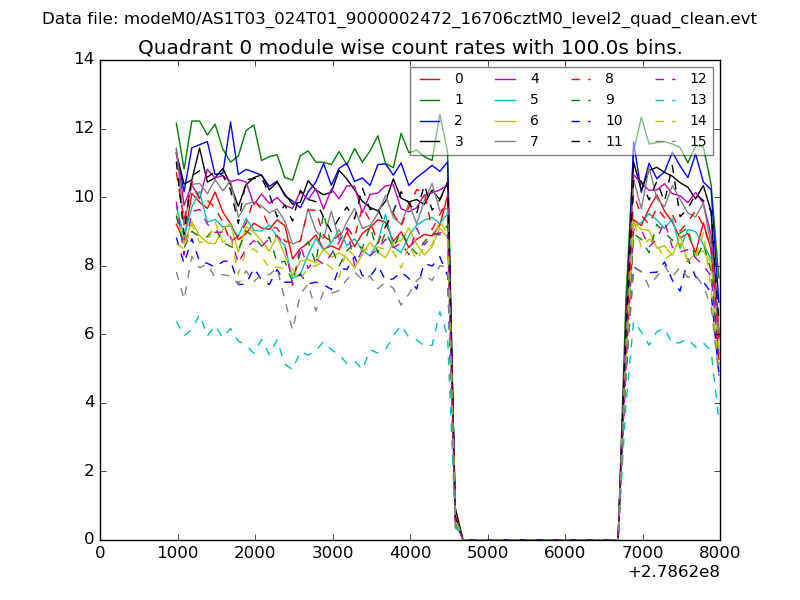 |
 |
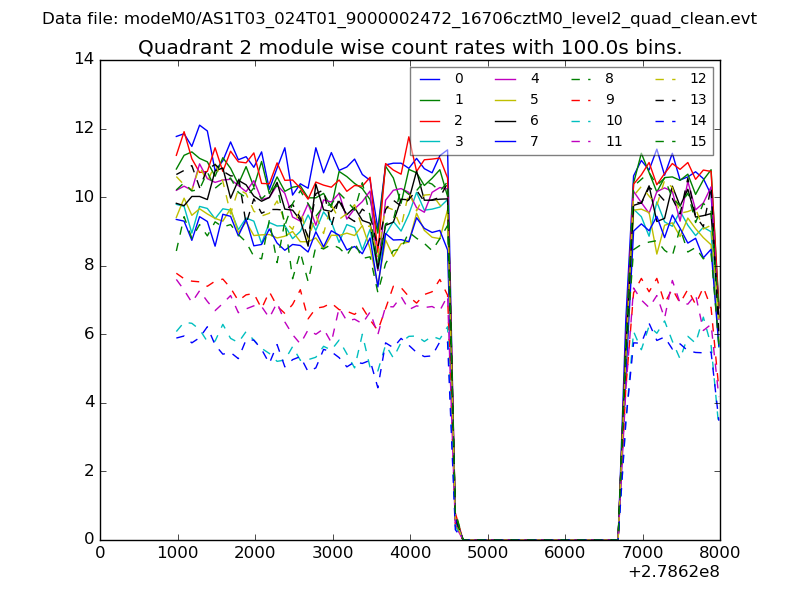
| Module-wise count rates for Quadrant B Data is divided into 100 sec bins |
 |
 |
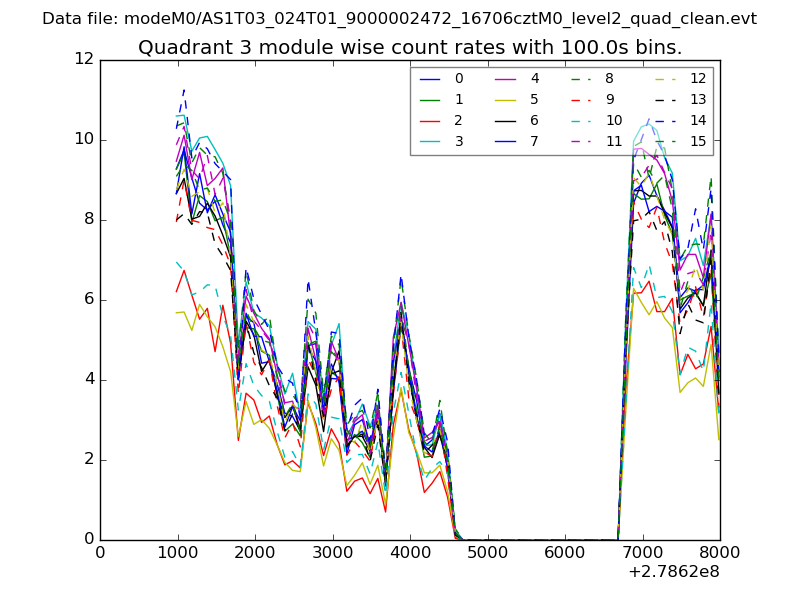
| Module-wise count rates for Quadrant C Data is divided into 100 sec bins |
 |
 |
| Module-wise count rates for Quadrant D Data is divided into 100 sec bins |
 |
 |
| Parameter | Plot |
|---|---|
| CZT HV Monitor | 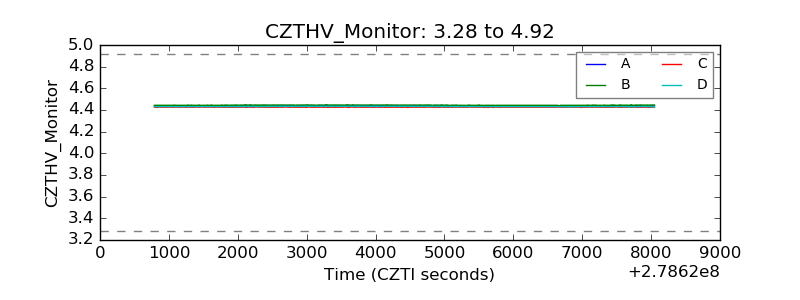 |
| D_VDD | 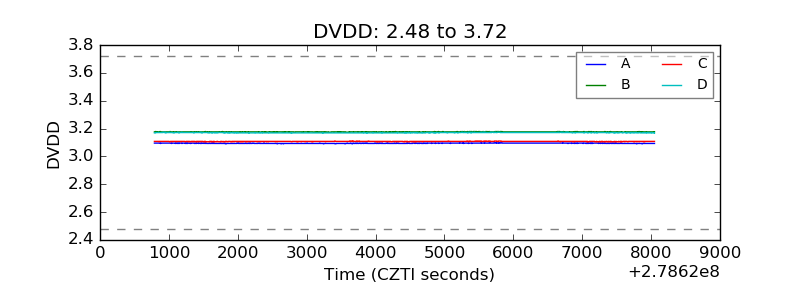 |
| Temperature 1 | 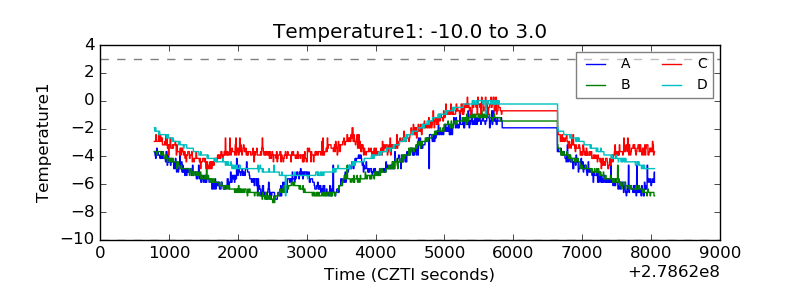 |
| Veto HV Monitor |  |
| Veto LLD | 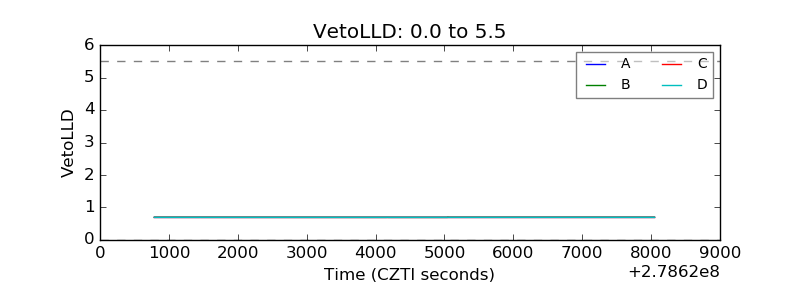 |
| Alpha Counter | 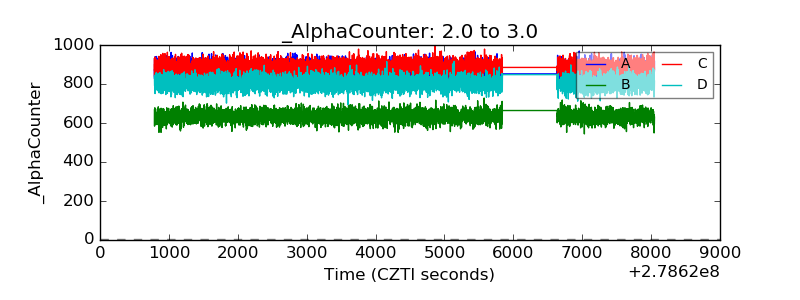 |
| _CPM_Rate | 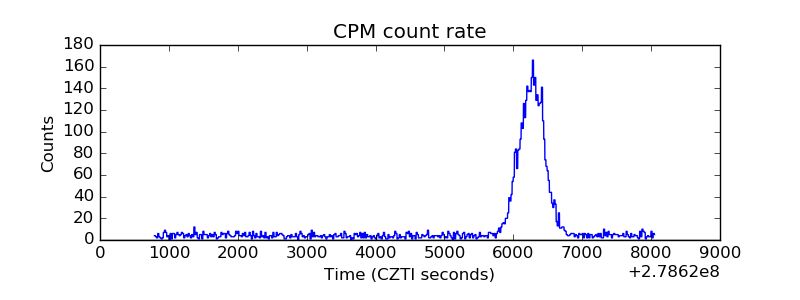 |
| CZT Counter | 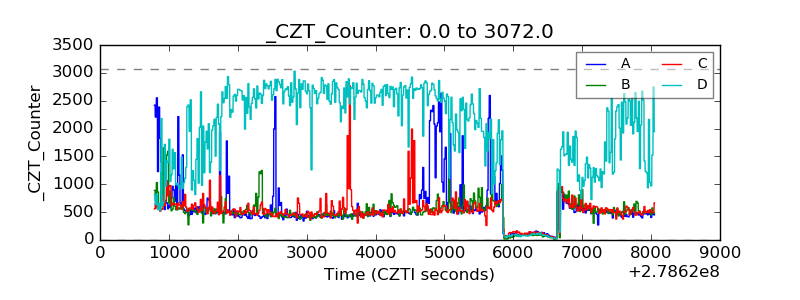 |
| +2.5 Volts monitor |  |
| +5 Volts monitor |  |
| _ROLL_ROT | 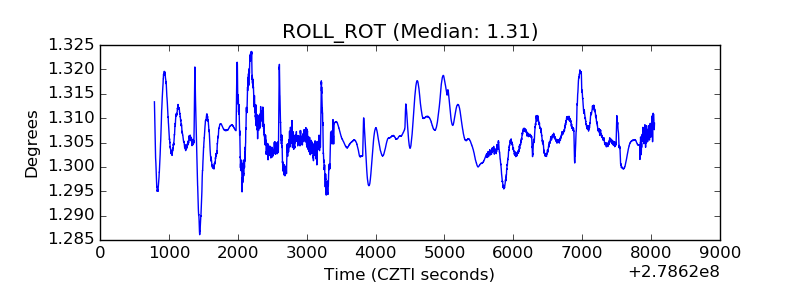 |
| _Roll_DEC | 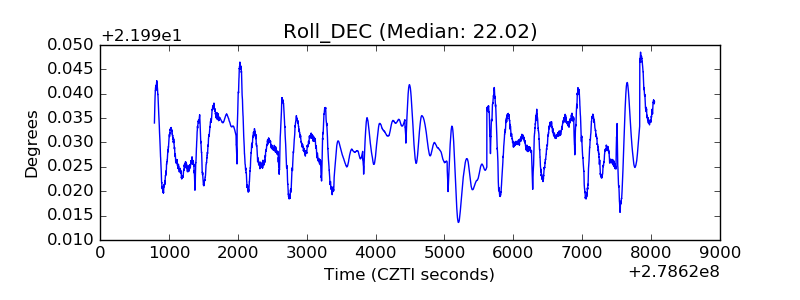 |
| _Roll_RA | 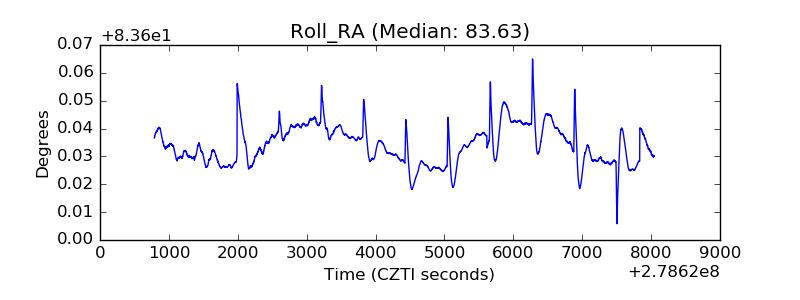 |
| Veto Counter | 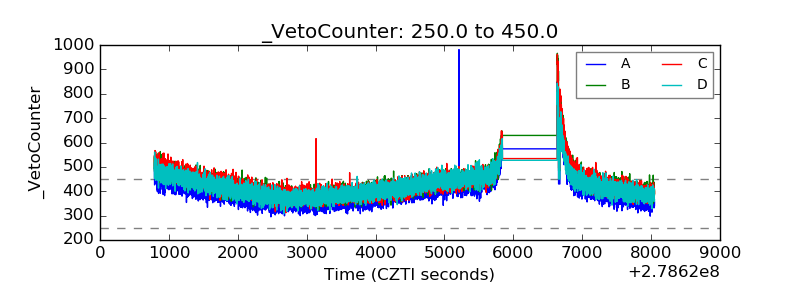 |