| Param | Original file | Final file |
|---|---|---|
| Filename | modeM0/AS1T03_024T01_9000002472_16707cztM0_level2.evt | modeM0/AS1T03_024T01_9000002472_16707cztM0_level2_quad_clean.evt |
| Size (bytes) | 918,544,320 | 103,222,080 |
| Size | 876.0 MB | 98.4 MB |
| Events in quadrant A | 4,316,287 | 726,292 |
| Events in quadrant B | 4,055,888 | 734,351 |
| Events in quadrant C | 3,991,017 | 709,382 |
| Events in quadrant D | 14,958,164 | 442,646 |
| Mode M9 | |||
|---|---|---|---|
| Quadrant | BADHDUFLAG | Total packets | Discarded packets |
| A | 0 | 4 | 0 |
| B | 0 | 4 | 0 |
| C | 0 | 4 | 0 |
| D | 0 | 5 | 0 |
| Mode M0 | |||
|---|---|---|---|
| Quadrant | BADHDUFLAG | Total packets | Discarded packets |
| A | 0 | 17720 | 3 |
| B | 0 | 16754 | 2 |
| C | 0 | 16639 | 2 |
| D | 0 | 49506 | 2 |
| Mode SS | |||
|---|---|---|---|
| Quadrant | BADHDUFLAG | Total packets | Discarded packets |
| A | 0 | 150 | 0 |
| B | 0 | 150 | 0 |
| C | 0 | 150 | 0 |
| D | 0 | 150 | 0 |
| Quadrant | Total seconds | Saturated seconds | Saturation percentage |
|---|---|---|---|
| A | 7351 | 375 | 5.101347% |
| B | 7351 | 192 | 2.611890% |
| C | 7351 | 192 | 2.611890% |
| D | 7351 | 4839 | 65.827779% |
Noise dominated data is calculated using 1-second bins in cleaned event files. If a bin has >2000 counts, and if more than 50% of those come from <1% of pixels, then it is considered to be noise-dominated and hence unusable.
| Quadrant | # 1 sec bins | Bins with >0 counts | Bins with >2000 counts | High rate bins dominated by noise | Noise dominated (total time) | Noise dominated (detector-on time) | Marked lightcurve |
|---|---|---|---|---|---|---|---|
| A | 7717 | 7354 | 112 | 112 | 1.45% | 1.52% | 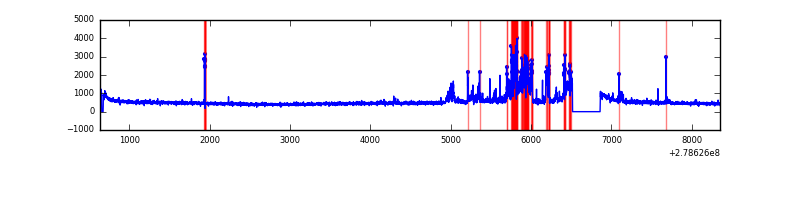 |
| B | 7717 | 7354 | 5 | 5 | 0.06% | 0.07% | 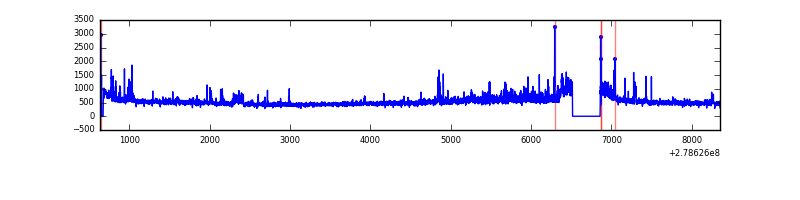 |
| C | 7717 | 7354 | 2 | 2 | 0.03% | 0.03% | 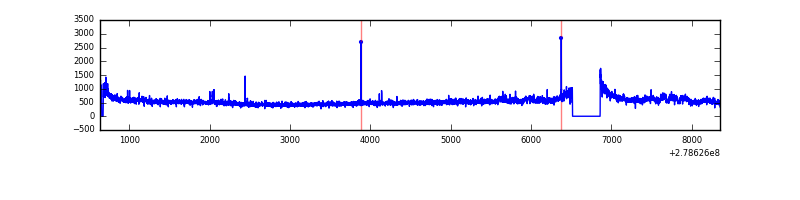 |
| D | 7717 | 7354 | 3741 | 3741 | 48.48% | 50.87% |  |
Top three noisy pixels from each quadrant. If the there are fewer than three noisy pixels in the level2.evt file, extra rows are filled as -1
| Pixel properties | Quadrant properties | ||||||
|---|---|---|---|---|---|---|---|
| Quadrant | DetID | PixID | Counts | Sigma | Mean | Median | Sigma |
| A | 15 | 174 | 724707 | 3828.57 | 922 | 903 | 189.1 |
| A | 4 | 2 | 22283 | 113.09 | 922 | 903 | 189.1 |
| A | 3 | 1 | 12787 | 62.86 | 922 | 903 | 189.1 |
| B | 15 | 35 | 130503 | 711.21 | 938 | 916 | 182.2 |
| B | 5 | 236 | 101795 | 553.65 | 938 | 916 | 182.2 |
| B | 0 | 229 | 37101 | 198.59 | 938 | 916 | 182.2 |
| C | 3 | 233 | 281330 | 1312.36 | 905 | 914 | 213.7 |
| C | 14 | 238 | 139903 | 650.48 | 905 | 914 | 213.7 |
| C | 0 | 207 | 33808 | 153.95 | 905 | 914 | 213.7 |
| D | 1 | 52 | 7920842 | 49239.39 | 654 | 637 | 160.9 |
| D | 2 | 16 | 4355359 | 27073.02 | 654 | 637 | 160.9 |
| D | 13 | 248 | 73508 | 453.03 | 654 | 637 | 160.9 |
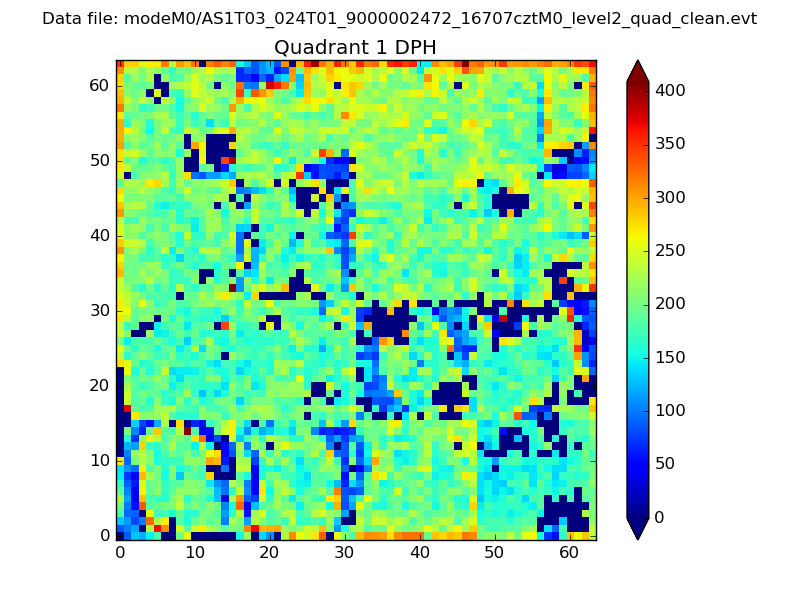
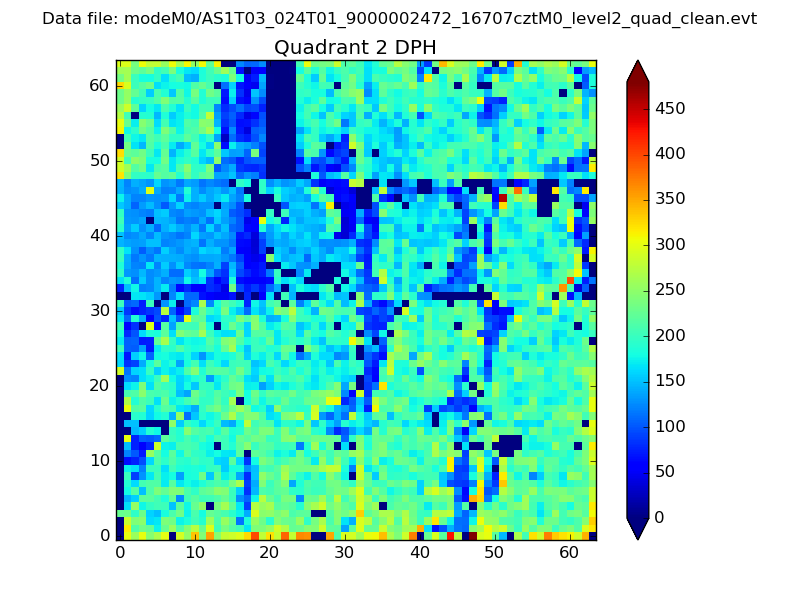
Histogram calculated using DETX and DETY for each event in the final _common_clean file
| Quadrant A | 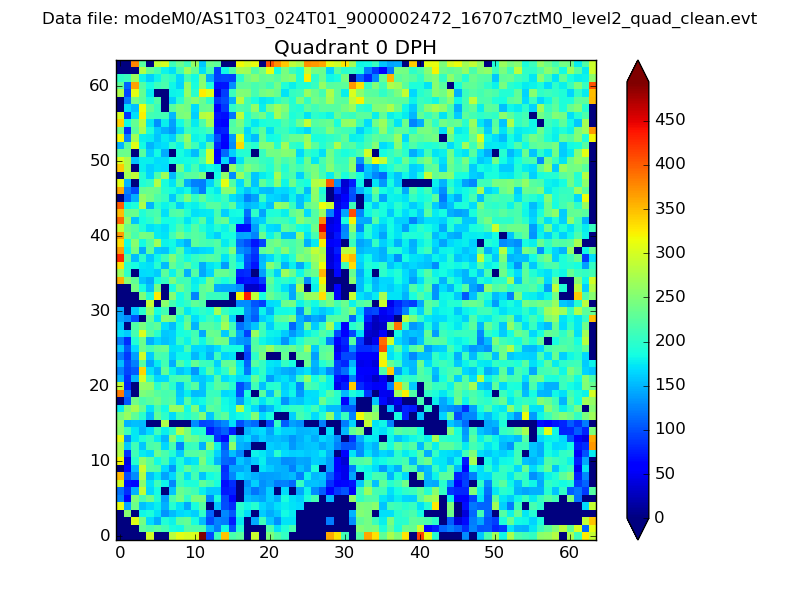 |
 |
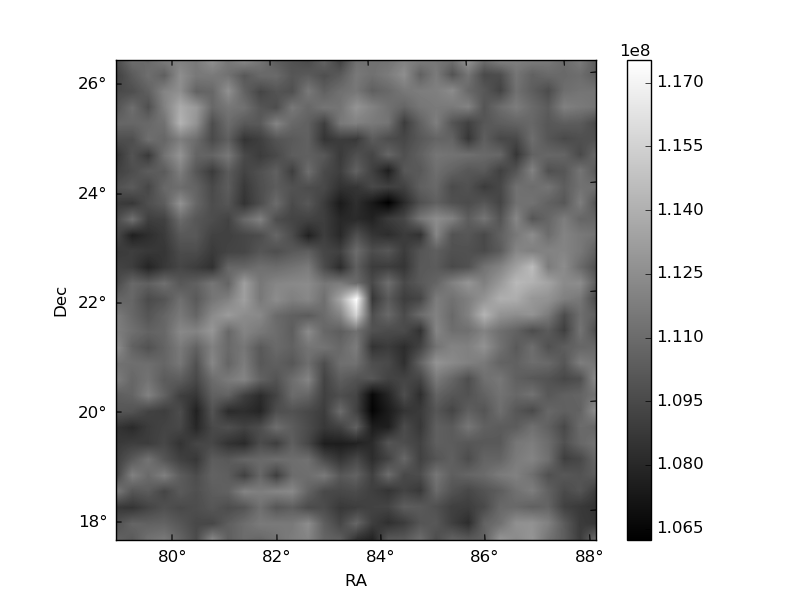
Quadrant B |
|---|---|---|---|
| Quadrant D | 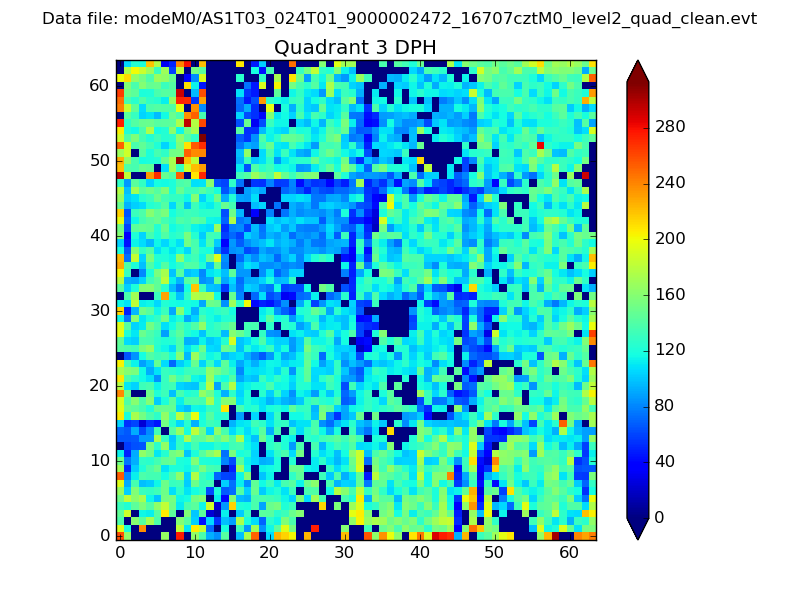 |
 |
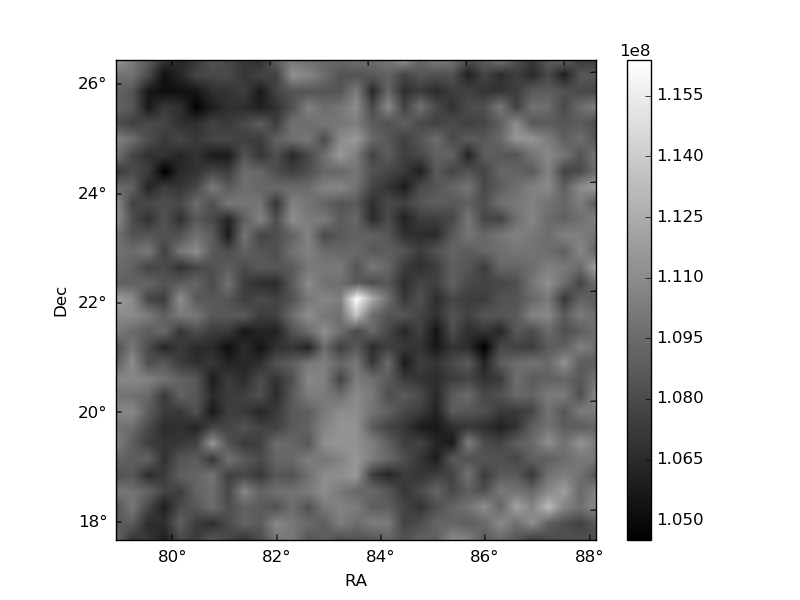
Quadrant C |
| Plot type | Count rate plots | Images |
|---|---|---|
| Comparison with Poisson distribution Blue bars denote a histogram of data divided into 1 sec bins. Red curve is a Poisson curve with rate = median count rate of data. |
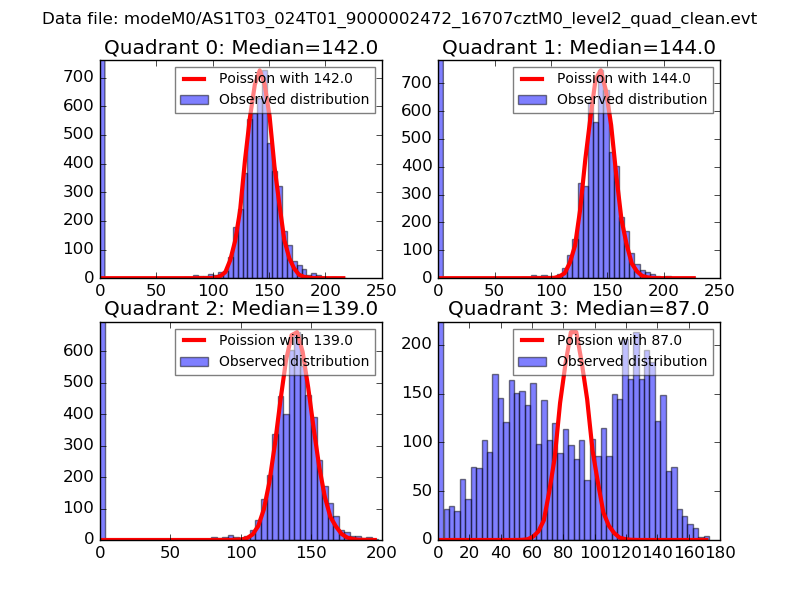 |
 |
| Quadrant-wise count rates Data is divided into 100 sec bins |
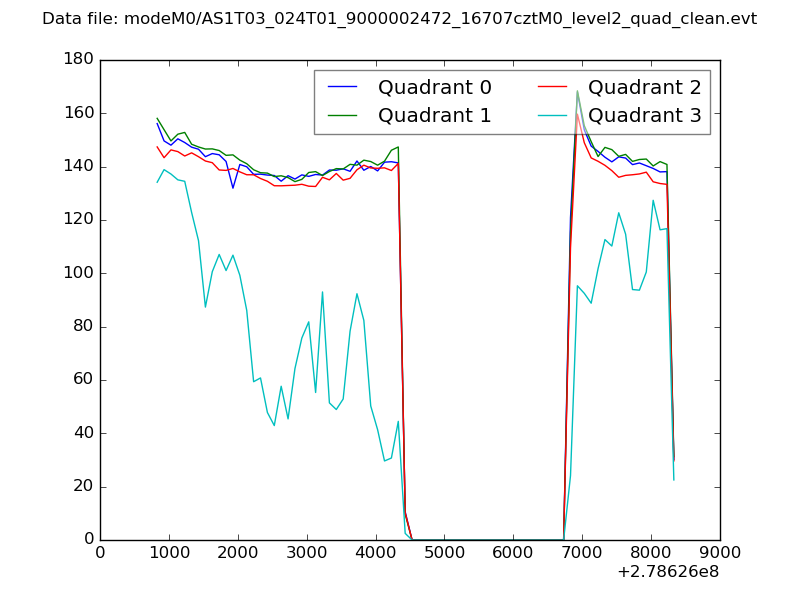 |
|
| Module-wise count rates for Quadrant A Data is divided into 100 sec bins |
 |
 |
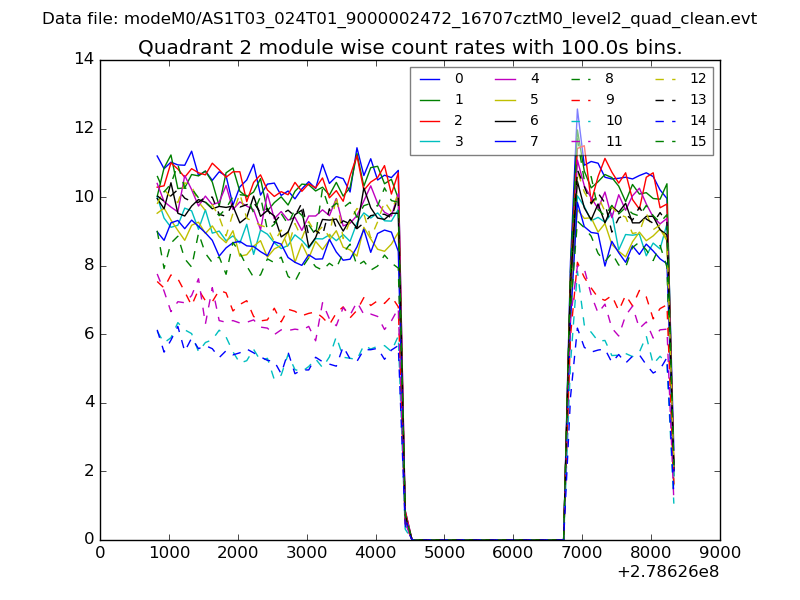
| Module-wise count rates for Quadrant B Data is divided into 100 sec bins |
 |
 |
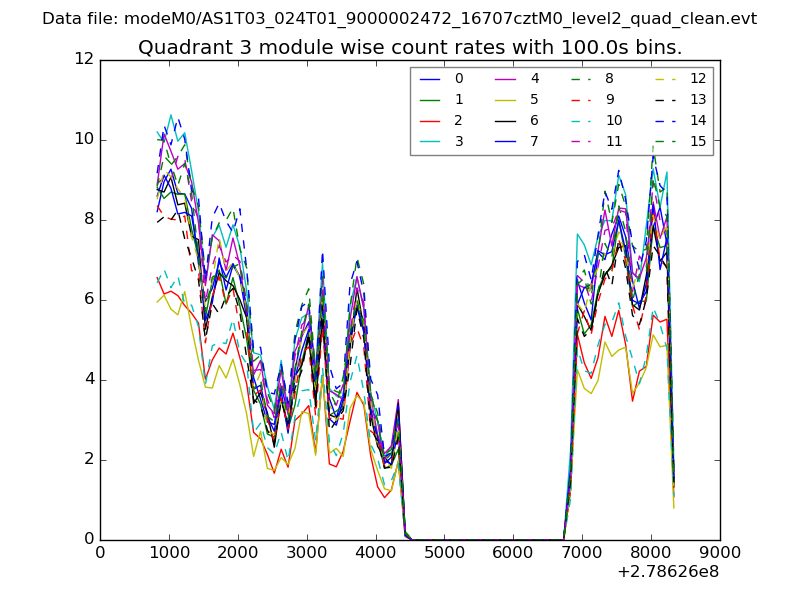
| Module-wise count rates for Quadrant C Data is divided into 100 sec bins |
 |
 |
| Module-wise count rates for Quadrant D Data is divided into 100 sec bins |
 |
 |
| Parameter | Plot |
|---|---|
| CZT HV Monitor |  |
| D_VDD | 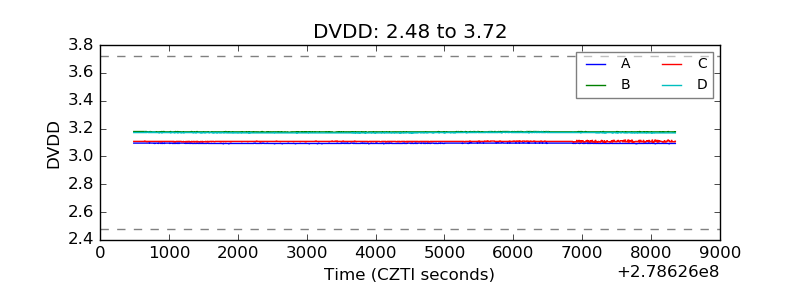 |
| Temperature 1 | 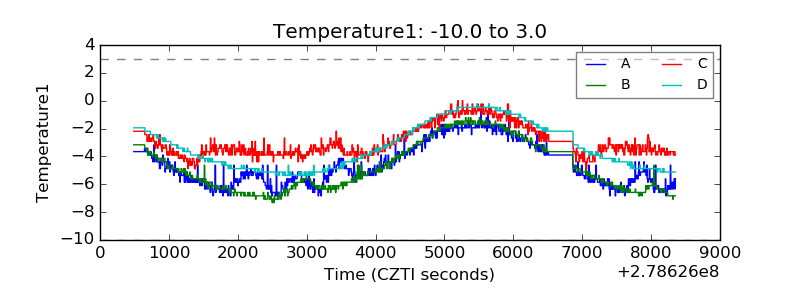 |
| Veto HV Monitor | 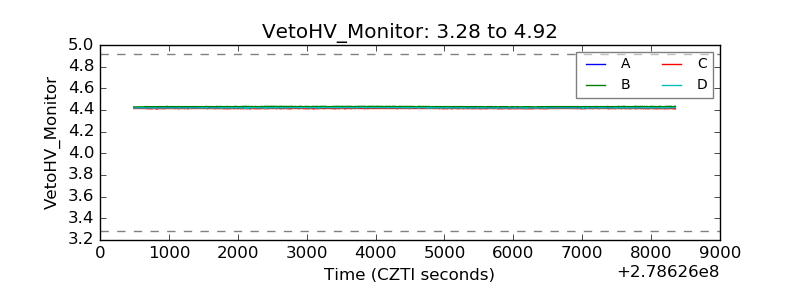 |
| Veto LLD | 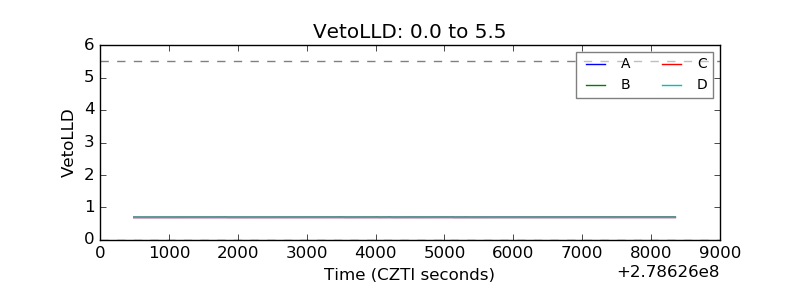 |
| Alpha Counter | 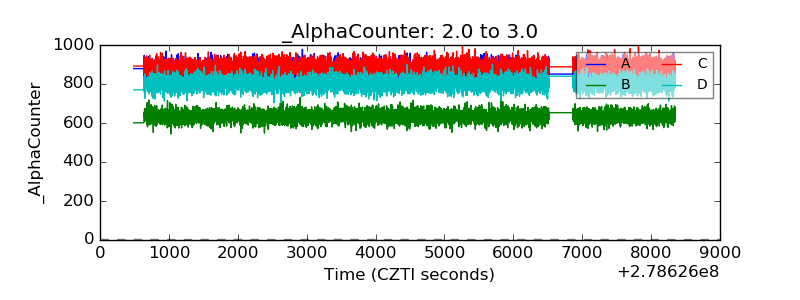 |
| _CPM_Rate | 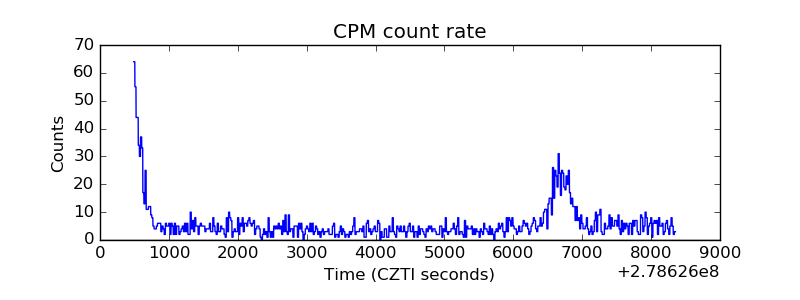 |
| CZT Counter | 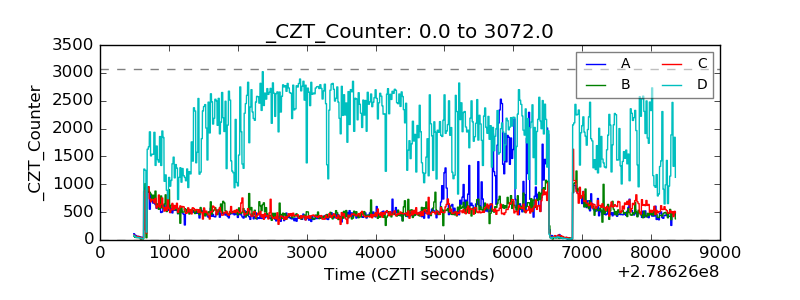 |
| +2.5 Volts monitor |  |
| +5 Volts monitor |  |
| _ROLL_ROT |  |
| _Roll_DEC | 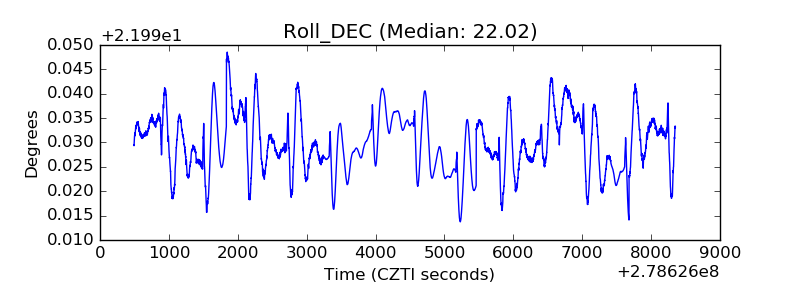 |
| _Roll_RA | 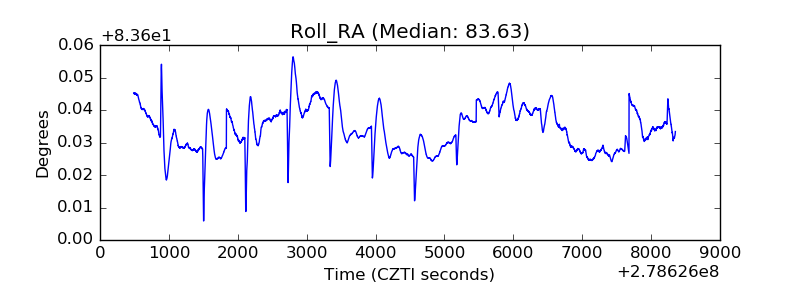 |
| Veto Counter | 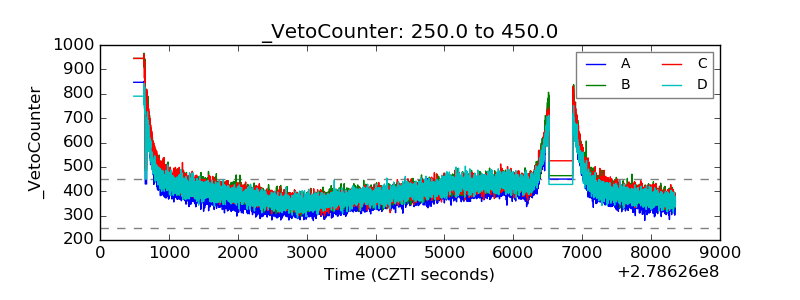 |