| Param | Original file | Final file |
|---|---|---|
| Filename | modeM0/AS1T03_024T01_9000002472_16709cztM0_level2.evt | modeM0/AS1T03_024T01_9000002472_16709cztM0_level2_quad_clean.evt |
| Size (bytes) | 761,834,880 | 107,712,000 |
| Size | 726.5 MB | 102.7 MB |
| Events in quadrant A | 4,445,207 | 713,089 |
| Events in quadrant B | 3,891,110 | 738,315 |
| Events in quadrant C | 4,179,719 | 701,765 |
| Events in quadrant D | 10,053,665 | 590,907 |
| Mode M9 | |||
|---|---|---|---|
| Quadrant | BADHDUFLAG | Total packets | Discarded packets |
| A | 0 | 2 | 0 |
| B | 0 | 2 | 1 |
| C | 0 | 2 | 0 |
| D | 0 | 2 | 0 |
| Mode M0 | |||
|---|---|---|---|
| Quadrant | BADHDUFLAG | Total packets | Discarded packets |
| A | 0 | 18803 | 726 |
| B | 0 | 16997 | 757 |
| C | 0 | 17897 | 733 |
| D | 0 | 36725 | 1668 |
| Mode SS | |||
|---|---|---|---|
| Quadrant | BADHDUFLAG | Total packets | Discarded packets |
| A | 0 | 160 | 8 |
| B | 0 | 160 | 6 |
| C | 0 | 160 | 6 |
| D | 0 | 160 | 6 |
| Quadrant | Total seconds | Saturated seconds | Saturation percentage |
|---|---|---|---|
| A | 7444 | 293 | 3.936056% |
| B | 7424 | 196 | 2.640086% |
| C | 7447 | 343 | 4.605882% |
| D | 7371 | 2128 | 28.869896% |
Noise dominated data is calculated using 1-second bins in cleaned event files. If a bin has >2000 counts, and if more than 50% of those come from <1% of pixels, then it is considered to be noise-dominated and hence unusable.
| Quadrant | # 1 sec bins | Bins with >0 counts | Bins with >2000 counts | High rate bins dominated by noise | Noise dominated (total time) | Noise dominated (detector-on time) | Marked lightcurve |
|---|---|---|---|---|---|---|---|
| A | 8007 | 7562 | 141 | 141 | 1.76% | 1.86% | 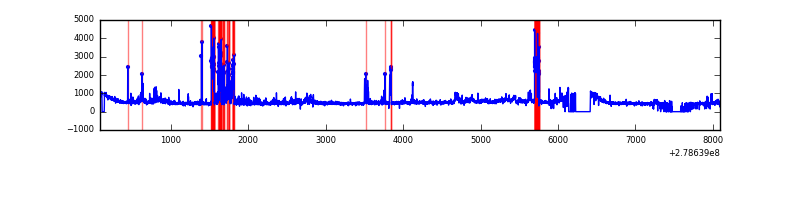 |
| B | 8007 | 7541 | 2 | 2 | 0.02% | 0.03% | 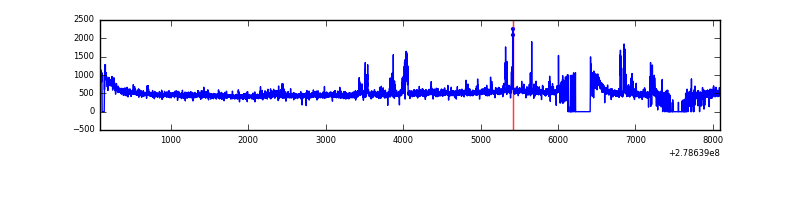 |
| C | 8007 | 7575 | 113 | 113 | 1.41% | 1.49% | 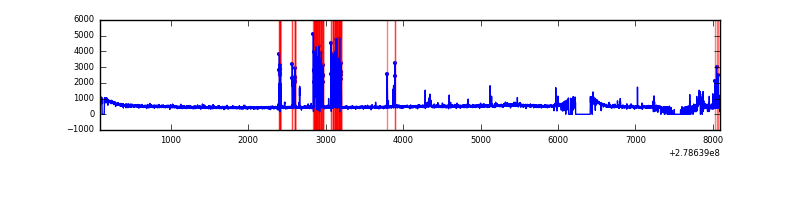 |
| D | 8007 | 7517 | 1447 | 1447 | 18.07% | 19.25% | 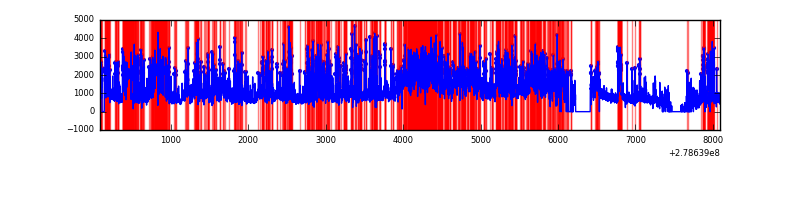 |
Top three noisy pixels from each quadrant. If the there are fewer than three noisy pixels in the level2.evt file, extra rows are filled as -1
| Pixel properties | Quadrant properties | ||||||
|---|---|---|---|---|---|---|---|
| Quadrant | DetID | PixID | Counts | Sigma | Mean | Median | Sigma |
| A | 15 | 174 | 568394 | 3000.27 | 920 | 903 | 189.1 |
| A | 10 | 234 | 312382 | 1646.76 | 920 | 903 | 189.1 |
| A | 9 | 143 | 15424 | 76.77 | 920 | 903 | 189.1 |
| B | 15 | 35 | 116700 | 639.63 | 932 | 911 | 181.0 |
| B | 5 | 236 | 37997 | 204.87 | 932 | 911 | 181.0 |
| B | 0 | 189 | 25553 | 136.12 | 932 | 911 | 181.0 |
| C | 0 | 207 | 493555 | 2342.85 | 887 | 895 | 210.3 |
| C | 14 | 238 | 136410 | 644.44 | 887 | 895 | 210.3 |
| C | 3 | 233 | 72190 | 339.04 | 887 | 895 | 210.3 |
| D | 1 | 52 | 4593164 | 23588.84 | 783 | 761 | 194.7 |
| D | 2 | 16 | 2041547 | 10482.48 | 783 | 761 | 194.7 |
| D | 12 | 110 | 310912 | 1593.09 | 783 | 761 | 194.7 |
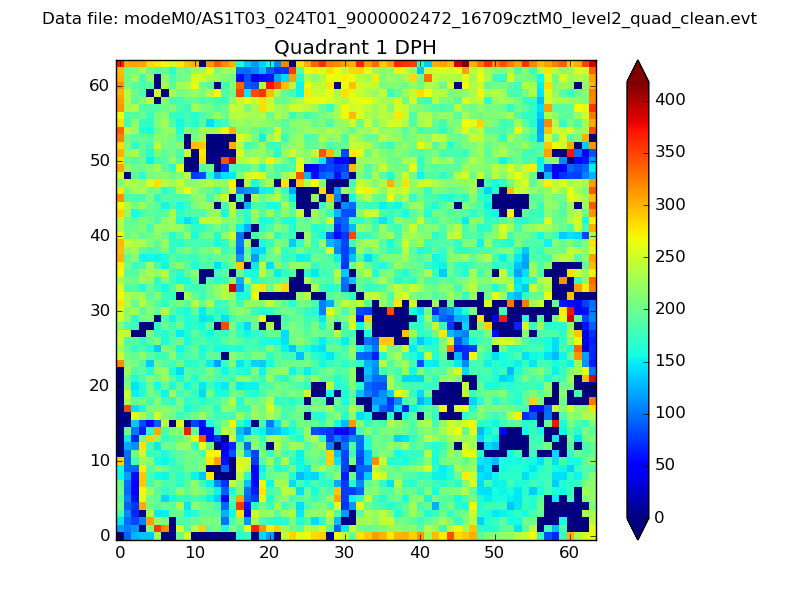
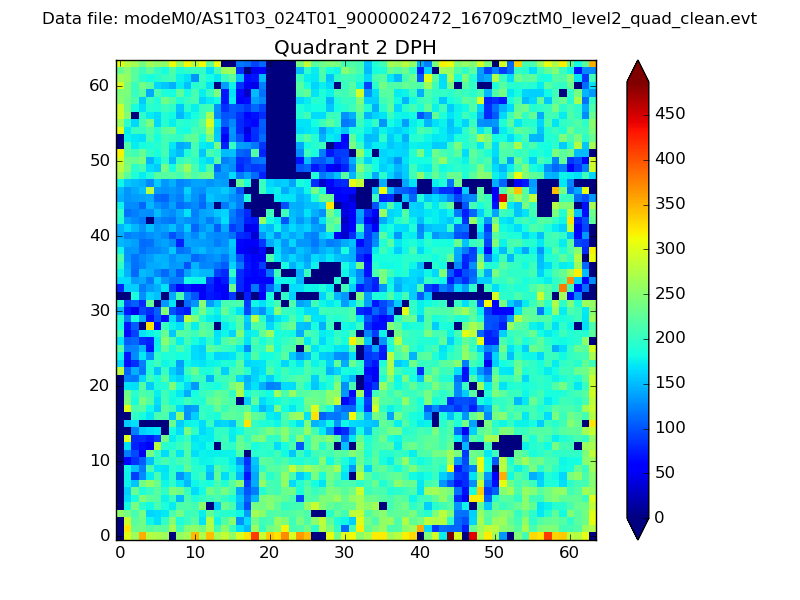
Histogram calculated using DETX and DETY for each event in the final _common_clean file
| Quadrant A |  |
 |
Quadrant B |
|---|---|---|---|
| Quadrant D |  |
 |
Quadrant C |
| Plot type | Count rate plots | Images |
|---|---|---|
| Comparison with Poisson distribution Blue bars denote a histogram of data divided into 1 sec bins. Red curve is a Poisson curve with rate = median count rate of data. |
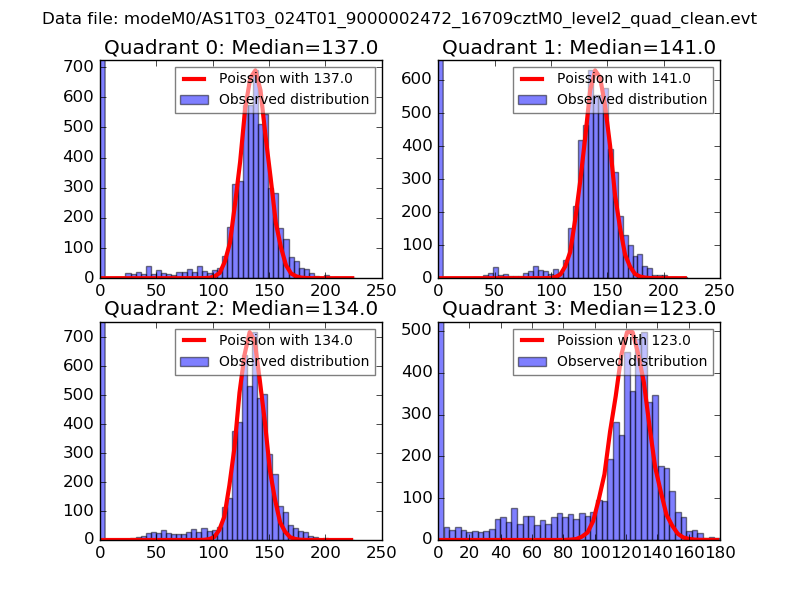 |
 |
| Quadrant-wise count rates Data is divided into 100 sec bins |
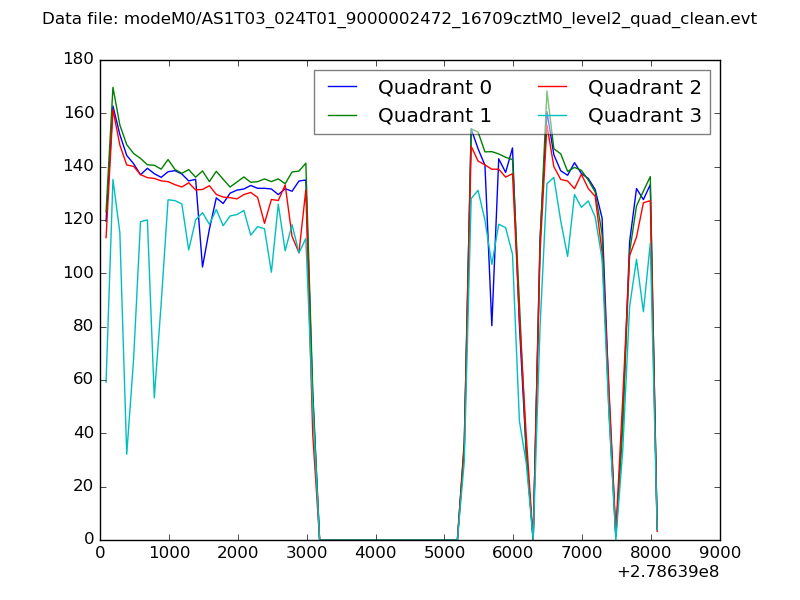 |
|
| Module-wise count rates for Quadrant A Data is divided into 100 sec bins |
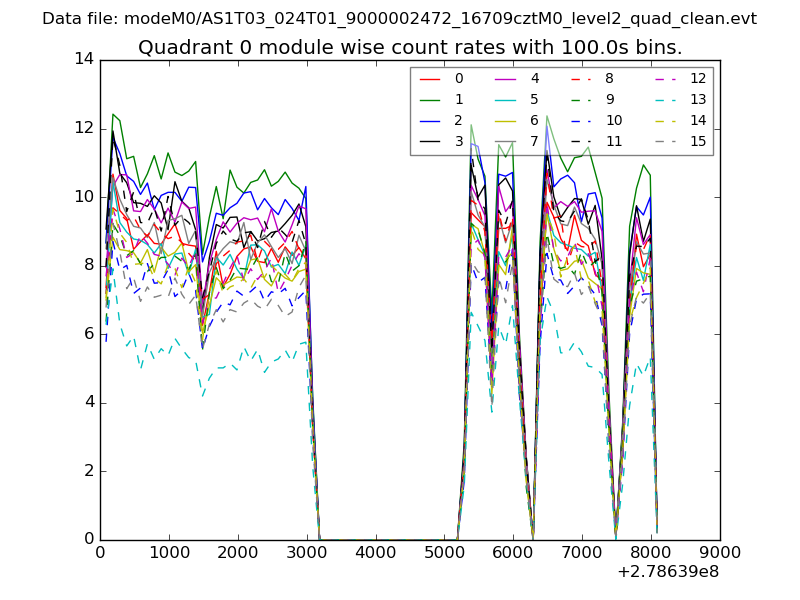 |
 |
| Module-wise count rates for Quadrant B Data is divided into 100 sec bins |
 |
 |
| Module-wise count rates for Quadrant C Data is divided into 100 sec bins |
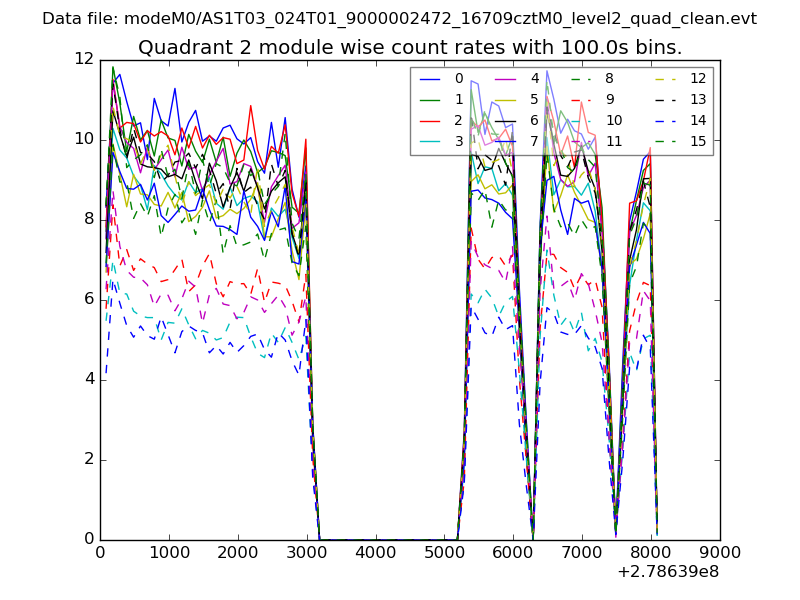 |
 |
| Module-wise count rates for Quadrant D Data is divided into 100 sec bins |
 |
 |
| Parameter | Plot |
|---|---|
| CZT HV Monitor | 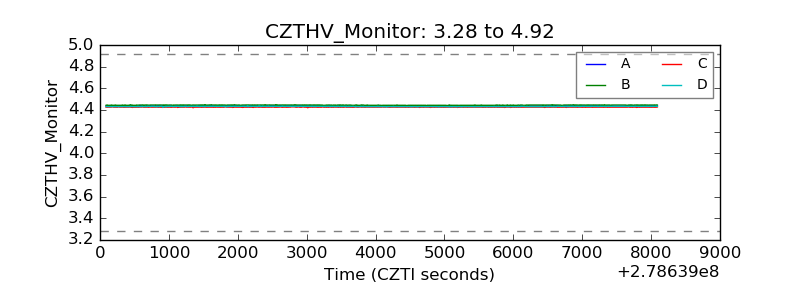 |
| D_VDD | 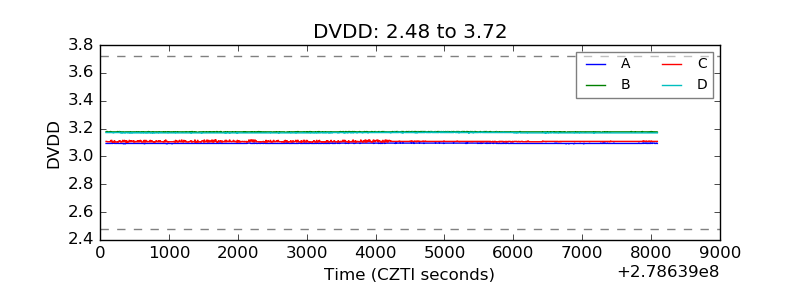 |
| Temperature 1 | 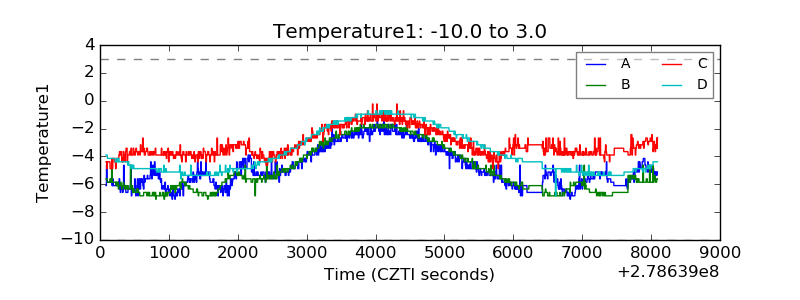 |
| Veto HV Monitor | 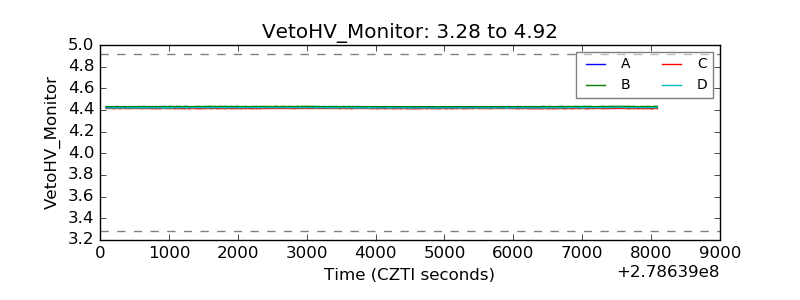 |
| Veto LLD |  |
| Alpha Counter | 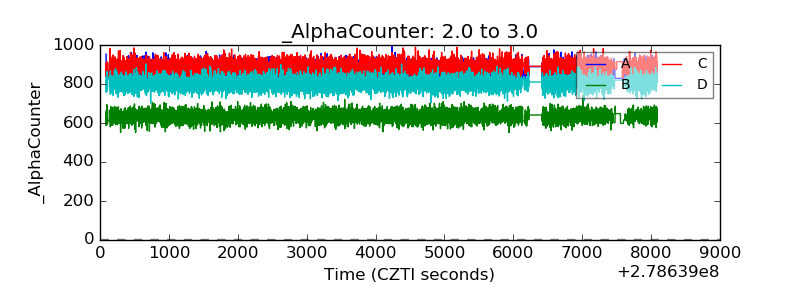 |
| _CPM_Rate | 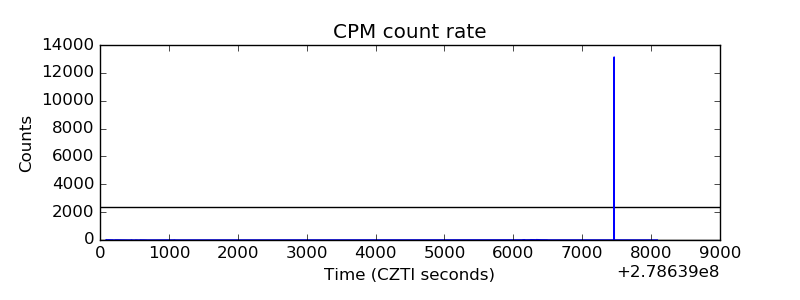 |
| CZT Counter |  |
| +2.5 Volts monitor | 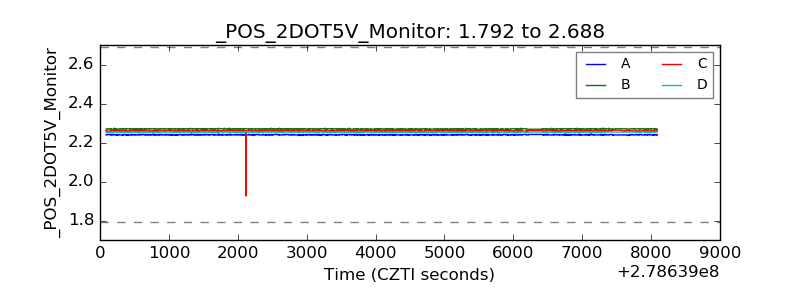 |
| +5 Volts monitor |  |
| _ROLL_ROT | 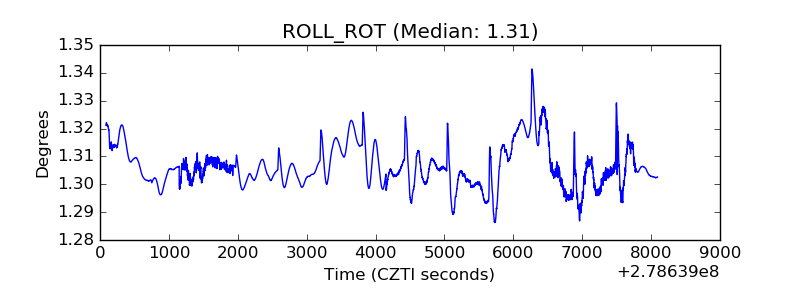 |
| _Roll_DEC | 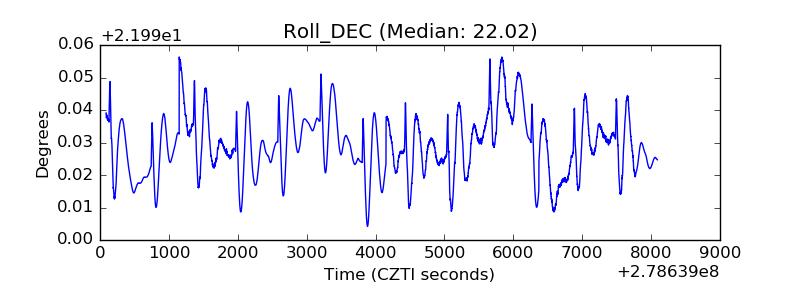 |
| _Roll_RA | 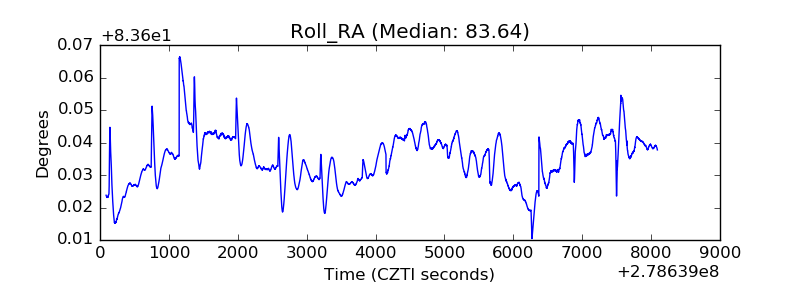 |
| Veto Counter | 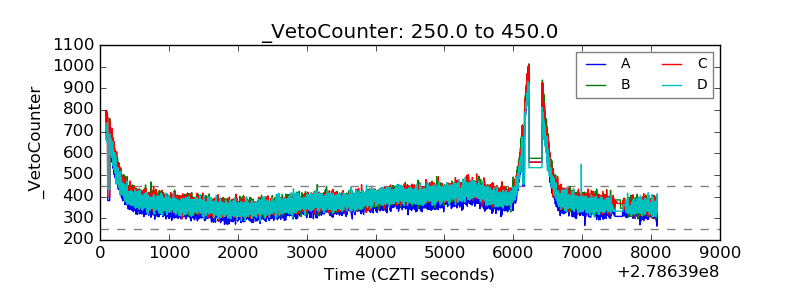 |