| Param | Original file | Final file |
|---|---|---|
| Filename | modeM0/AS1T03_024T01_9000002472_16711cztM0_level2.evt | modeM0/AS1T03_024T01_9000002472_16711cztM0_level2_quad_clean.evt |
| Size (bytes) | 1,191,867,840 | 185,106,240 |
| Size | 1.1 GB | 176.5 MB |
| Events in quadrant A | 6,813,924 | 1,206,961 |
| Events in quadrant B | 7,087,141 | 1,228,543 |
| Events in quadrant C | 6,890,253 | 1,183,304 |
| Events in quadrant D | 14,418,741 | 1,079,118 |
| Mode M9 | |||
|---|---|---|---|
| Quadrant | BADHDUFLAG | Total packets | Discarded packets |
| A | 0 | 14 | 0 |
| B | 0 | 14 | 0 |
| C | 0 | 14 | 0 |
| D | 0 | 14 | 0 |
| Mode M0 | |||
|---|---|---|---|
| Quadrant | BADHDUFLAG | Total packets | Discarded packets |
| A | 0 | 28592 | 5 |
| B | 0 | 29342 | 4 |
| C | 0 | 28569 | 4 |
| D | 0 | 52232 | 4 |
| Mode SS | |||
|---|---|---|---|
| Quadrant | BADHDUFLAG | Total packets | Discarded packets |
| A | 0 | 268 | 0 |
| B | 0 | 268 | 0 |
| C | 0 | 268 | 0 |
| D | 0 | 268 | 0 |
| Quadrant | Total seconds | Saturated seconds | Saturation percentage |
|---|---|---|---|
| A | 13142 | 303 | 2.305585% |
| B | 13142 | 312 | 2.374068% |
| C | 13142 | 305 | 2.320804% |
| D | 13142 | 1577 | 11.999696% |
Noise dominated data is calculated using 1-second bins in cleaned event files. If a bin has >2000 counts, and if more than 50% of those come from <1% of pixels, then it is considered to be noise-dominated and hence unusable.
| Quadrant | # 1 sec bins | Bins with >0 counts | Bins with >2000 counts | High rate bins dominated by noise | Noise dominated (total time) | Noise dominated (detector-on time) | Marked lightcurve |
|---|---|---|---|---|---|---|---|
| A | 14498 | 13146 | 56 | 56 | 0.39% | 0.43% | 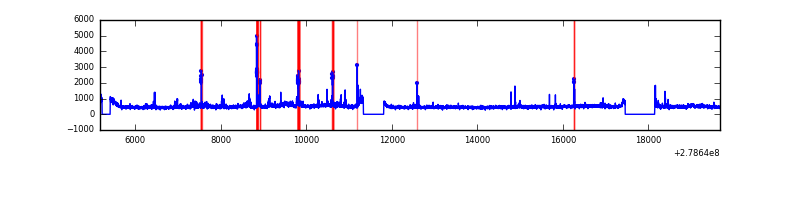 |
| B | 14498 | 13146 | 19 | 19 | 0.13% | 0.14% | 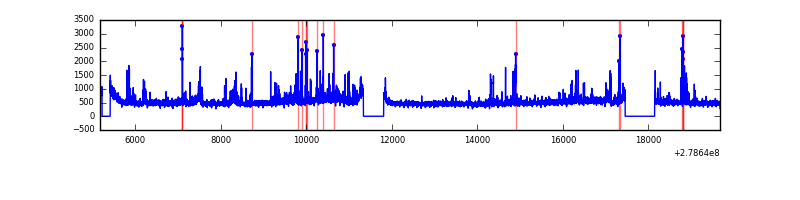 |
| C | 14498 | 13146 | 24 | 24 | 0.17% | 0.18% | 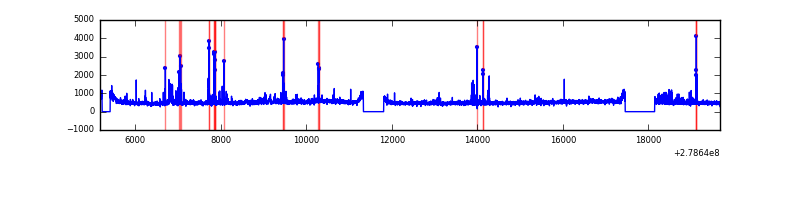 |
| D | 14498 | 13146 | 1090 | 1090 | 7.52% | 8.29% | 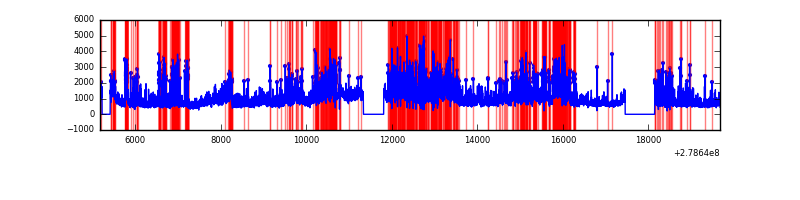 |
Top three noisy pixels from each quadrant. If the there are fewer than three noisy pixels in the level2.evt file, extra rows are filled as -1
| Pixel properties | Quadrant properties | ||||||
|---|---|---|---|---|---|---|---|
| Quadrant | DetID | PixID | Counts | Sigma | Mean | Median | Sigma |
| A | 15 | 174 | 516616 | 1568.42 | 1620 | 1590 | 328.4 |
| A | 9 | 143 | 56044 | 165.83 | 1620 | 1590 | 328.4 |
| A | 0 | 226 | 14229 | 38.49 | 1620 | 1590 | 328.4 |
| B | 15 | 35 | 279457 | 891.64 | 1623 | 1591 | 311.6 |
| B | 10 | 16 | 258386 | 824.03 | 1623 | 1591 | 311.6 |
| B | 5 | 236 | 70112 | 219.88 | 1623 | 1591 | 311.6 |
| C | 0 | 207 | 278305 | 758.38 | 1555 | 1571 | 364.9 |
| C | 14 | 238 | 239219 | 651.27 | 1555 | 1571 | 364.9 |
| C | 3 | 233 | 176028 | 478.09 | 1555 | 1571 | 364.9 |
| D | 2 | 16 | 4654486 | 12480.85 | 1512 | 1471 | 372.8 |
| D | 1 | 52 | 2345159 | 6286.51 | 1512 | 1471 | 372.8 |
| D | 5 | 222 | 827522 | 2215.73 | 1512 | 1471 | 372.8 |
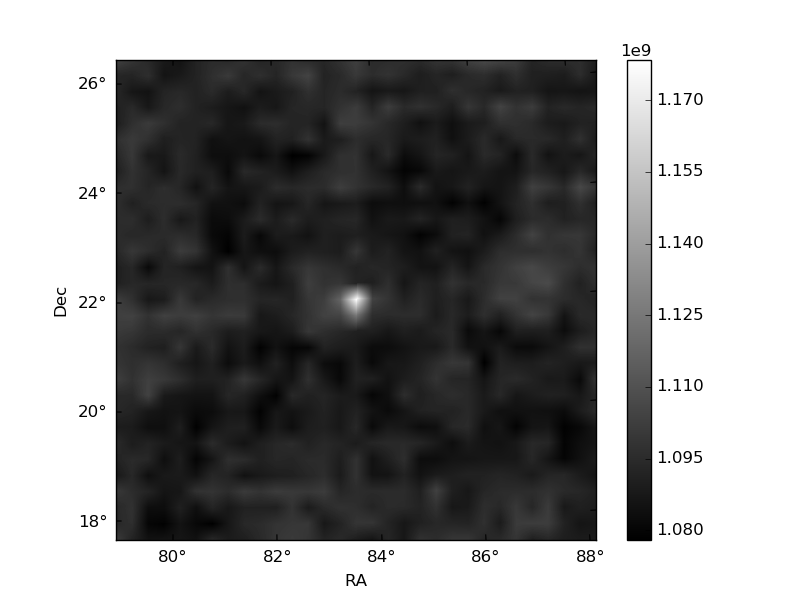
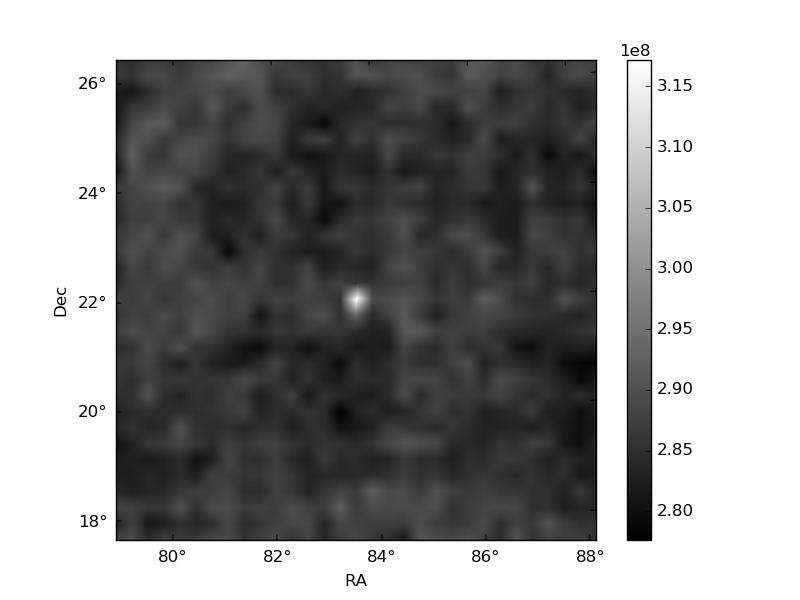
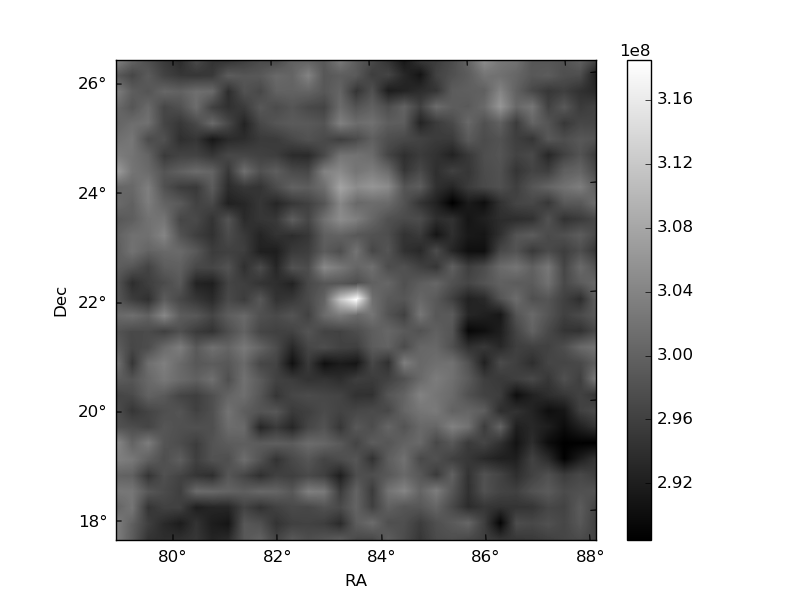
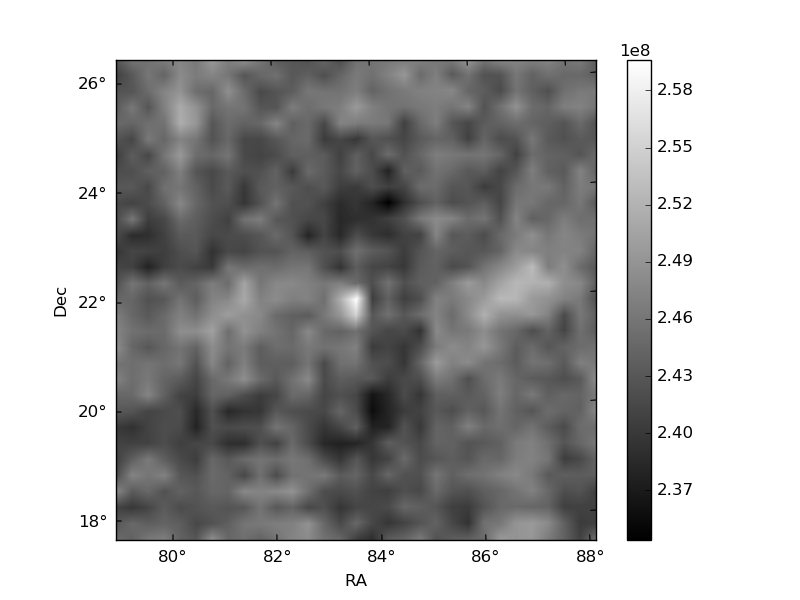
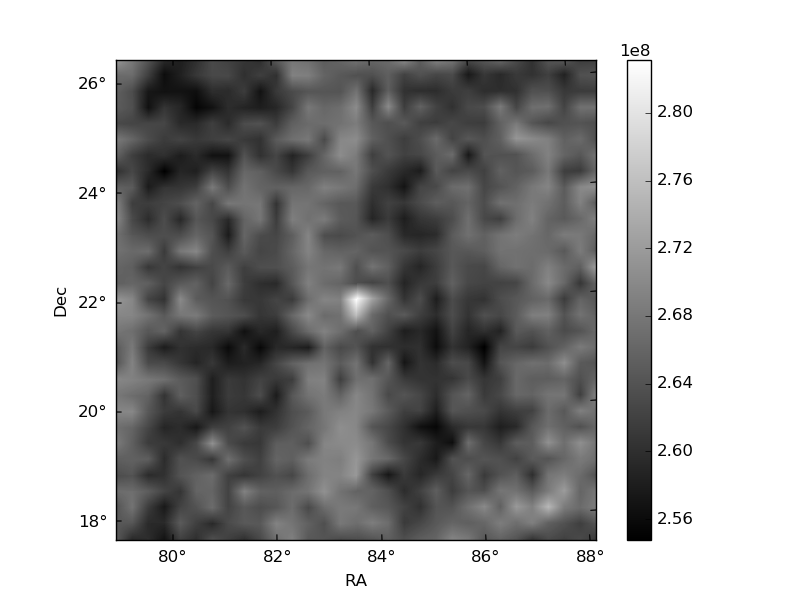
Histogram calculated using DETX and DETY for each event in the final _common_clean file
| Quadrant A | 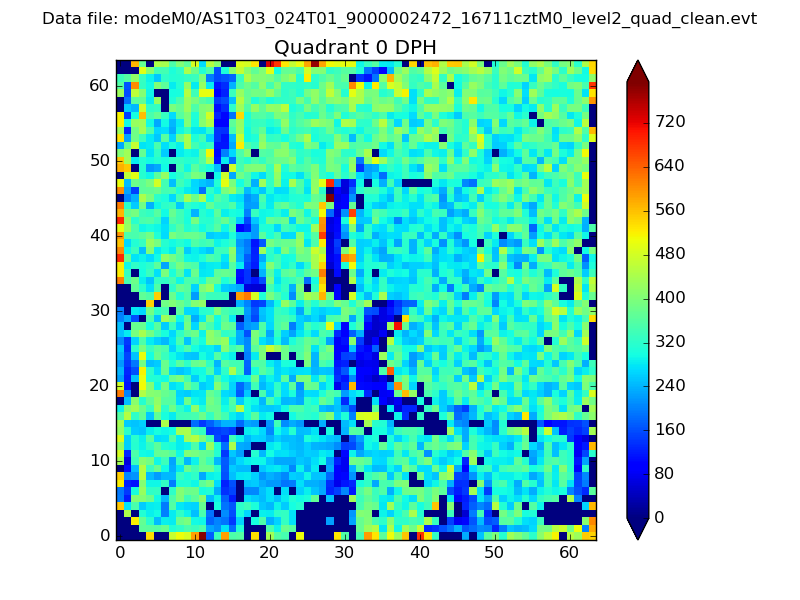 |
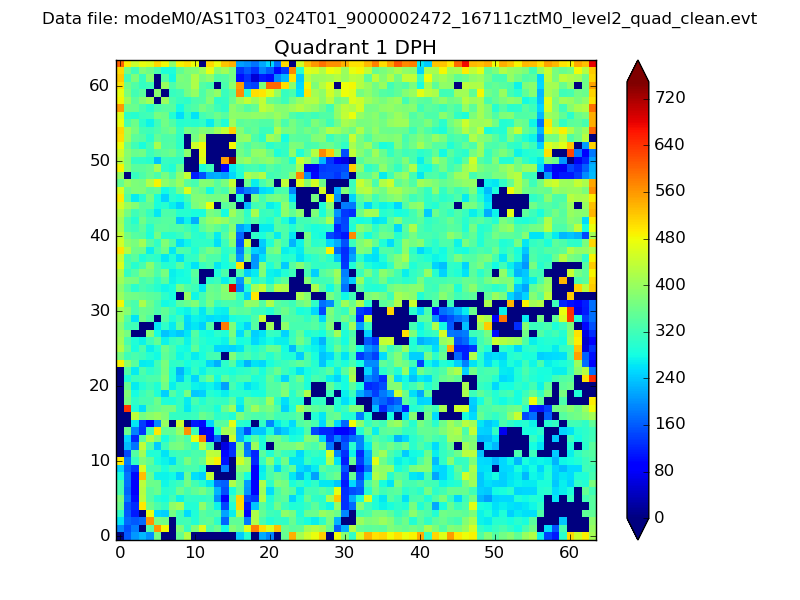 |
Quadrant B |
|---|---|---|---|
| Quadrant D | 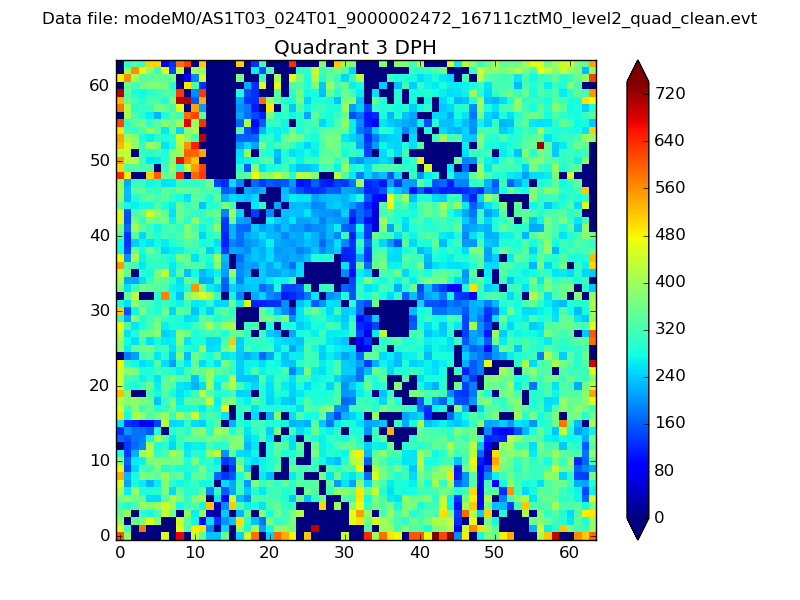 |
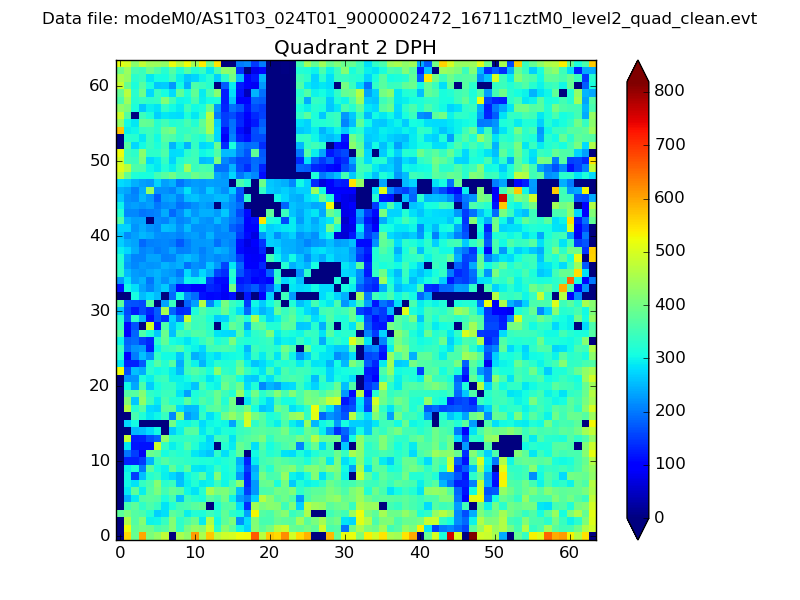 |
Quadrant C |
| Plot type | Count rate plots | Images |
|---|---|---|
| Comparison with Poisson distribution Blue bars denote a histogram of data divided into 1 sec bins. Red curve is a Poisson curve with rate = median count rate of data. |
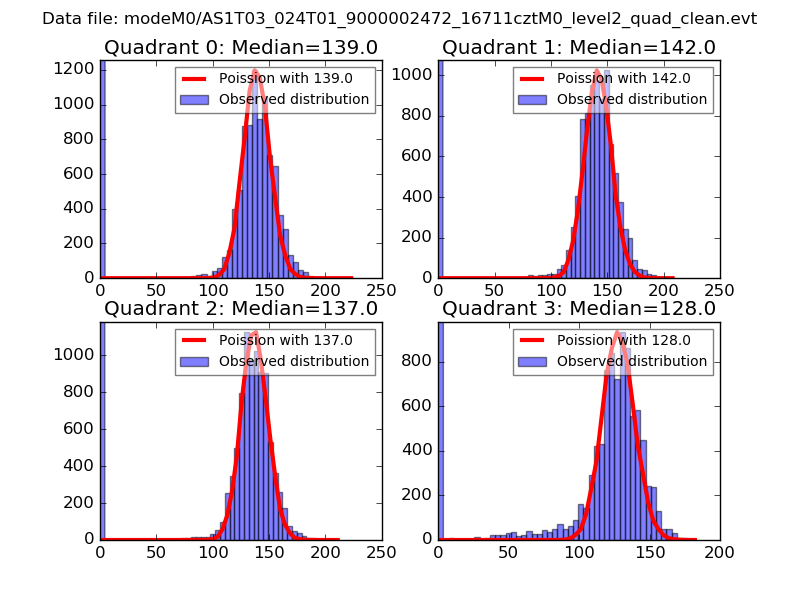 |
 |
| Quadrant-wise count rates Data is divided into 100 sec bins |
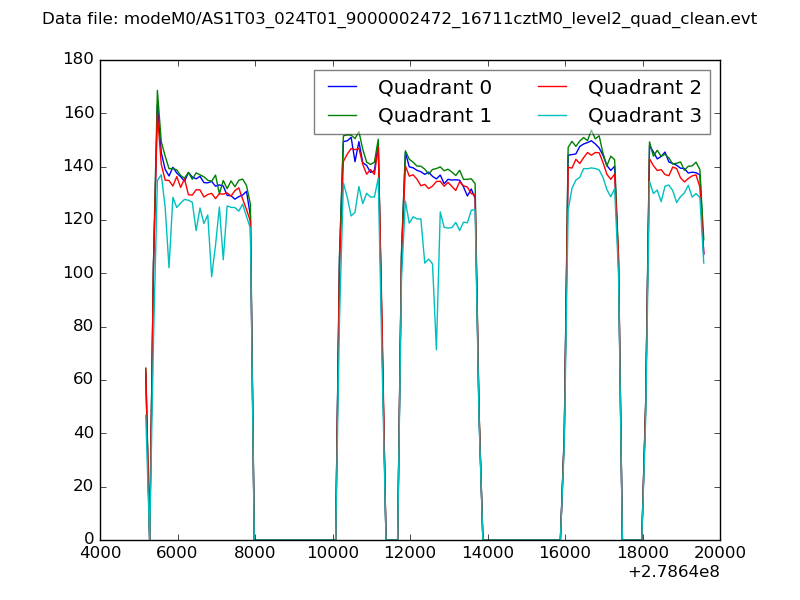 |
|
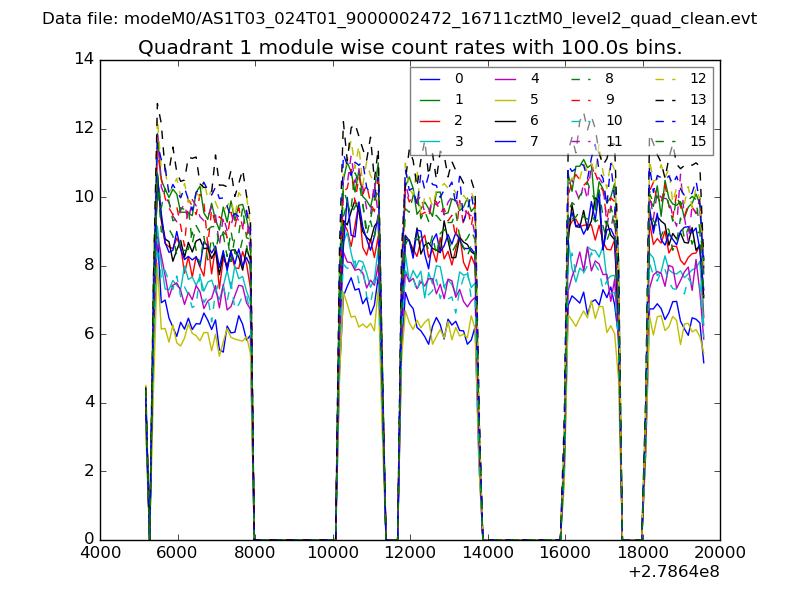
| Module-wise count rates for Quadrant A Data is divided into 100 sec bins |
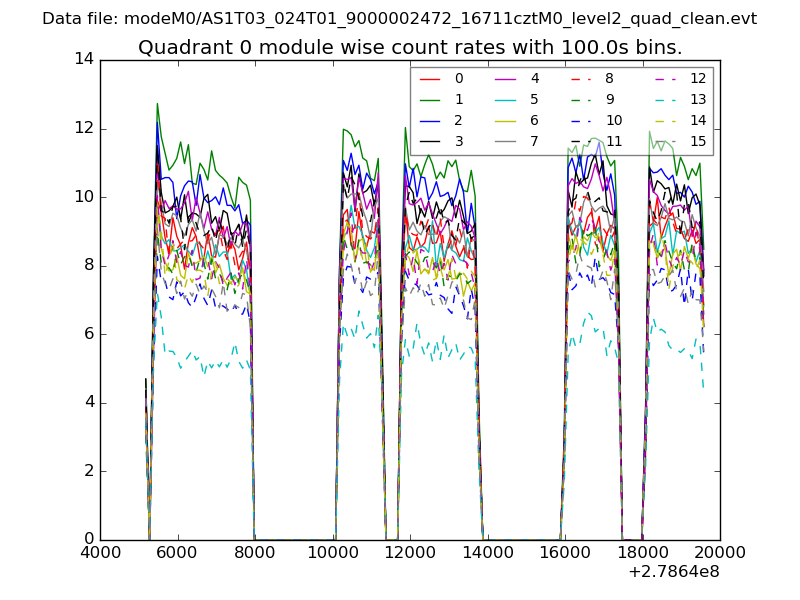 |
 |
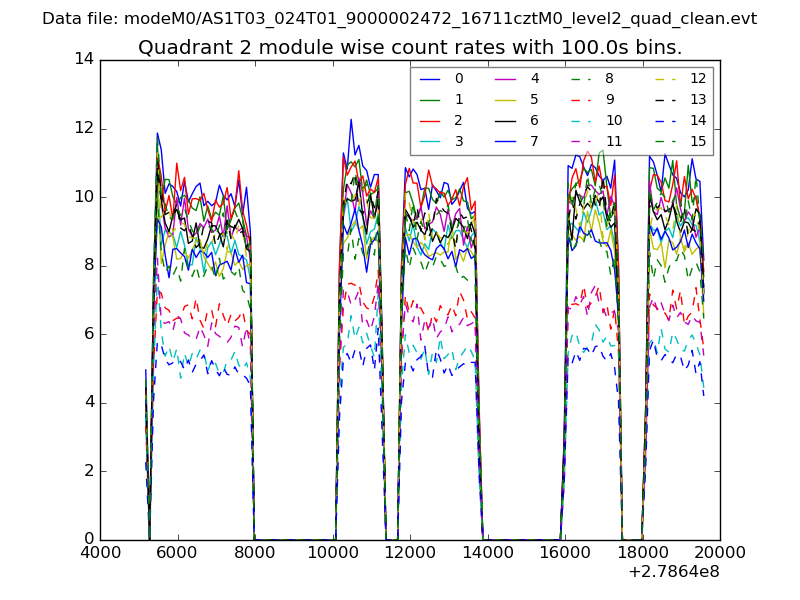
| Module-wise count rates for Quadrant B Data is divided into 100 sec bins |
 |
 |
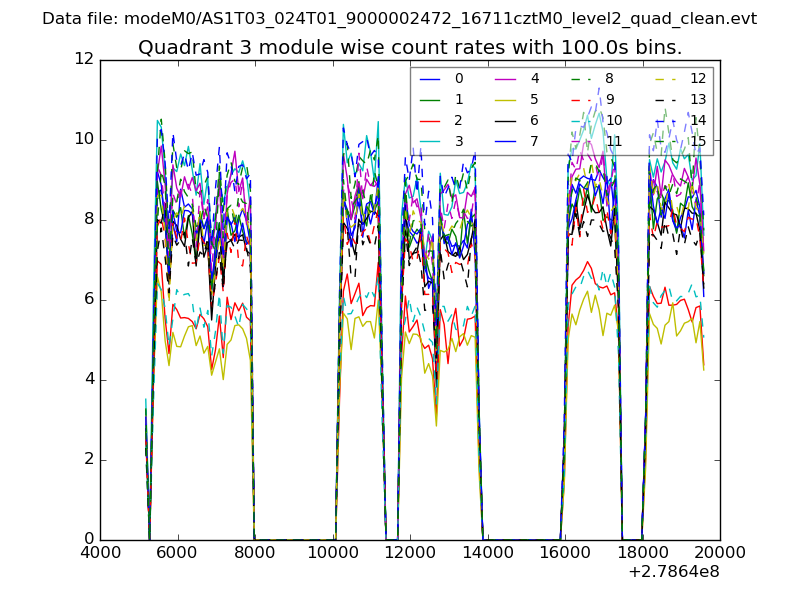
| Module-wise count rates for Quadrant C Data is divided into 100 sec bins |
 |
 |
| Module-wise count rates for Quadrant D Data is divided into 100 sec bins |
 |
 |
| Parameter | Plot |
|---|---|
| CZT HV Monitor | 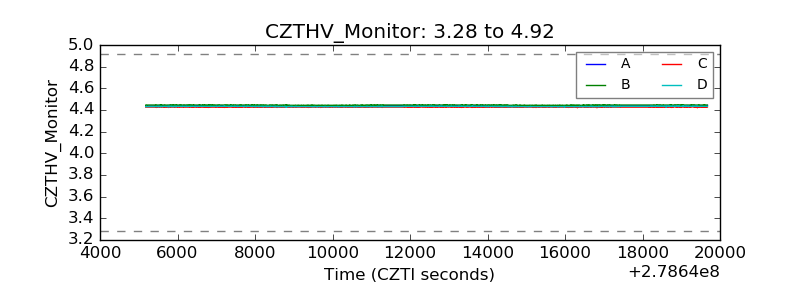 |
| D_VDD | 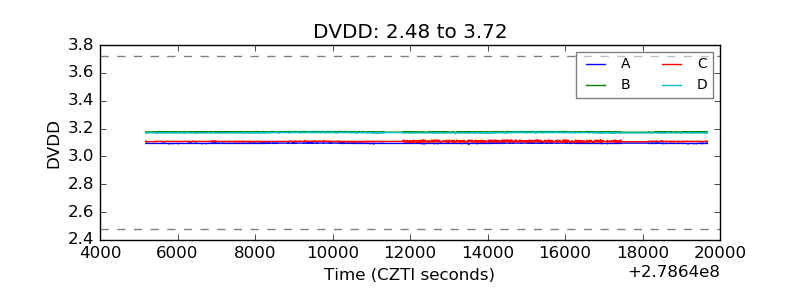 |
| Temperature 1 | 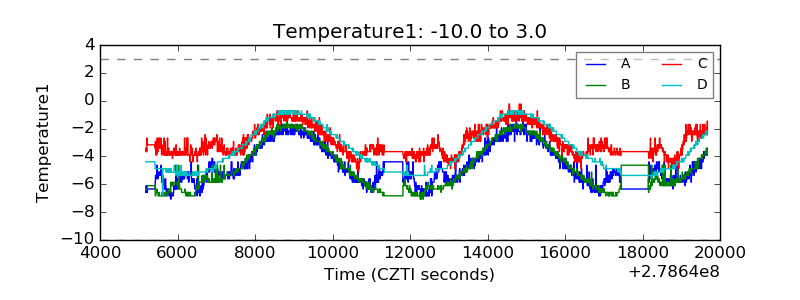 |
| Veto HV Monitor | 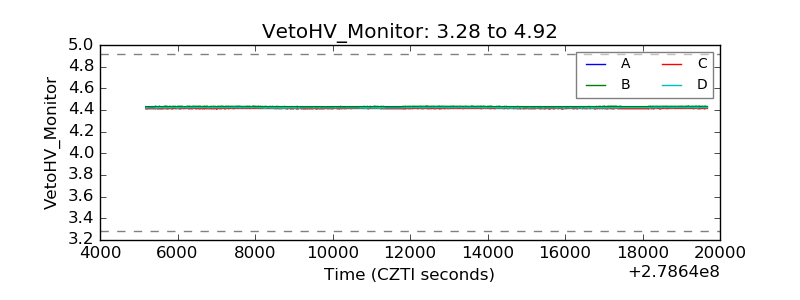 |
| Veto LLD | 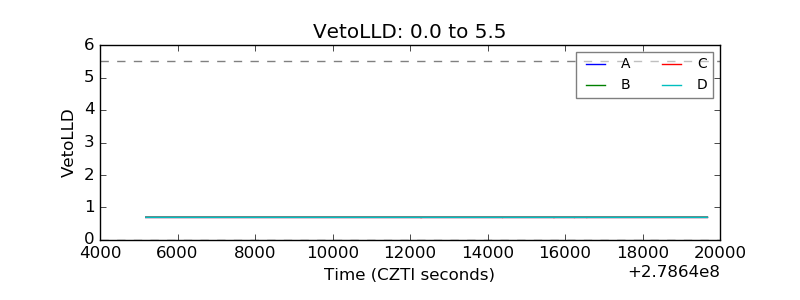 |
| Alpha Counter | 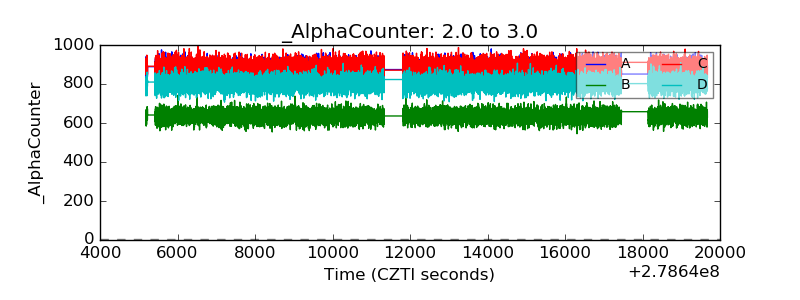 |
| _CPM_Rate | 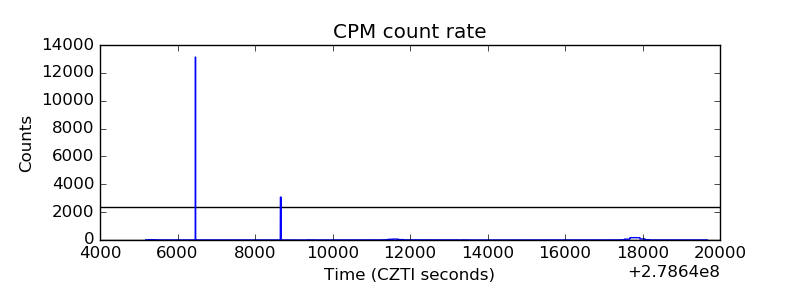 |
| CZT Counter | 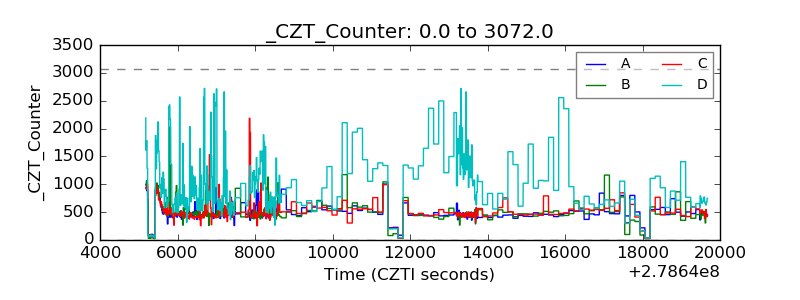 |
| +2.5 Volts monitor | 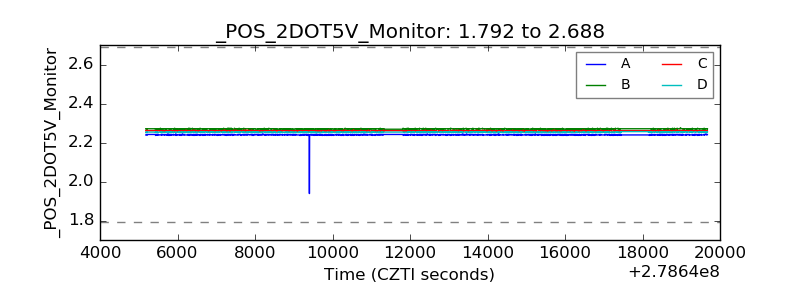 |
| +5 Volts monitor | 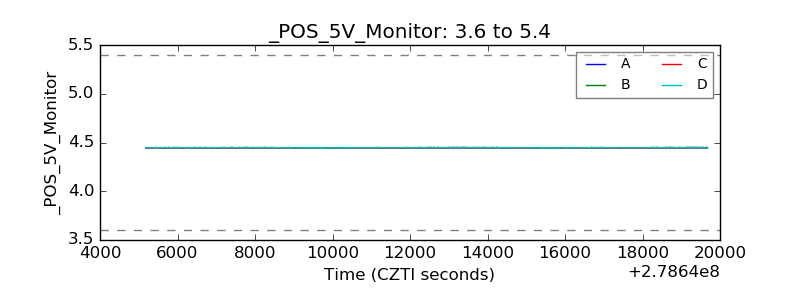 |
| _ROLL_ROT | 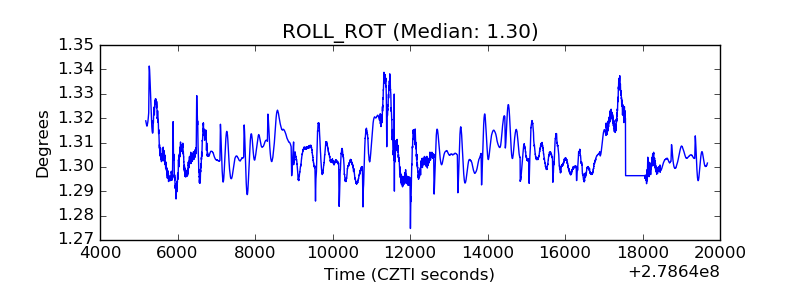 |
| _Roll_DEC | 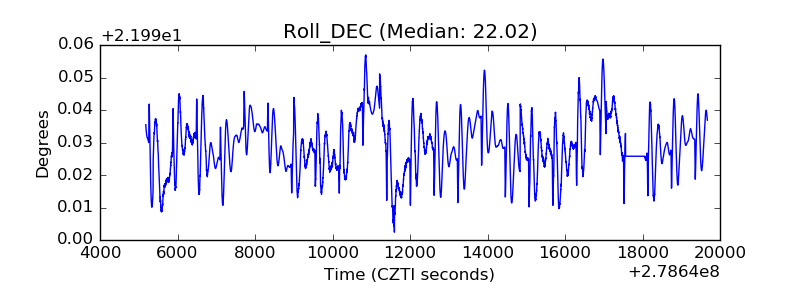 |
| _Roll_RA | 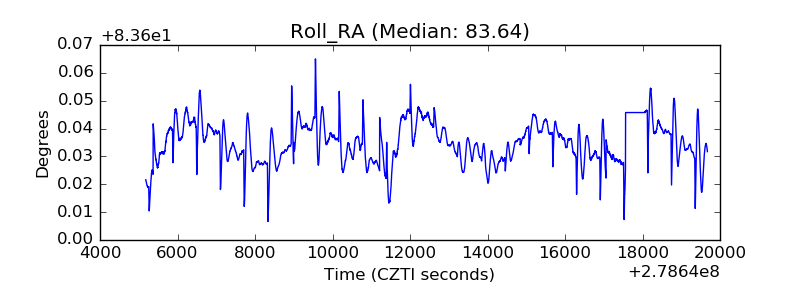 |
| Veto Counter | 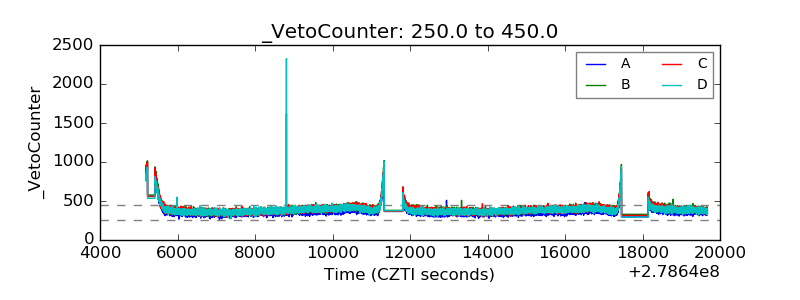 |