| Param | Original file | Final file |
|---|---|---|
| Filename | modeM0/AS1T03_024T01_9000002472_16712cztM0_level2.evt | modeM0/AS1T03_024T01_9000002472_16712cztM0_level2_quad_clean.evt |
| Size (bytes) | 518,523,840 | 85,965,120 |
| Size | 494.5 MB | 82.0 MB |
| Events in quadrant A | 3,763,165 | 544,839 |
| Events in quadrant B | 3,549,131 | 557,677 |
| Events in quadrant C | 3,163,064 | 540,043 |
| Events in quadrant D | 4,797,749 | 517,837 |
| Mode M9 | |||
|---|---|---|---|
| Quadrant | BADHDUFLAG | Total packets | Discarded packets |
| A | 0 | 9 | 0 |
| B | 0 | 9 | 0 |
| C | 0 | 9 | 0 |
| D | 0 | 9 | 0 |
| Mode M0 | |||
|---|---|---|---|
| Quadrant | BADHDUFLAG | Total packets | Discarded packets |
| A | 0 | 15033 | 2 |
| B | 0 | 14409 | 1 |
| C | 0 | 13165 | 1 |
| D | 0 | 18769 | 1 |
| Mode SS | |||
|---|---|---|---|
| Quadrant | BADHDUFLAG | Total packets | Discarded packets |
| A | 0 | 128 | 0 |
| B | 0 | 128 | 0 |
| C | 0 | 128 | 0 |
| D | 0 | 128 | 0 |
| Quadrant | Total seconds | Saturated seconds | Saturation percentage |
|---|---|---|---|
| A | 6348 | 320 | 5.040958% |
| B | 6348 | 117 | 1.843100% |
| C | 6348 | 79 | 1.244486% |
| D | 6348 | 206 | 3.245117% |
Noise dominated data is calculated using 1-second bins in cleaned event files. If a bin has >2000 counts, and if more than 50% of those come from <1% of pixels, then it is considered to be noise-dominated and hence unusable.
| Quadrant | # 1 sec bins | Bins with >0 counts | Bins with >2000 counts | High rate bins dominated by noise | Noise dominated (total time) | Noise dominated (detector-on time) | Marked lightcurve |
|---|---|---|---|---|---|---|---|
| A | 7189 | 6350 | 193 | 193 | 2.68% | 3.04% | 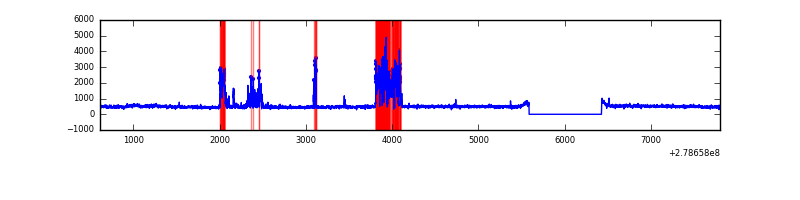 |
| B | 7189 | 6350 | 38 | 38 | 0.53% | 0.60% | 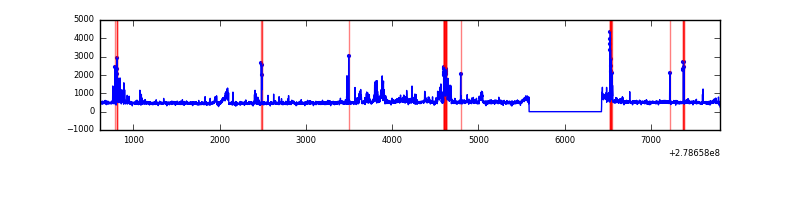 |
| C | 7189 | 6350 | 4 | 4 | 0.06% | 0.06% | 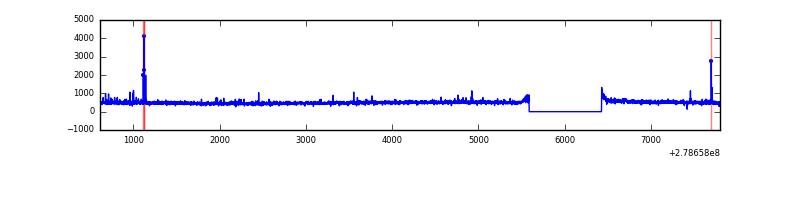 |
| D | 7189 | 6350 | 102 | 102 | 1.42% | 1.61% | 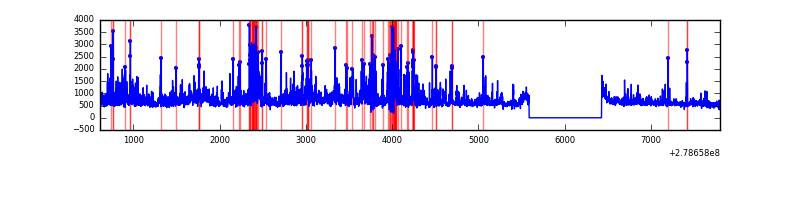 |
Top three noisy pixels from each quadrant. If the there are fewer than three noisy pixels in the level2.evt file, extra rows are filled as -1
| Pixel properties | Quadrant properties | ||||||
|---|---|---|---|---|---|---|---|
| Quadrant | DetID | PixID | Counts | Sigma | Mean | Median | Sigma |
| A | 15 | 174 | 666419 | 4187.33 | 775 | 759 | 159.0 |
| A | 9 | 143 | 112989 | 705.98 | 775 | 759 | 159.0 |
| A | 0 | 226 | 6870 | 38.44 | 775 | 759 | 159.0 |
| B | 3 | 209 | 169621 | 1110.46 | 783 | 763 | 152.1 |
| B | 15 | 35 | 128921 | 842.8 | 783 | 763 | 152.1 |
| B | 10 | 16 | 95710 | 624.4 | 783 | 763 | 152.1 |
| C | 14 | 238 | 114882 | 644.45 | 751 | 758 | 177.1 |
| C | 3 | 233 | 55722 | 310.38 | 751 | 758 | 177.1 |
| C | 0 | 207 | 41022 | 227.37 | 751 | 758 | 177.1 |
| D | 1 | 52 | 850371 | 4580.85 | 755 | 734 | 185.5 |
| D | 2 | 16 | 839892 | 4524.35 | 755 | 734 | 185.5 |
| D | 5 | 222 | 125004 | 670.01 | 755 | 734 | 185.5 |
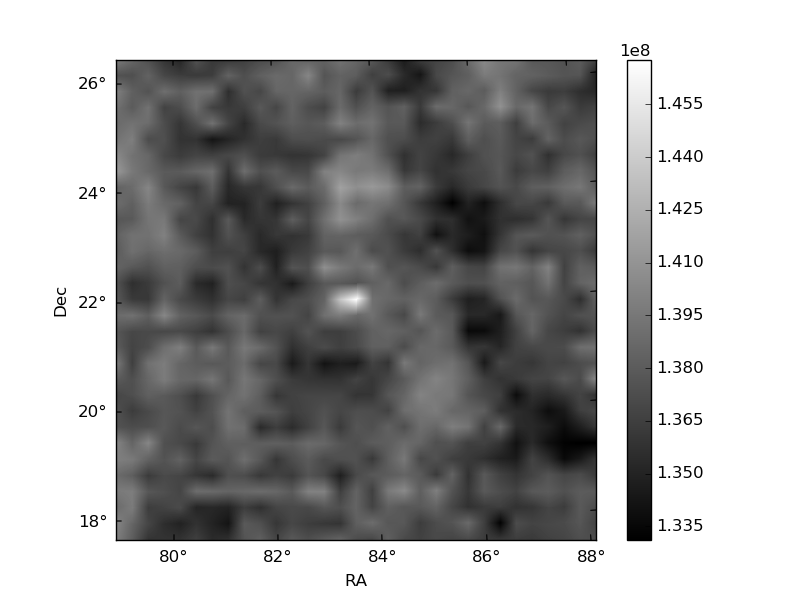
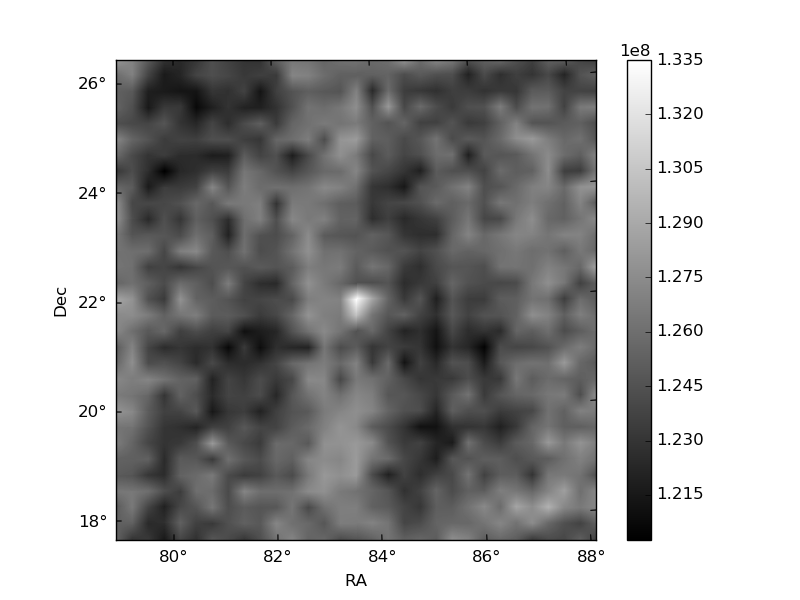
Histogram calculated using DETX and DETY for each event in the final _common_clean file
| Quadrant A | 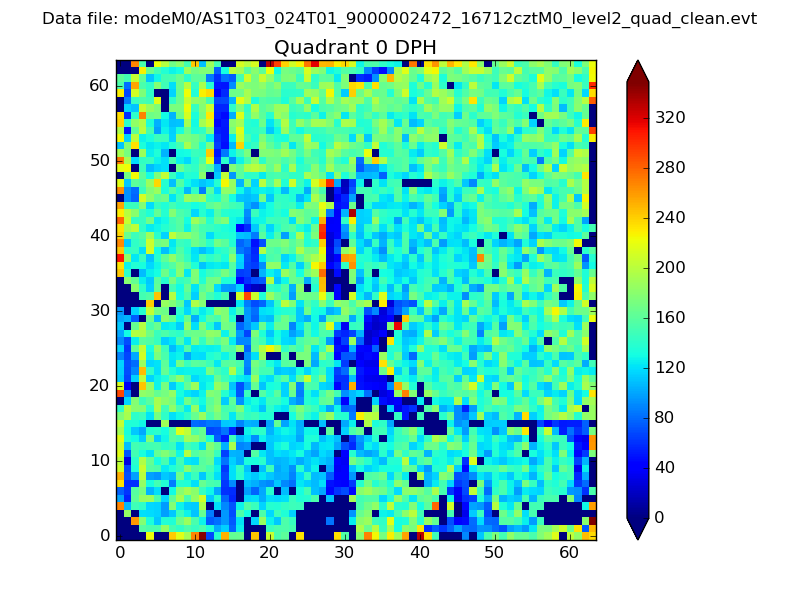 |
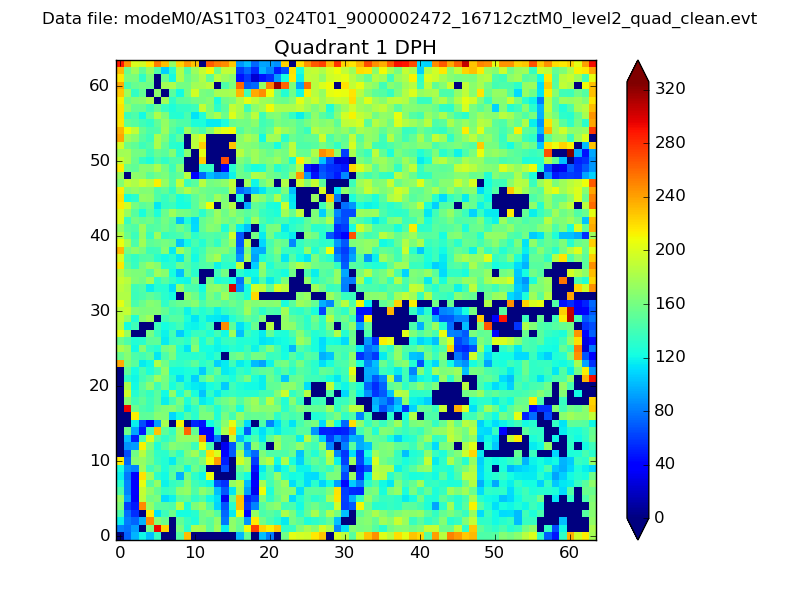 |
Quadrant B |
|---|---|---|---|
| Quadrant D | 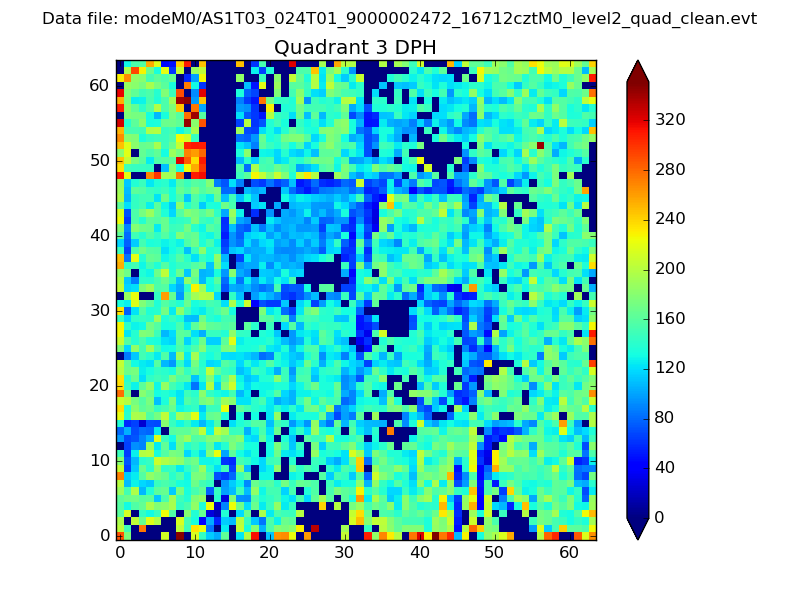 |
 |
Quadrant C |
| Plot type | Count rate plots | Images |
|---|---|---|
| Comparison with Poisson distribution Blue bars denote a histogram of data divided into 1 sec bins. Red curve is a Poisson curve with rate = median count rate of data. |
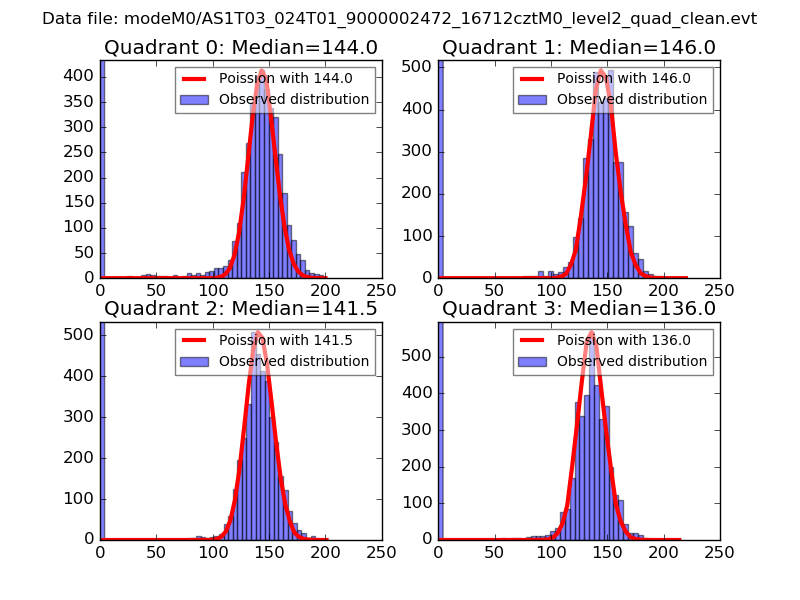 |
 |
| Quadrant-wise count rates Data is divided into 100 sec bins |
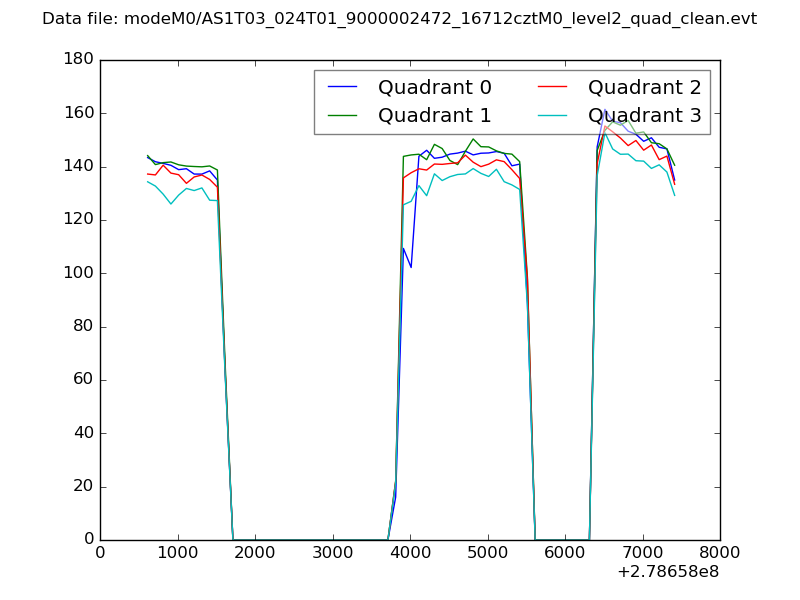 |
|
| Module-wise count rates for Quadrant A Data is divided into 100 sec bins |
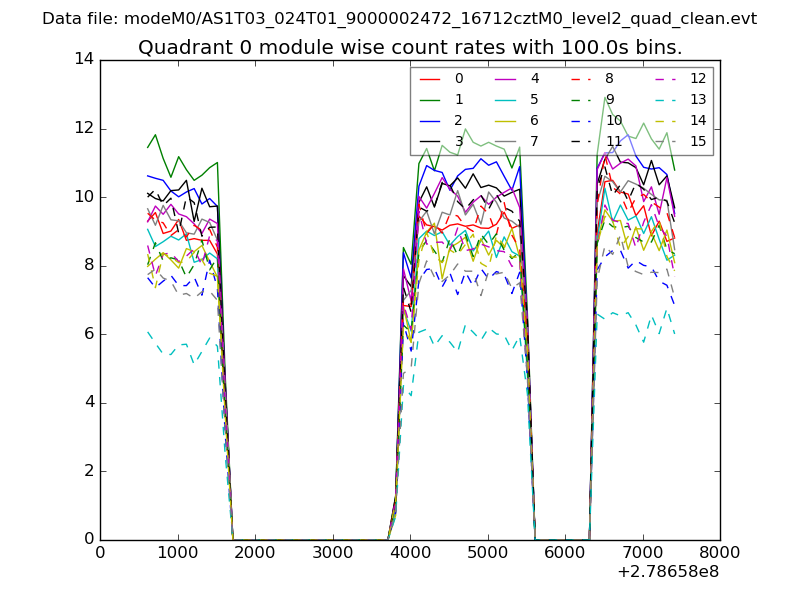 |
 |
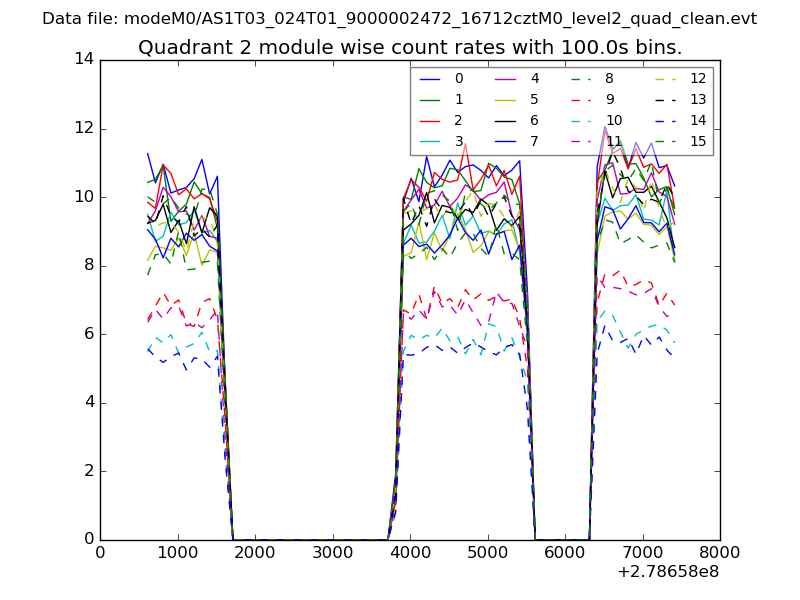
| Module-wise count rates for Quadrant B Data is divided into 100 sec bins |
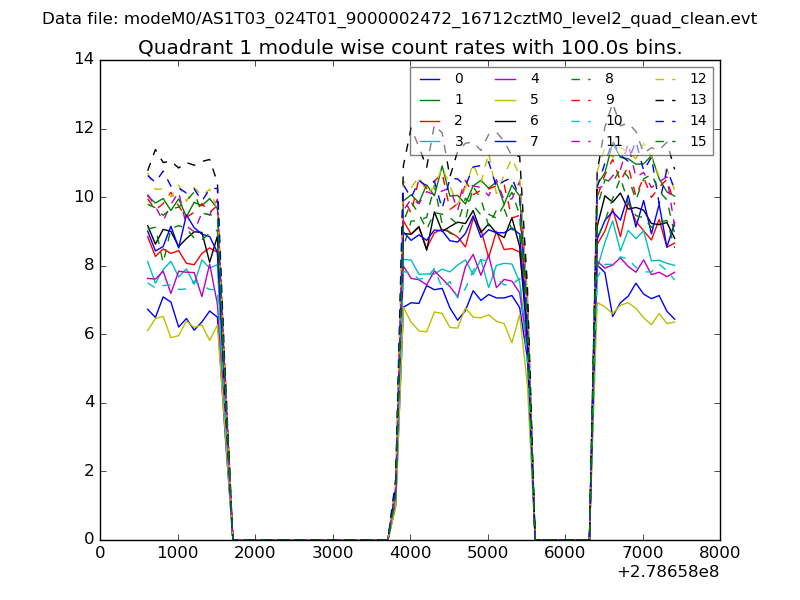 |
 |
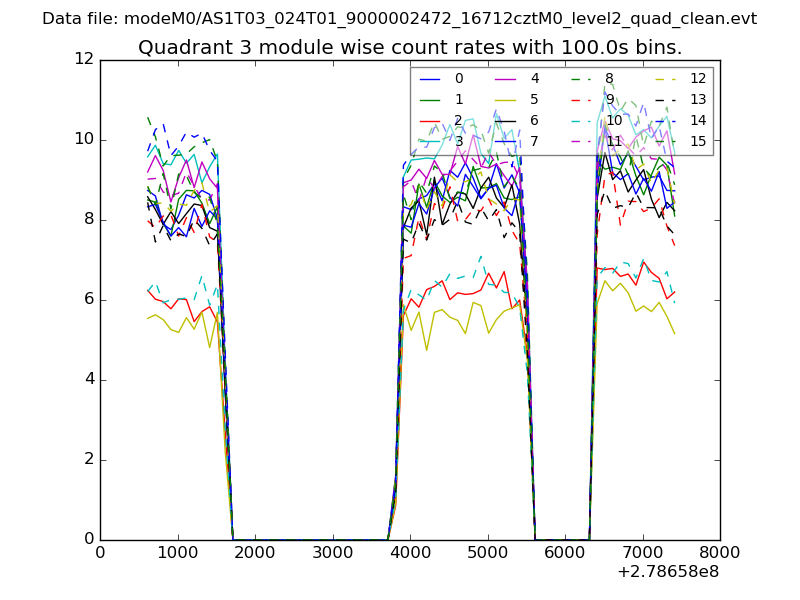
| Module-wise count rates for Quadrant C Data is divided into 100 sec bins |
 |
 |
| Module-wise count rates for Quadrant D Data is divided into 100 sec bins |
 |
 |
| Parameter | Plot |
|---|---|
| CZT HV Monitor | 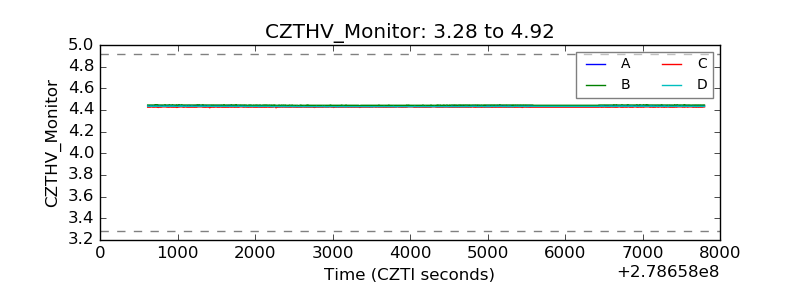 |
| D_VDD |  |
| Temperature 1 | 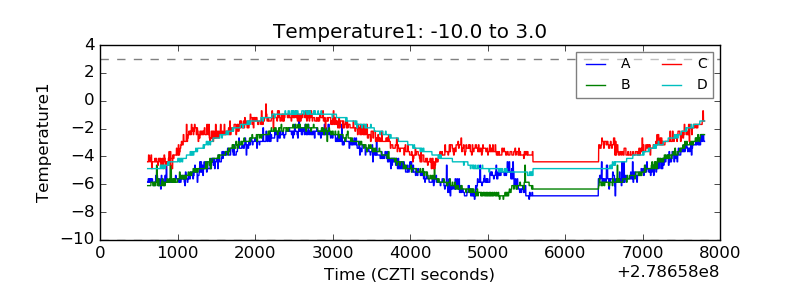 |
| Veto HV Monitor | 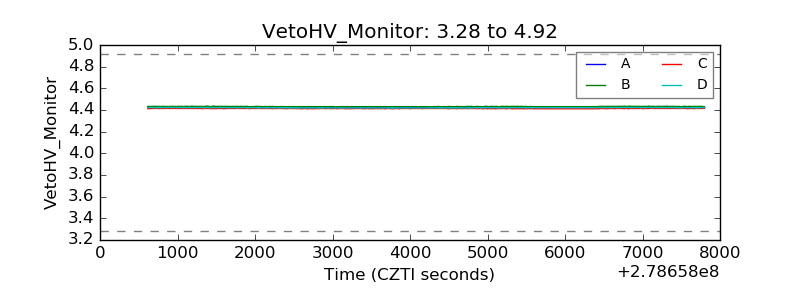 |
| Veto LLD | 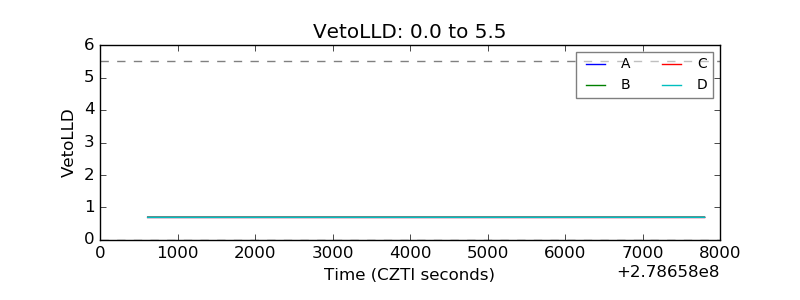 |
| Alpha Counter | 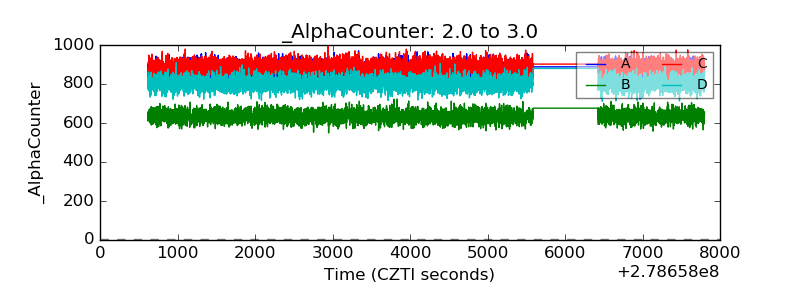 |
| _CPM_Rate | 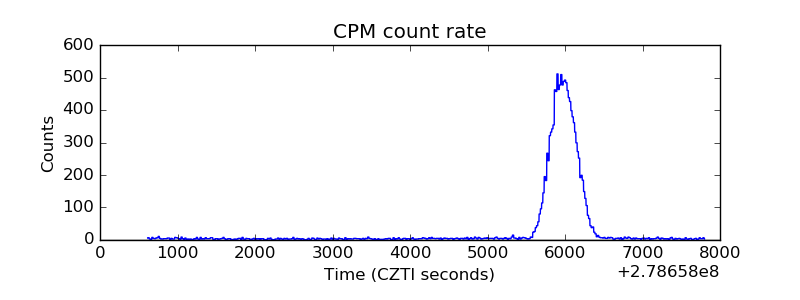 |
| CZT Counter | 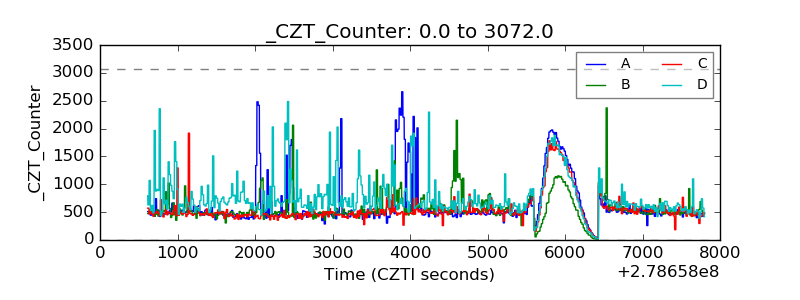 |
| +2.5 Volts monitor |  |
| +5 Volts monitor |  |
| _ROLL_ROT | 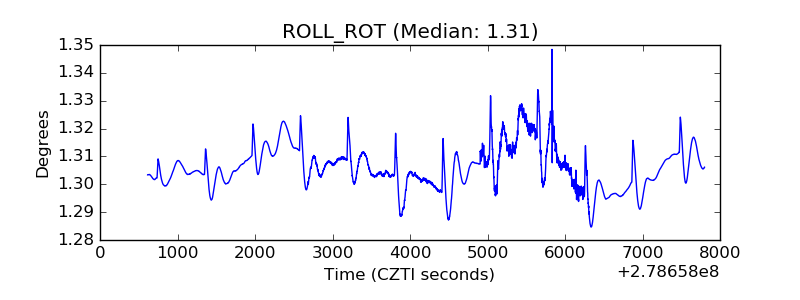 |
| _Roll_DEC | 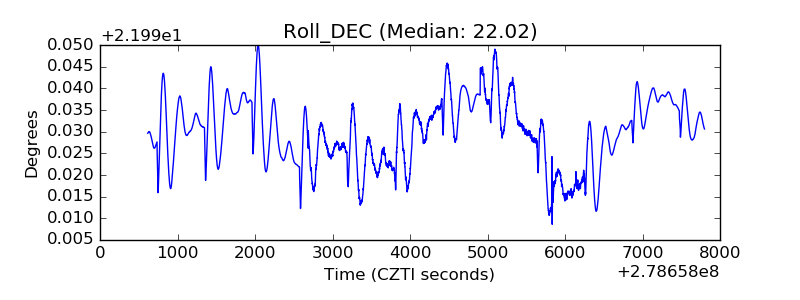 |
| _Roll_RA | 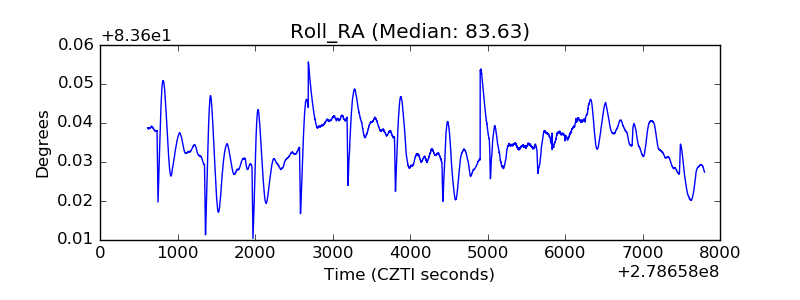 |
| Veto Counter | 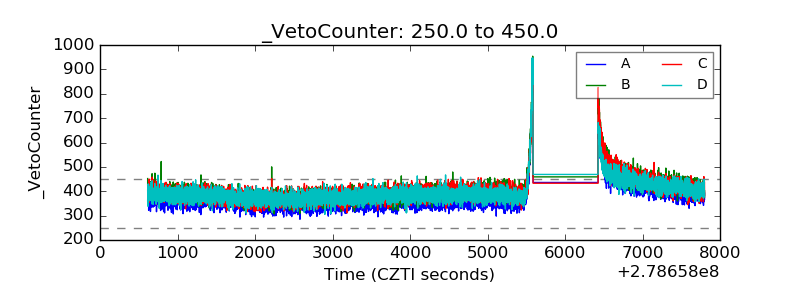 |