| Param | Original file | Final file |
|---|---|---|
| Filename | modeM0/AS1T03_024T01_9000002472_16713cztM0_level2.evt | modeM0/AS1T03_024T01_9000002472_16713cztM0_level2_quad_clean.evt |
| Size (bytes) | 550,713,600 | 73,520,640 |
| Size | 525.2 MB | 70.1 MB |
| Events in quadrant A | 3,078,110 | 469,367 |
| Events in quadrant B | 3,474,002 | 473,990 |
| Events in quadrant C | 3,238,131 | 457,207 |
| Events in quadrant D | 6,466,939 | 391,672 |
| Mode M9 | |||
|---|---|---|---|
| Quadrant | BADHDUFLAG | Total packets | Discarded packets |
| A | 0 | 10 | 0 |
| B | 0 | 10 | 0 |
| C | 0 | 10 | 0 |
| D | 0 | 10 | 0 |
| Mode M0 | |||
|---|---|---|---|
| Quadrant | BADHDUFLAG | Total packets | Discarded packets |
| A | 0 | 12920 | 2 |
| B | 0 | 14041 | 1 |
| C | 0 | 13286 | 1 |
| D | 0 | 23429 | 1 |
| Mode SS | |||
|---|---|---|---|
| Quadrant | BADHDUFLAG | Total packets | Discarded packets |
| A | 0 | 126 | 0 |
| B | 0 | 126 | 0 |
| C | 0 | 126 | 0 |
| D | 0 | 126 | 0 |
| Quadrant | Total seconds | Saturated seconds | Saturation percentage |
|---|---|---|---|
| A | 6214 | 51 | 0.820727% |
| B | 6214 | 106 | 1.705826% |
| C | 6214 | 76 | 1.223045% |
| D | 6214 | 1074 | 17.283553% |
Noise dominated data is calculated using 1-second bins in cleaned event files. If a bin has >2000 counts, and if more than 50% of those come from <1% of pixels, then it is considered to be noise-dominated and hence unusable.
| Quadrant | # 1 sec bins | Bins with >0 counts | Bins with >2000 counts | High rate bins dominated by noise | Noise dominated (total time) | Noise dominated (detector-on time) | Marked lightcurve |
|---|---|---|---|---|---|---|---|
| A | 7235 | 6216 | 1 | 1 | 0.01% | 0.02% | 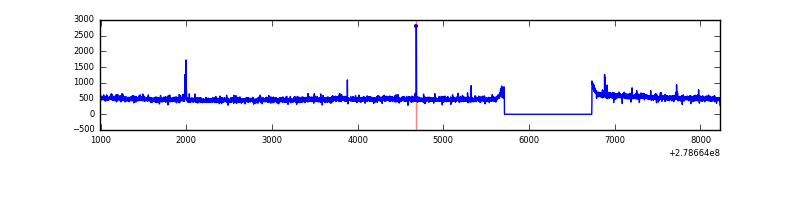 |
| B | 7235 | 6216 | 40 | 40 | 0.55% | 0.64% | 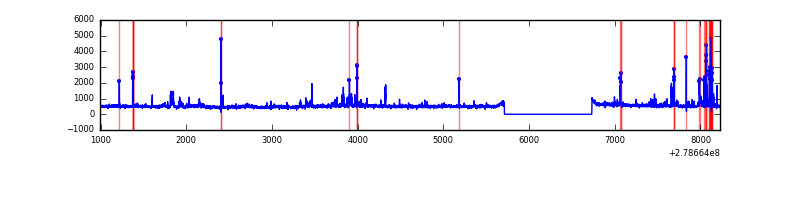 |
| C | 7235 | 6216 | 5 | 5 | 0.07% | 0.08% | 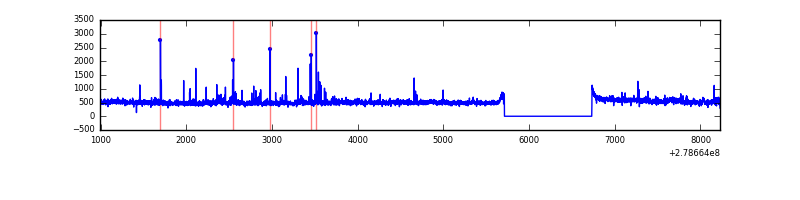 |
| D | 7235 | 6216 | 811 | 811 | 11.21% | 13.05% | 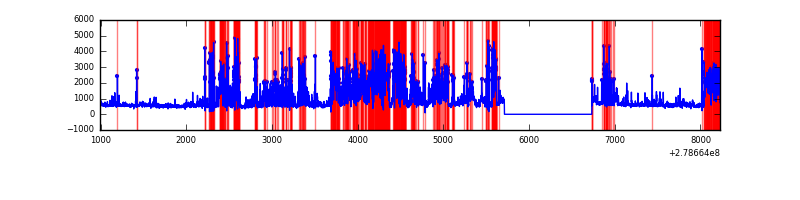 |
Top three noisy pixels from each quadrant. If the there are fewer than three noisy pixels in the level2.evt file, extra rows are filled as -1
| Pixel properties | Quadrant properties | ||||||
|---|---|---|---|---|---|---|---|
| Quadrant | DetID | PixID | Counts | Sigma | Mean | Median | Sigma |
| A | 15 | 174 | 22428 | 135.54 | 791 | 777 | 159.7 |
| A | 9 | 143 | 14148 | 83.71 | 791 | 777 | 159.7 |
| A | 0 | 226 | 6919 | 38.45 | 791 | 777 | 159.7 |
| B | 10 | 16 | 140091 | 926.46 | 782 | 764 | 150.4 |
| B | 15 | 35 | 86999 | 573.42 | 782 | 764 | 150.4 |
| B | 5 | 236 | 51727 | 338.88 | 782 | 764 | 150.4 |
| C | 14 | 238 | 116709 | 657.89 | 754 | 762 | 176.2 |
| C | 0 | 207 | 95800 | 539.25 | 754 | 762 | 176.2 |
| C | 3 | 233 | 85481 | 480.7 | 754 | 762 | 176.2 |
| D | 1 | 52 | 2799453 | 16065.65 | 708 | 690 | 174.2 |
| D | 5 | 222 | 528845 | 3031.75 | 708 | 690 | 174.2 |
| D | 2 | 16 | 275841 | 1579.44 | 708 | 690 | 174.2 |
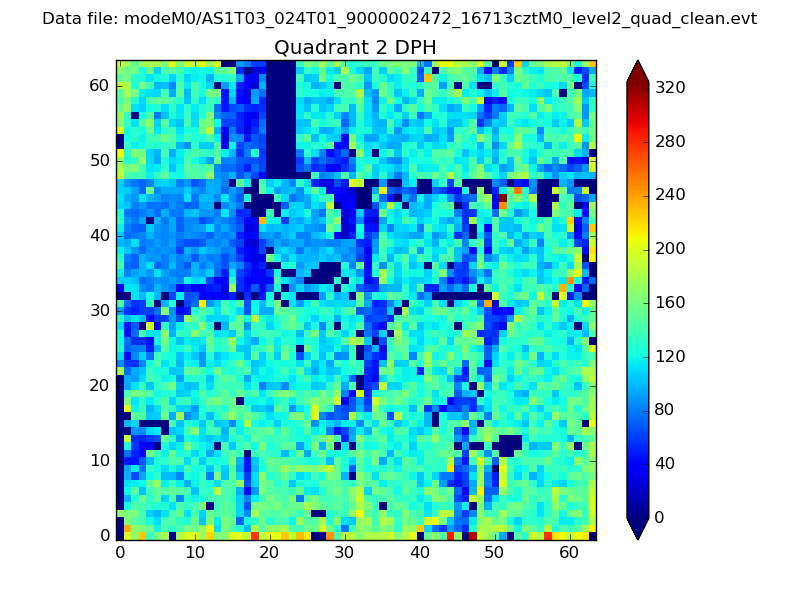
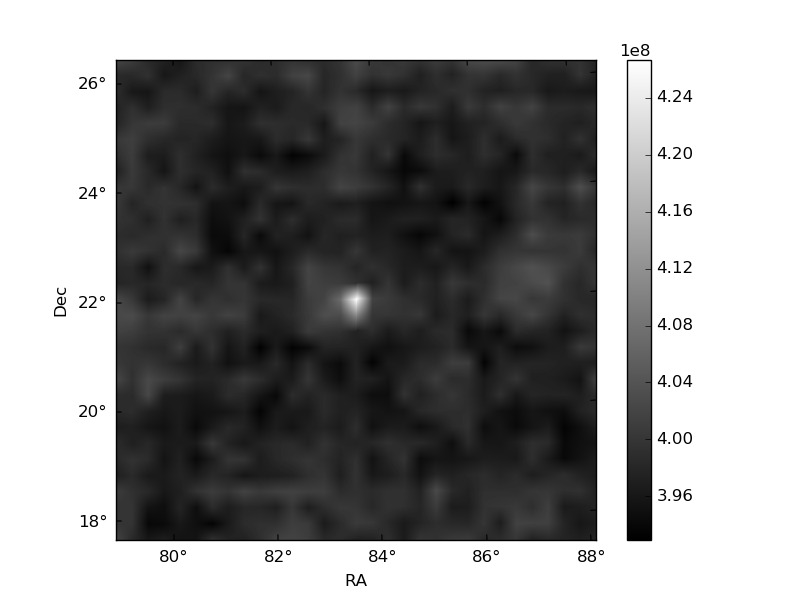
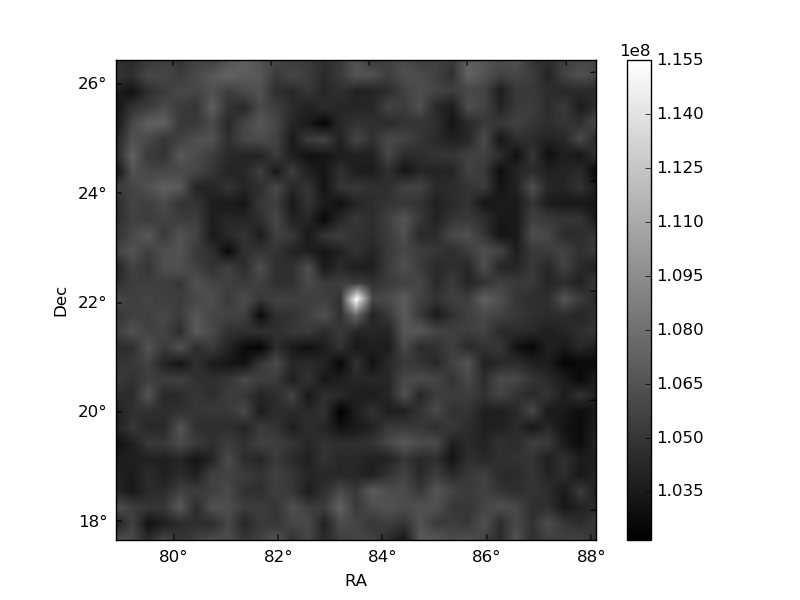
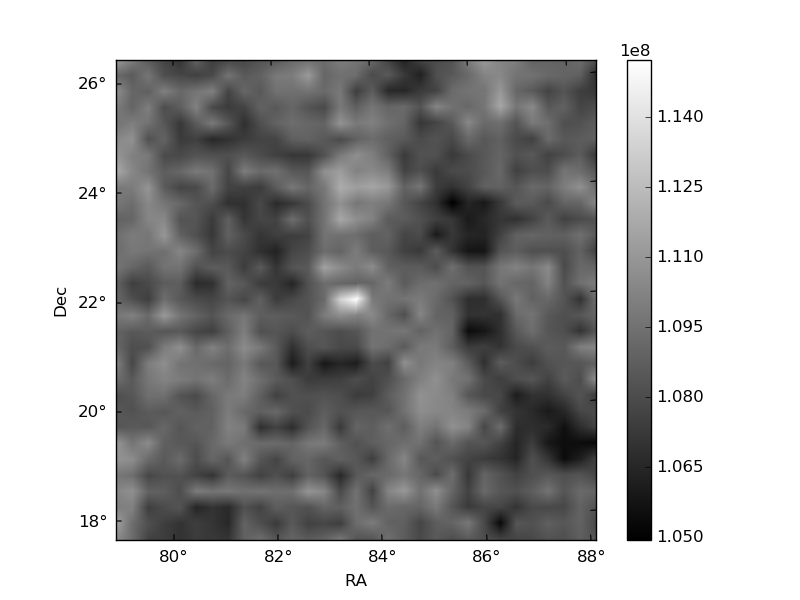
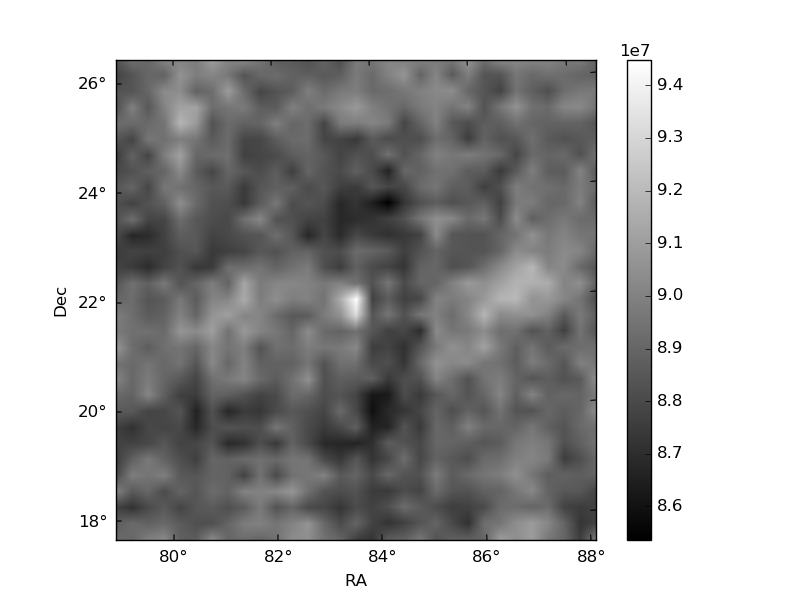
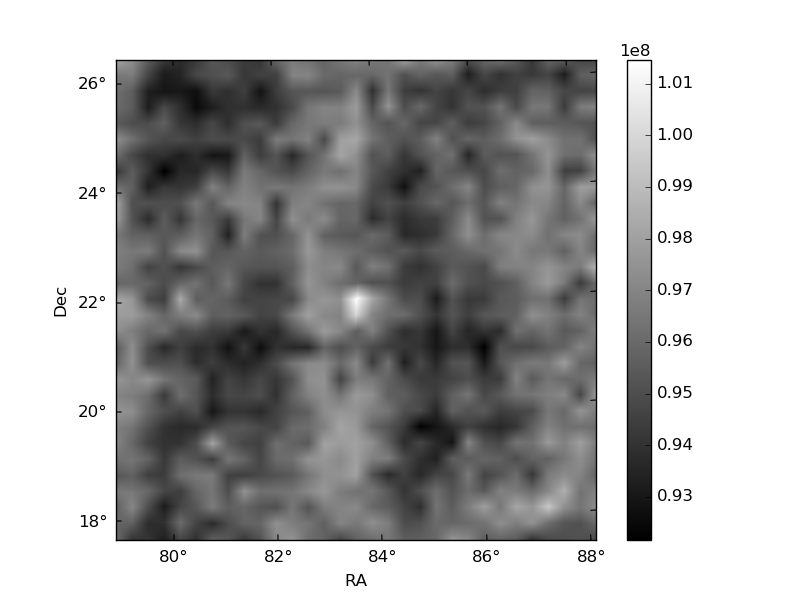
Histogram calculated using DETX and DETY for each event in the final _common_clean file
| Quadrant A | 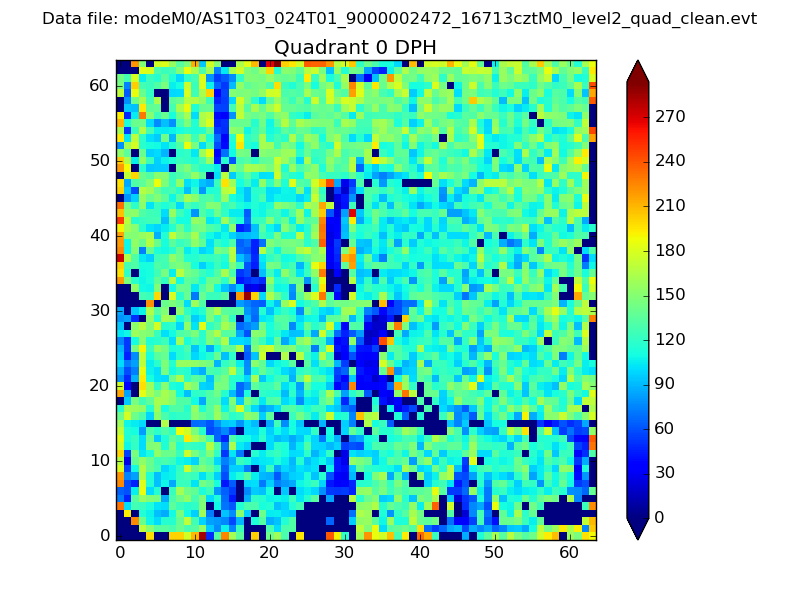 |
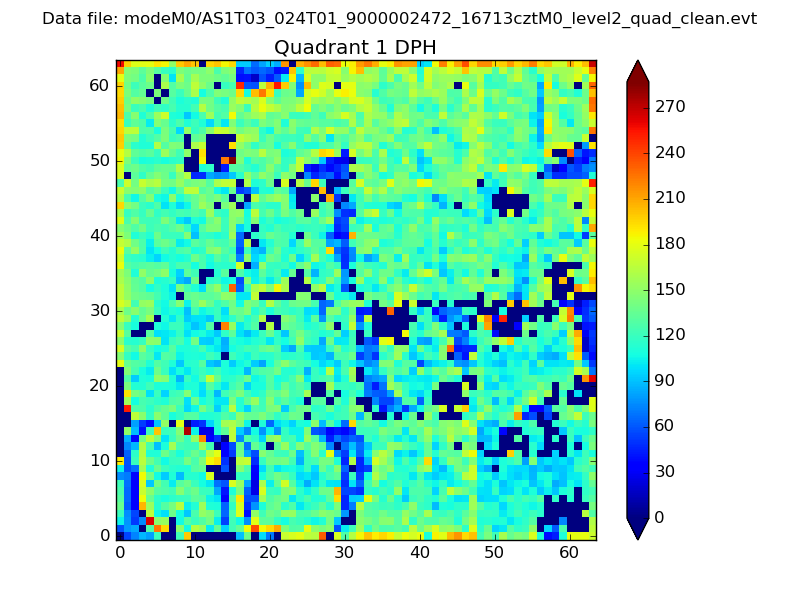 |
Quadrant B |
|---|---|---|---|
| Quadrant D | 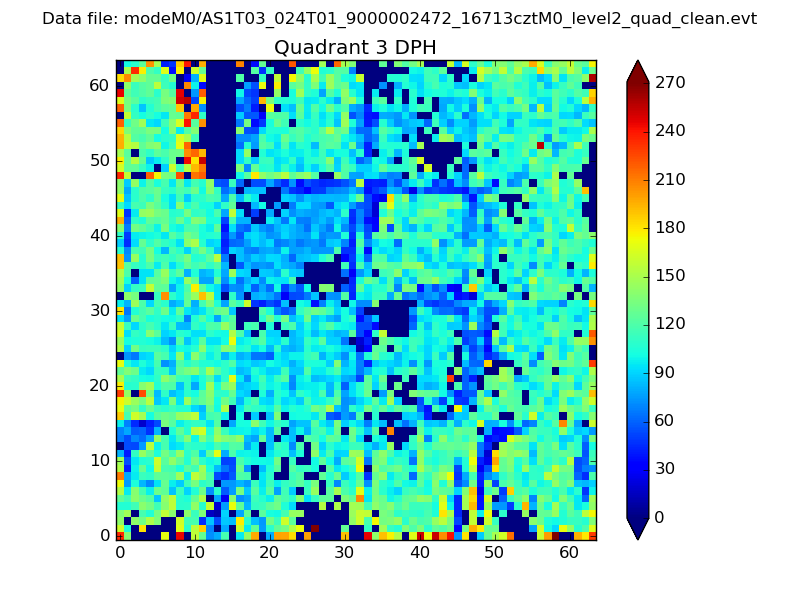 |
 |
Quadrant C |
| Plot type | Count rate plots | Images |
|---|---|---|
| Comparison with Poisson distribution Blue bars denote a histogram of data divided into 1 sec bins. Red curve is a Poisson curve with rate = median count rate of data. |
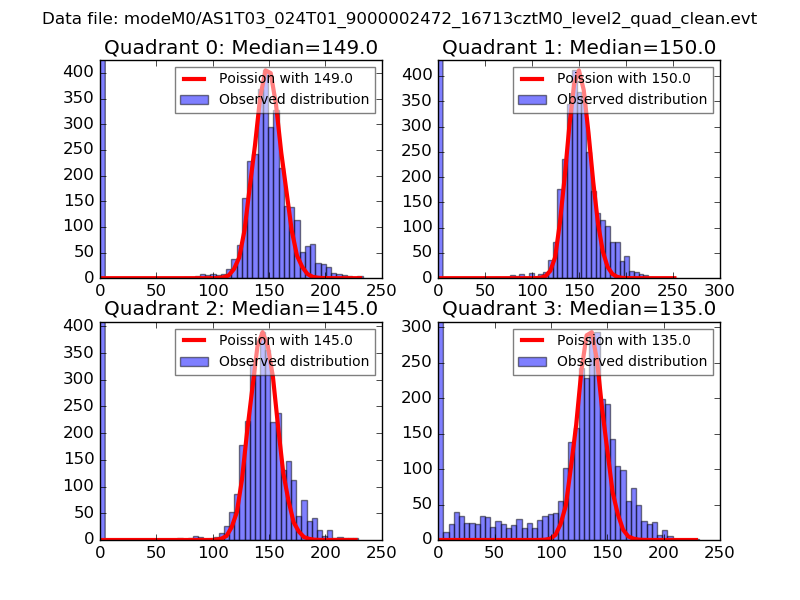 |
 |
| Quadrant-wise count rates Data is divided into 100 sec bins |
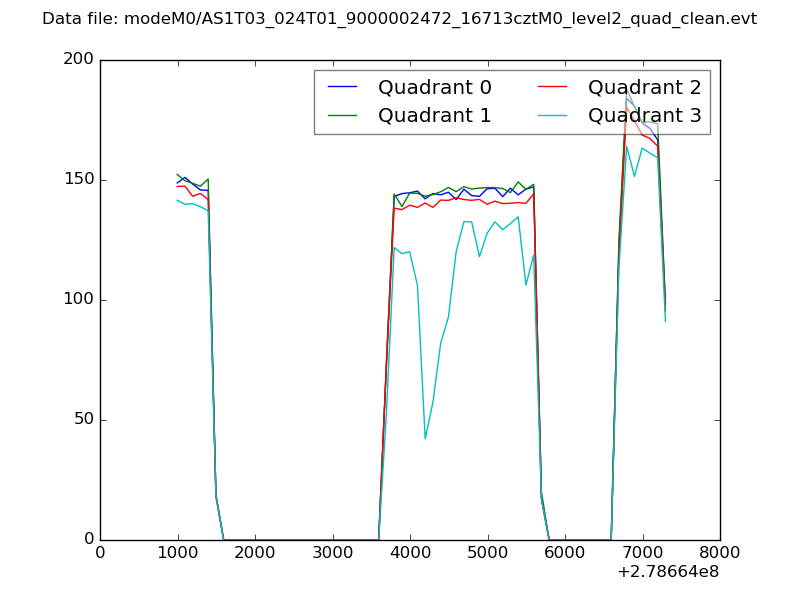 |
|
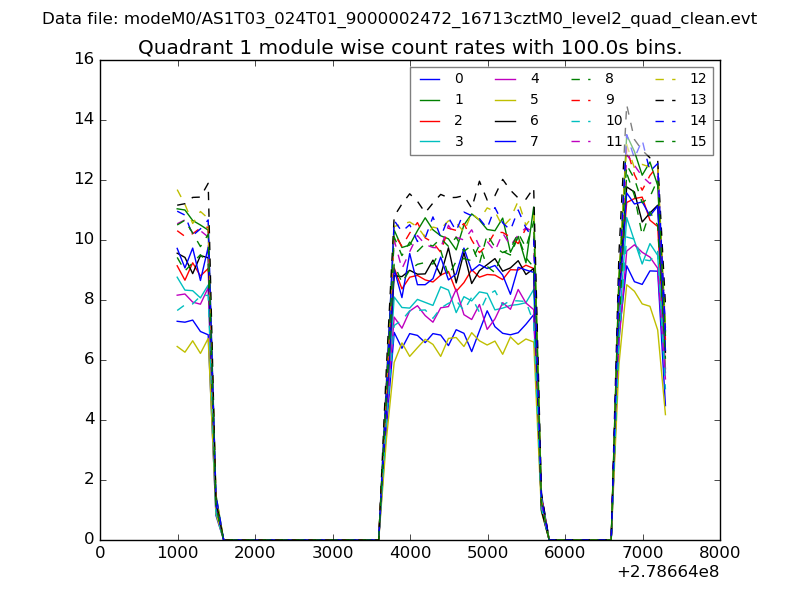
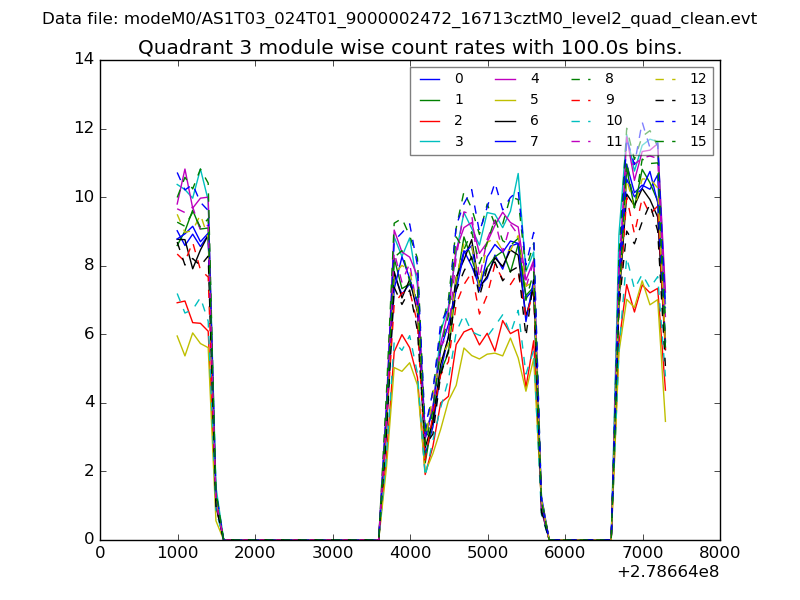
| Module-wise count rates for Quadrant A Data is divided into 100 sec bins |
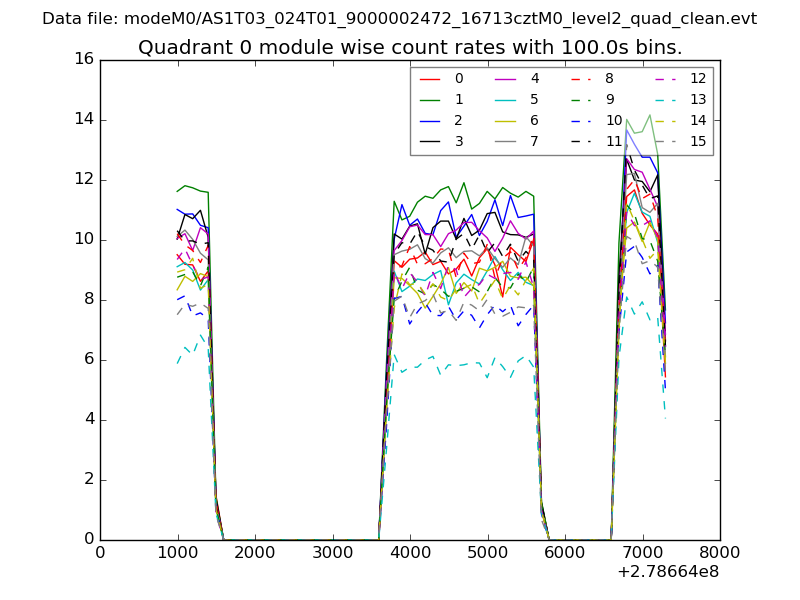 |
 |
| Module-wise count rates for Quadrant B Data is divided into 100 sec bins |
 |
 |
| Module-wise count rates for Quadrant C Data is divided into 100 sec bins |
 |
 |
| Module-wise count rates for Quadrant D Data is divided into 100 sec bins |
 |
 |
| Parameter | Plot |
|---|---|
| CZT HV Monitor | 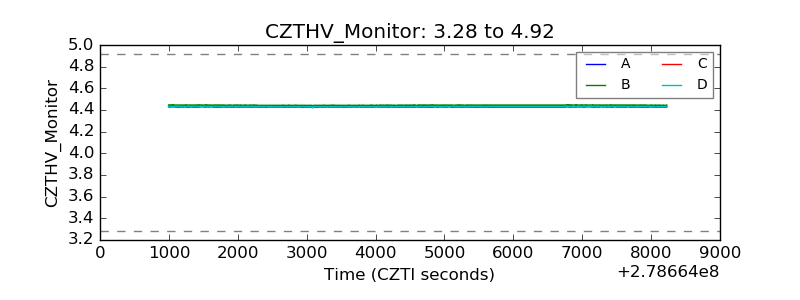 |
| D_VDD |  |
| Temperature 1 | 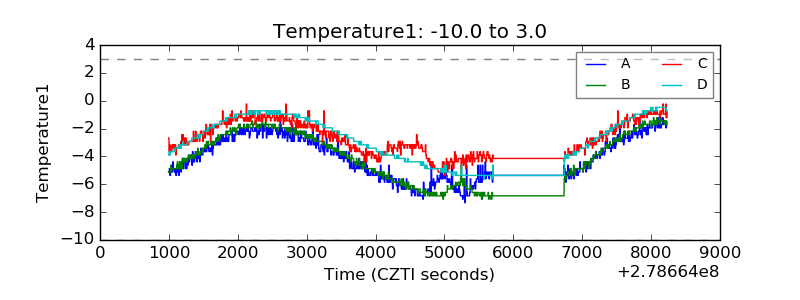 |
| Veto HV Monitor | 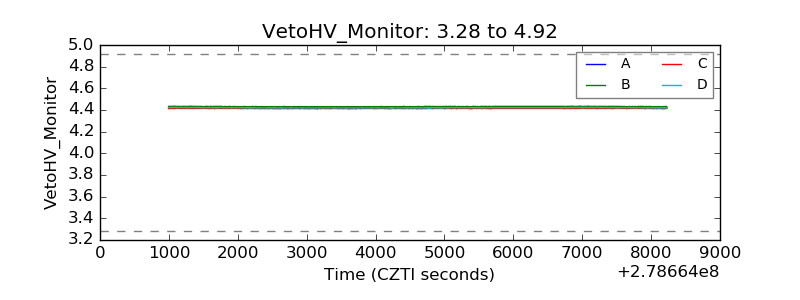 |
| Veto LLD | 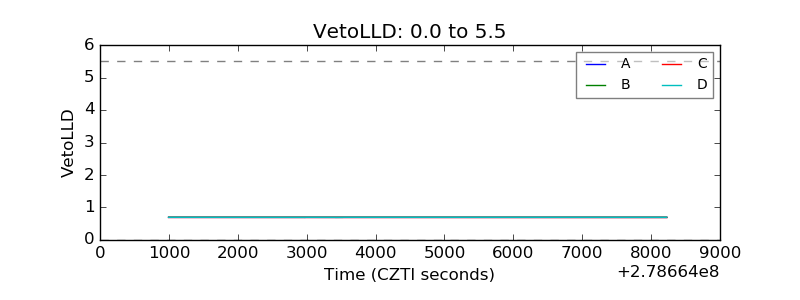 |
| Alpha Counter | 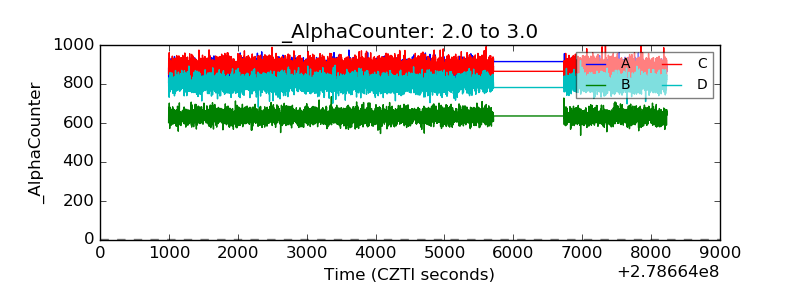 |
| _CPM_Rate | 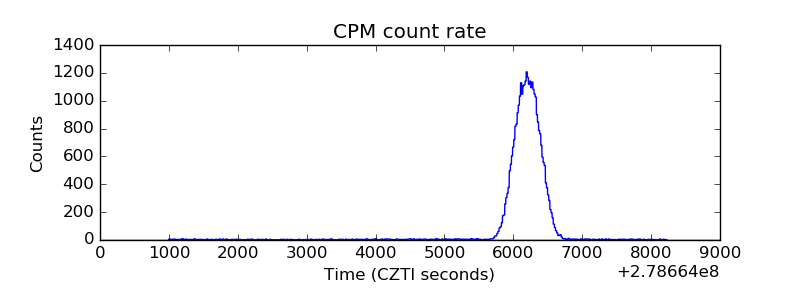 |
| CZT Counter | 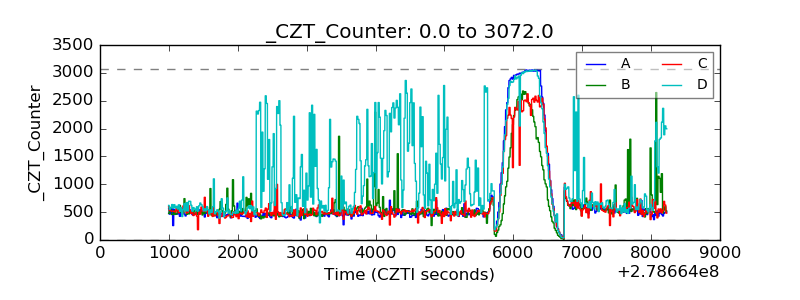 |
| +2.5 Volts monitor |  |
| +5 Volts monitor |  |
| _ROLL_ROT | 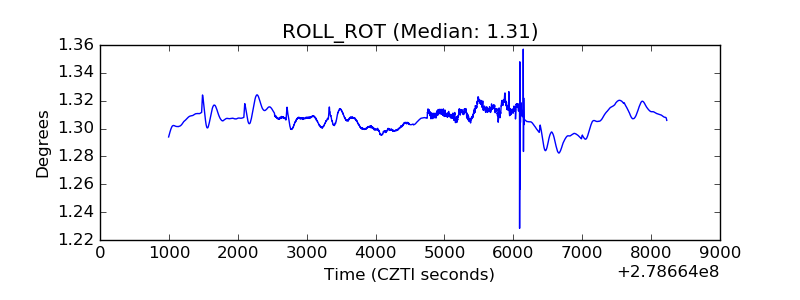 |
| _Roll_DEC | 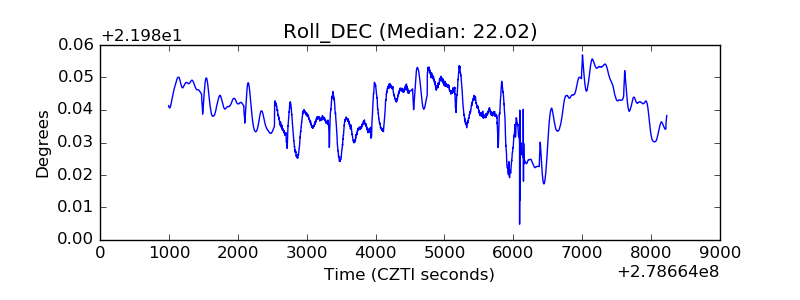 |
| _Roll_RA | 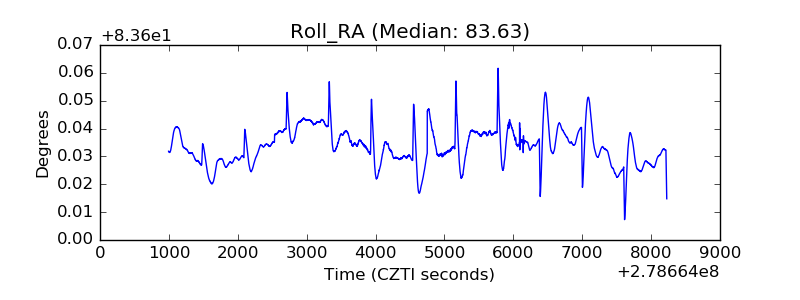 |
| Veto Counter | 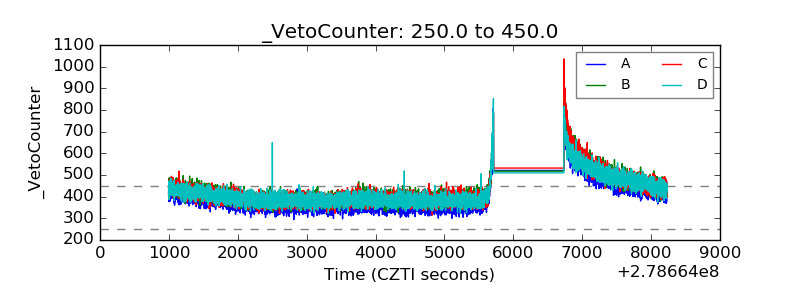 |