| Param | Original file | Final file |
|---|---|---|
| Filename | modeM0/AS1T03_024T01_9000002472_16715cztM0_level2.evt | modeM0/AS1T03_024T01_9000002472_16715cztM0_level2_quad_clean.evt |
| Size (bytes) | 710,585,280 | 75,954,240 |
| Size | 677.7 MB | 72.4 MB |
| Events in quadrant A | 3,814,007 | 480,226 |
| Events in quadrant B | 4,034,883 | 482,293 |
| Events in quadrant C | 3,886,834 | 466,042 |
| Events in quadrant D | 9,334,879 | 407,612 |
| Mode M9 | |||
|---|---|---|---|
| Quadrant | BADHDUFLAG | Total packets | Discarded packets |
| A | 0 | 12 | 0 |
| B | 0 | 12 | 0 |
| C | 0 | 12 | 0 |
| D | 0 | 13 | 0 |
| Mode M0 | |||
|---|---|---|---|
| Quadrant | BADHDUFLAG | Total packets | Discarded packets |
| A | 0 | 15443 | 3 |
| B | 0 | 16134 | 2 |
| C | 0 | 15786 | 2 |
| D | 0 | 32355 | 2 |
| Mode SS | |||
|---|---|---|---|
| Quadrant | BADHDUFLAG | Total packets | Discarded packets |
| A | 0 | 134 | 0 |
| B | 0 | 134 | 0 |
| C | 0 | 134 | 0 |
| D | 0 | 134 | 0 |
| Quadrant | Total seconds | Saturated seconds | Saturation percentage |
|---|---|---|---|
| A | 6650 | 103 | 1.548872% |
| B | 6650 | 161 | 2.421053% |
| C | 6650 | 125 | 1.879699% |
| D | 6650 | 2307 | 34.691729% |
Noise dominated data is calculated using 1-second bins in cleaned event files. If a bin has >2000 counts, and if more than 50% of those come from <1% of pixels, then it is considered to be noise-dominated and hence unusable.
| Quadrant | # 1 sec bins | Bins with >0 counts | Bins with >2000 counts | High rate bins dominated by noise | Noise dominated (total time) | Noise dominated (detector-on time) | Marked lightcurve |
|---|---|---|---|---|---|---|---|
| A | 7811 | 6652 | 17 | 17 | 0.22% | 0.26% | 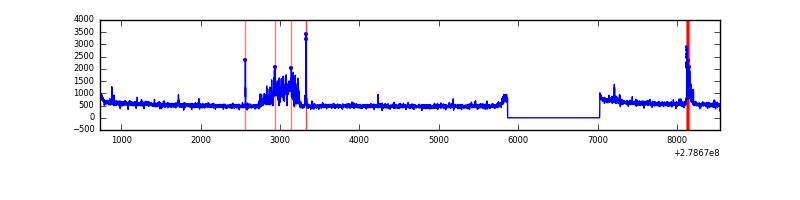 |
| B | 7811 | 6652 | 61 | 61 | 0.78% | 0.92% | 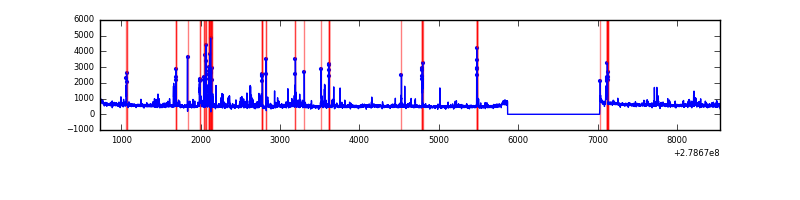 |
| C | 7811 | 6652 | 7 | 7 | 0.09% | 0.11% | 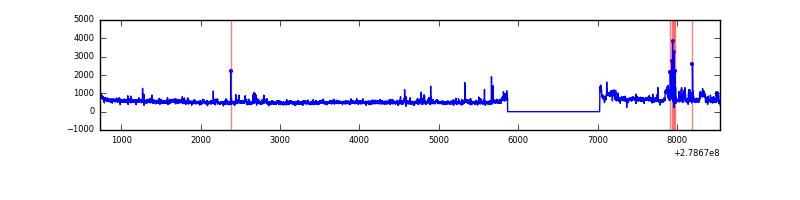 |
| D | 7811 | 6651 | 1559 | 1559 | 19.96% | 23.44% | 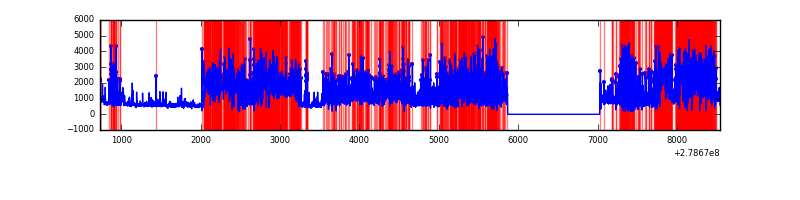 |
Top three noisy pixels from each quadrant. If the there are fewer than three noisy pixels in the level2.evt file, extra rows are filled as -1
| Pixel properties | Quadrant properties | ||||||
|---|---|---|---|---|---|---|---|
| Quadrant | DetID | PixID | Counts | Sigma | Mean | Median | Sigma |
| A | 15 | 174 | 332534 | 1861.07 | 893 | 879 | 178.2 |
| A | 9 | 143 | 46579 | 256.44 | 893 | 879 | 178.2 |
| A | 0 | 226 | 8067 | 40.34 | 893 | 879 | 178.2 |
| B | 10 | 16 | 265924 | 1598.86 | 881 | 862 | 165.8 |
| B | 5 | 236 | 131667 | 789.02 | 881 | 862 | 165.8 |
| B | 15 | 35 | 70067 | 417.45 | 881 | 862 | 165.8 |
| C | 3 | 233 | 296164 | 1500.68 | 850 | 858 | 196.8 |
| C | 14 | 238 | 133389 | 673.49 | 850 | 858 | 196.8 |
| C | 0 | 207 | 117046 | 590.44 | 850 | 858 | 196.8 |
| D | 1 | 52 | 5260535 | 30064.81 | 722 | 705 | 174.9 |
| D | 5 | 222 | 710178 | 4055.3 | 722 | 705 | 174.9 |
| D | 11 | 176 | 363286 | 2072.49 | 722 | 705 | 174.9 |
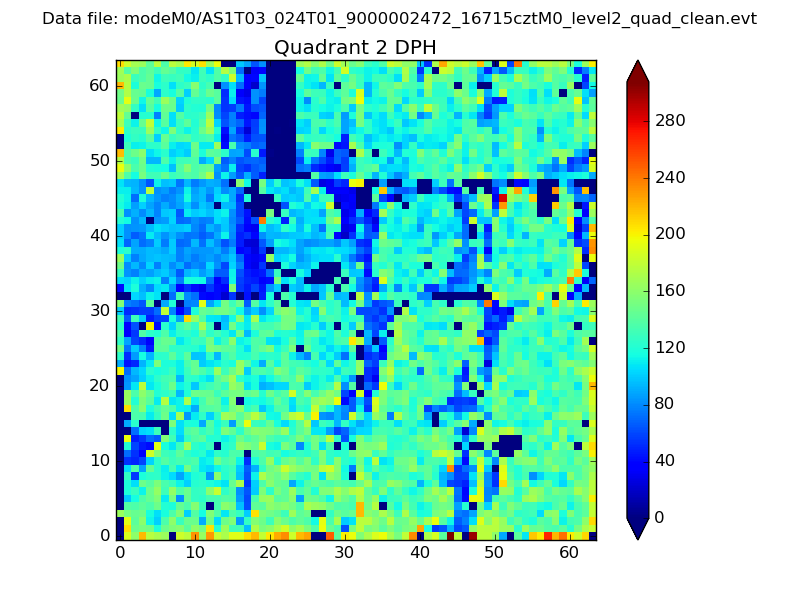
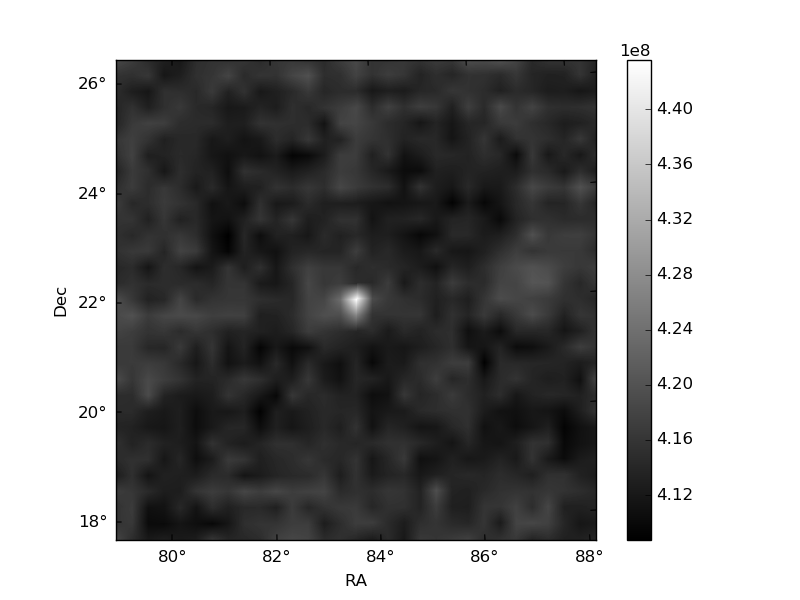
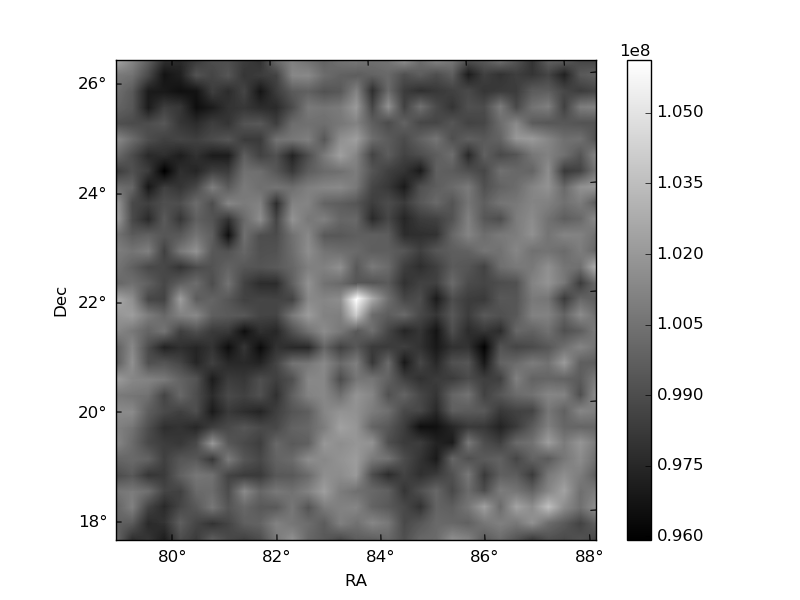
Histogram calculated using DETX and DETY for each event in the final _common_clean file
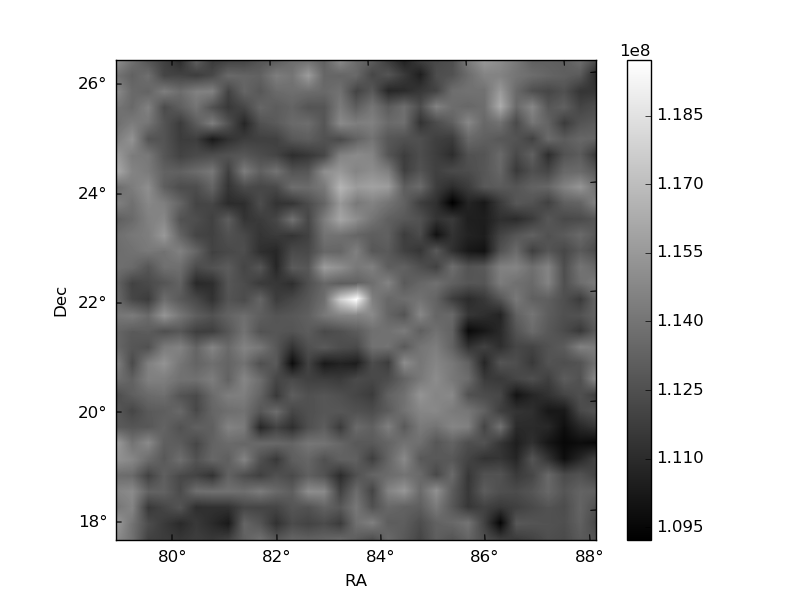
| Quadrant A | 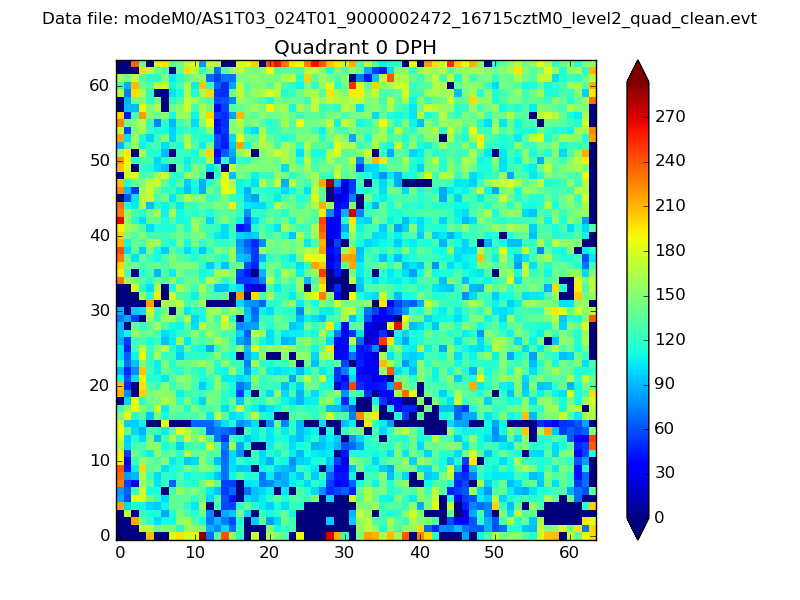 |
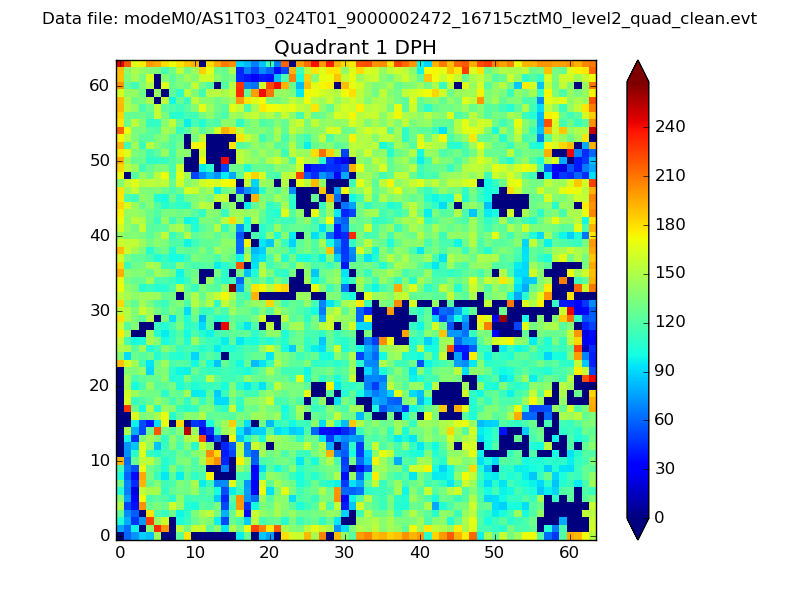 |
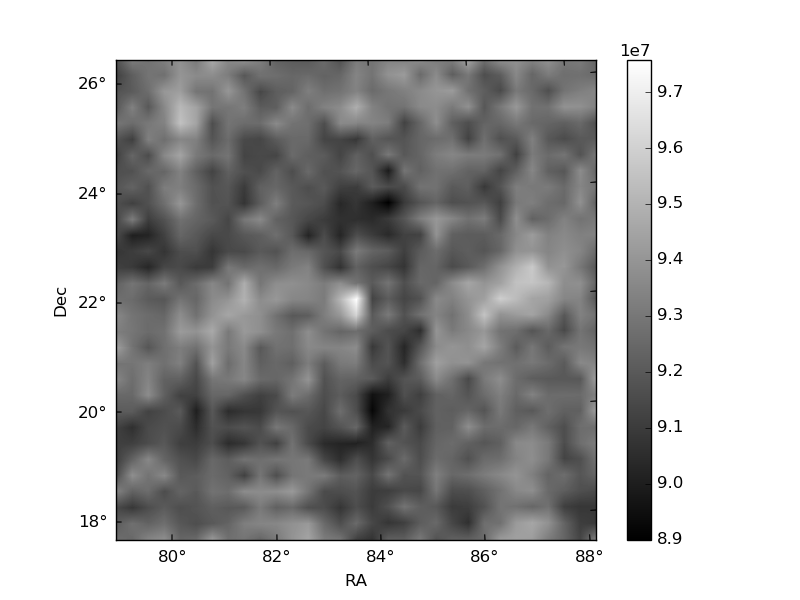
Quadrant B |
|---|---|---|---|
| Quadrant D | 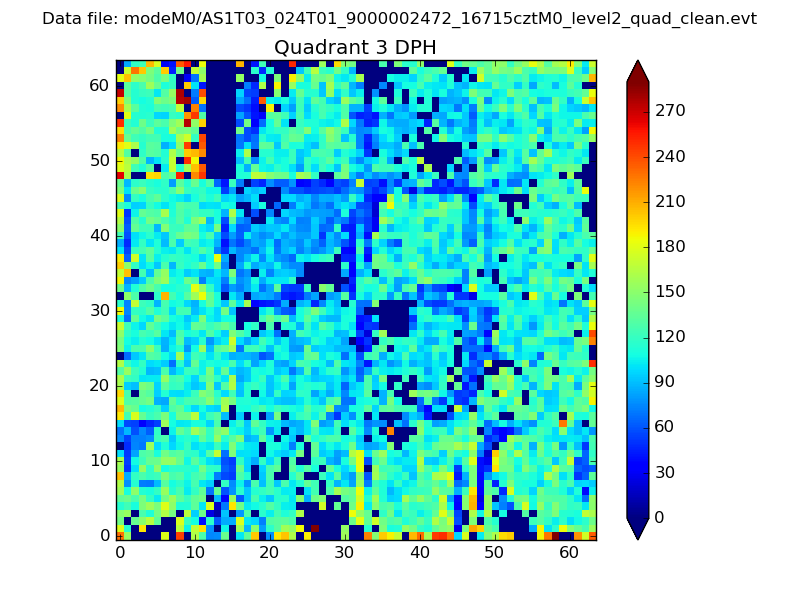 |
 |
Quadrant C |
| Plot type | Count rate plots | Images |
|---|---|---|
| Comparison with Poisson distribution Blue bars denote a histogram of data divided into 1 sec bins. Red curve is a Poisson curve with rate = median count rate of data. |
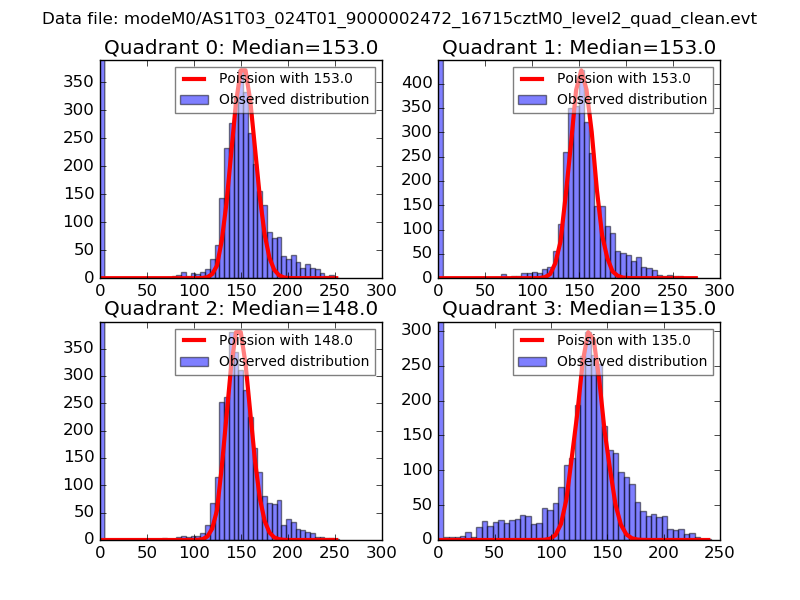 |
 |
| Quadrant-wise count rates Data is divided into 100 sec bins |
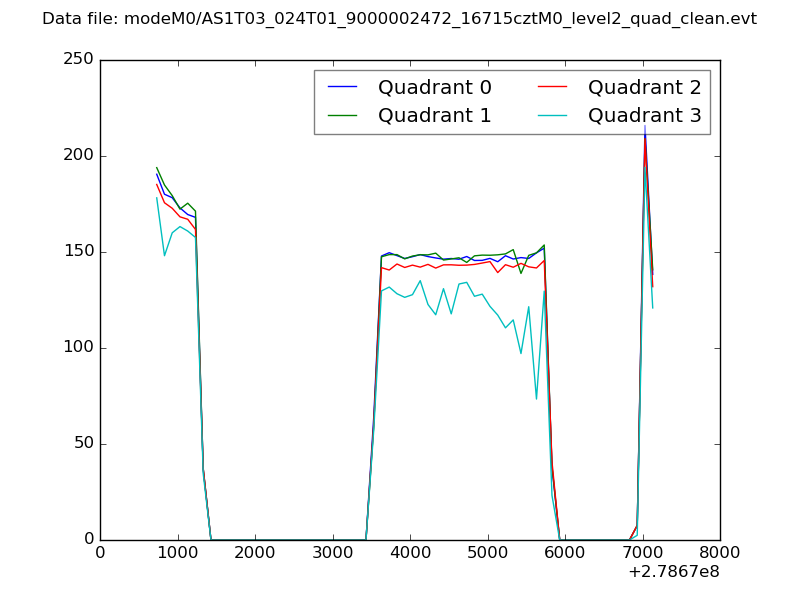 |
|
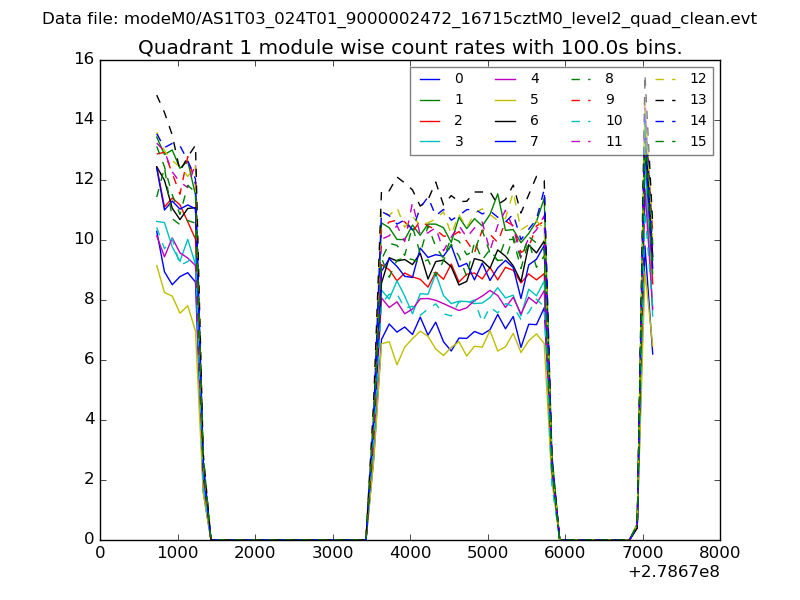
| Module-wise count rates for Quadrant A Data is divided into 100 sec bins |
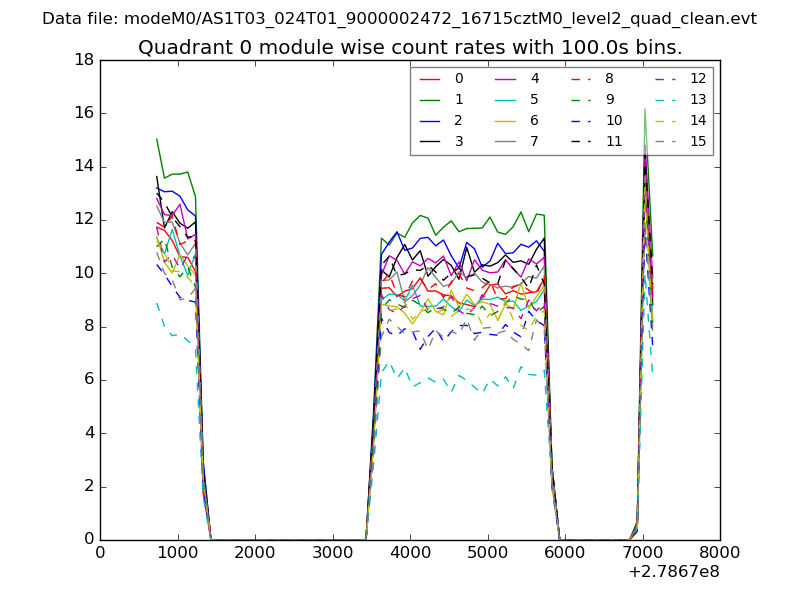 |
 |
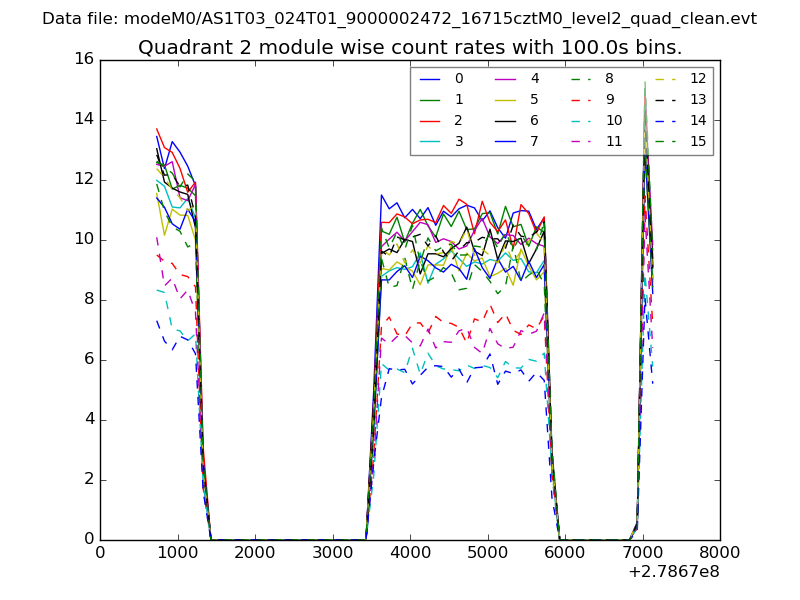
| Module-wise count rates for Quadrant B Data is divided into 100 sec bins |
 |
 |
| Module-wise count rates for Quadrant C Data is divided into 100 sec bins |
 |
 |
| Module-wise count rates for Quadrant D Data is divided into 100 sec bins |
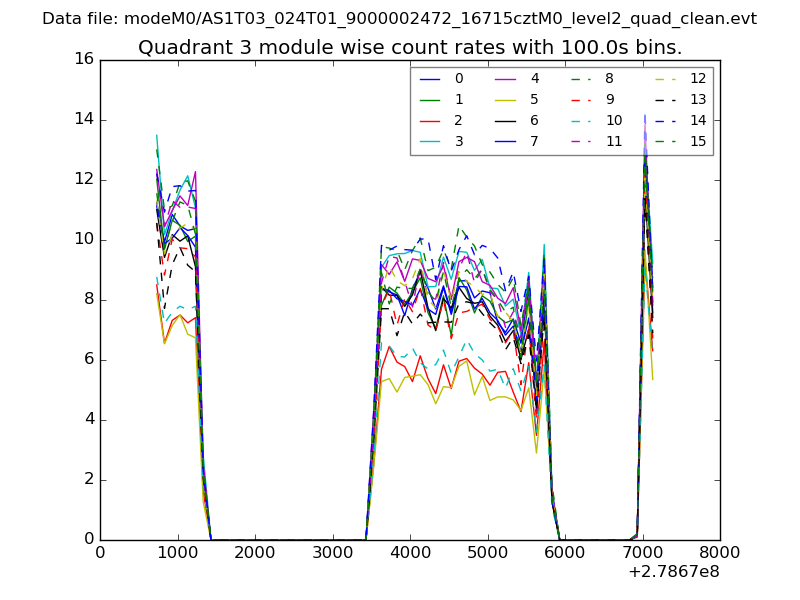 |
 |
| Parameter | Plot |
|---|---|
| CZT HV Monitor | 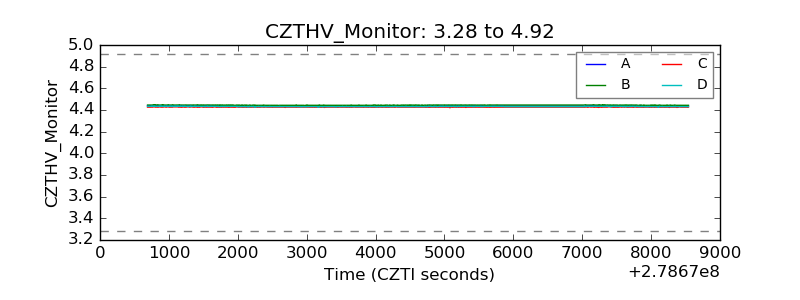 |
| D_VDD | 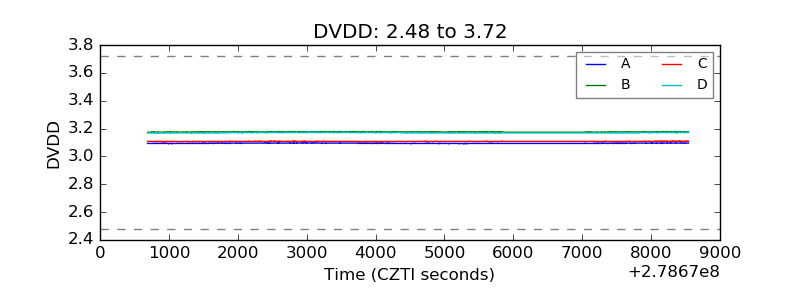 |
| Temperature 1 | 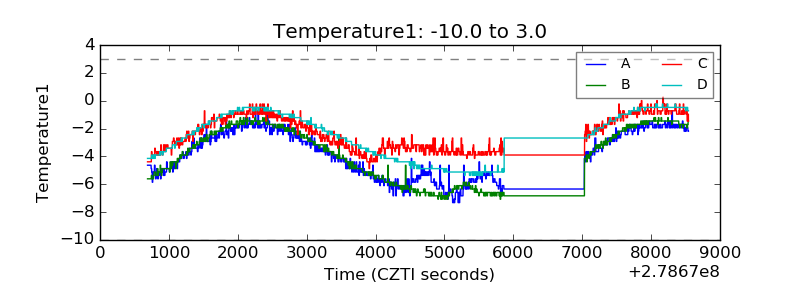 |
| Veto HV Monitor | 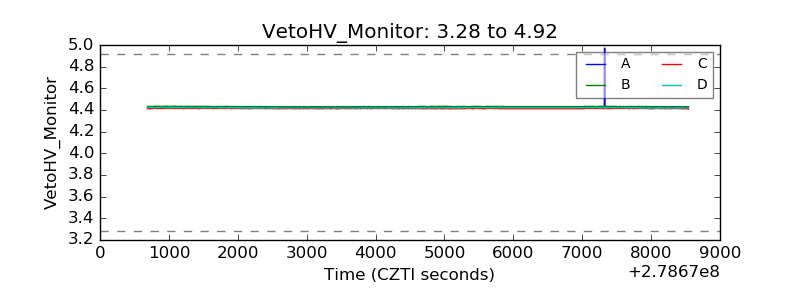 |
| Veto LLD | 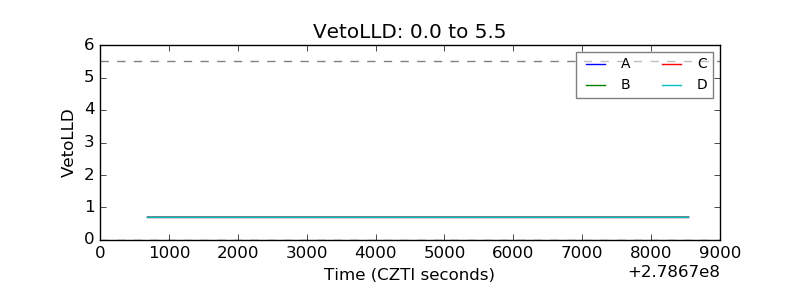 |
| Alpha Counter | 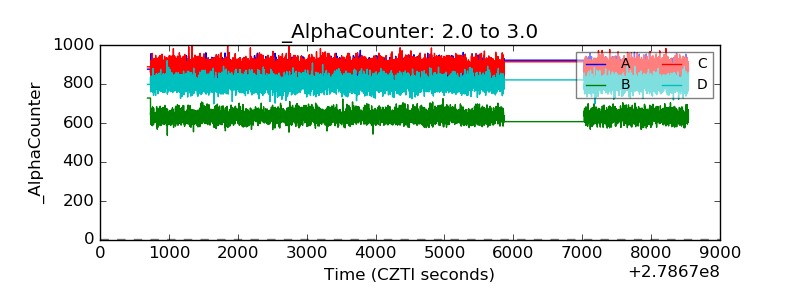 |
| _CPM_Rate | 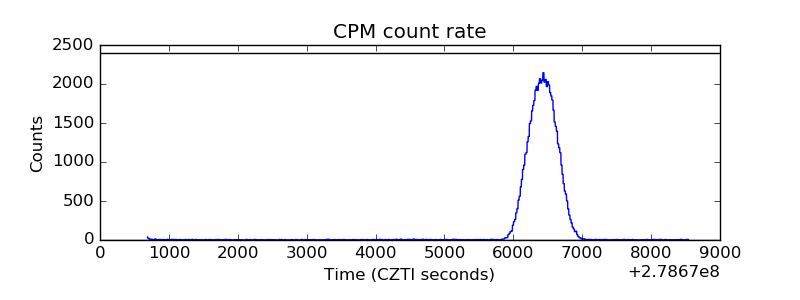 |
| CZT Counter | 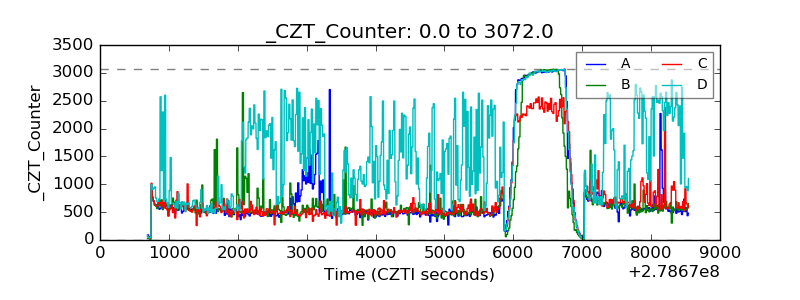 |
| +2.5 Volts monitor |  |
| +5 Volts monitor |  |
| _ROLL_ROT | 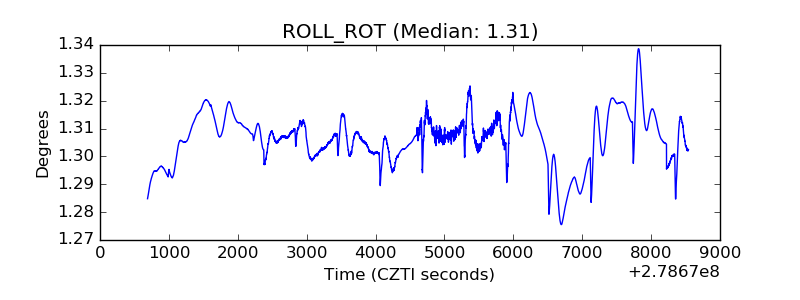 |
| _Roll_DEC | 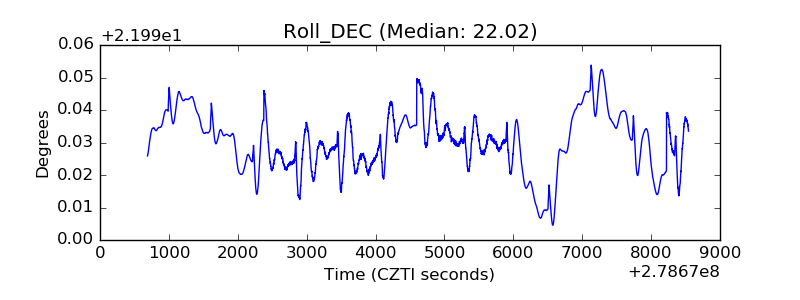 |
| _Roll_RA | 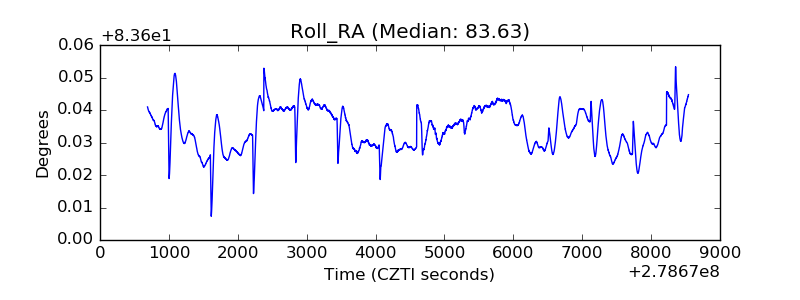 |
| Veto Counter | 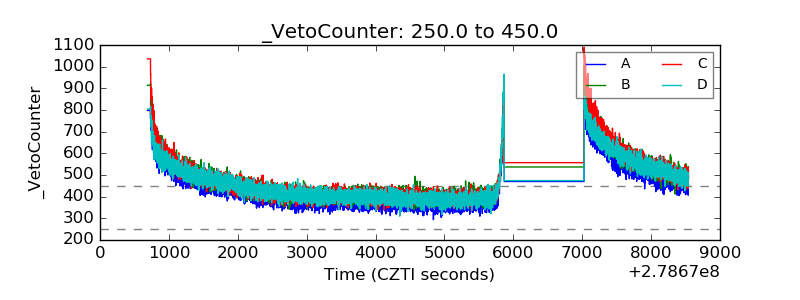 |