| Param | Original file | Final file |
|---|---|---|
| Filename | modeM0/AS1T03_024T01_9000002472_16716cztM0_level2.evt | modeM0/AS1T03_024T01_9000002472_16716cztM0_level2_quad_clean.evt |
| Size (bytes) | 725,708,160 | 66,870,720 |
| Size | 692.1 MB | 63.8 MB |
| Events in quadrant A | 3,554,121 | 424,832 |
| Events in quadrant B | 3,802,790 | 425,709 |
| Events in quadrant C | 4,428,039 | 408,089 |
| Events in quadrant D | 9,763,461 | 322,118 |
| Mode M9 | |||
|---|---|---|---|
| Quadrant | BADHDUFLAG | Total packets | Discarded packets |
| A | 0 | 13 | 0 |
| B | 0 | 13 | 0 |
| C | 0 | 13 | 0 |
| D | 0 | 13 | 0 |
| Mode M0 | |||
|---|---|---|---|
| Quadrant | BADHDUFLAG | Total packets | Discarded packets |
| A | 0 | 14582 | 3 |
| B | 0 | 15374 | 2 |
| C | 0 | 17557 | 2 |
| D | 0 | 33470 | 2 |
| Mode SS | |||
|---|---|---|---|
| Quadrant | BADHDUFLAG | Total packets | Discarded packets |
| A | 0 | 130 | 0 |
| B | 0 | 130 | 0 |
| C | 0 | 130 | 0 |
| D | 0 | 130 | 0 |
| Quadrant | Total seconds | Saturated seconds | Saturation percentage |
|---|---|---|---|
| A | 6353 | 71 | 1.117582% |
| B | 6353 | 92 | 1.448135% |
| C | 6353 | 132 | 2.077759% |
| D | 6353 | 2954 | 46.497718% |
Noise dominated data is calculated using 1-second bins in cleaned event files. If a bin has >2000 counts, and if more than 50% of those come from <1% of pixels, then it is considered to be noise-dominated and hence unusable.
| Quadrant | # 1 sec bins | Bins with >0 counts | Bins with >2000 counts | High rate bins dominated by noise | Noise dominated (total time) | Noise dominated (detector-on time) | Marked lightcurve |
|---|---|---|---|---|---|---|---|
| A | 7669 | 6355 | 13 | 13 | 0.17% | 0.20% | 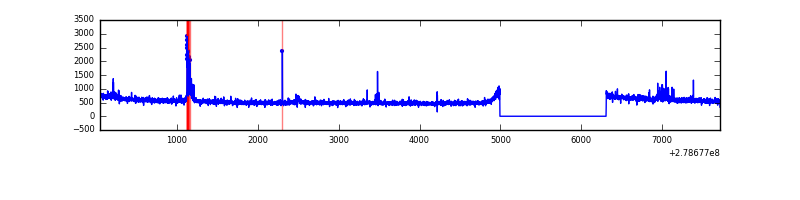 |
| B | 7669 | 6355 | 27 | 27 | 0.35% | 0.42% | 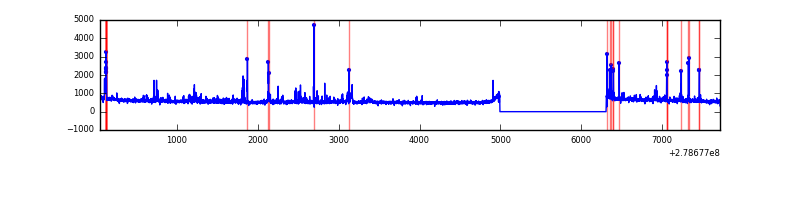 |
| C | 7669 | 6355 | 15 | 15 | 0.20% | 0.24% | 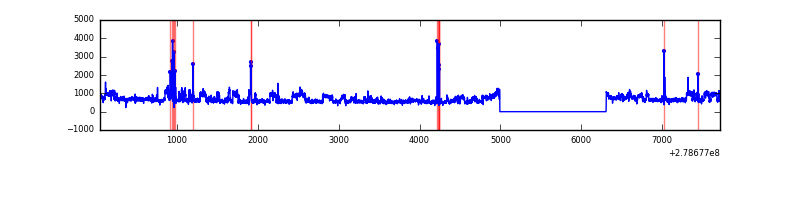 |
| D | 7668 | 6354 | 1844 | 1844 | 24.05% | 29.02% | 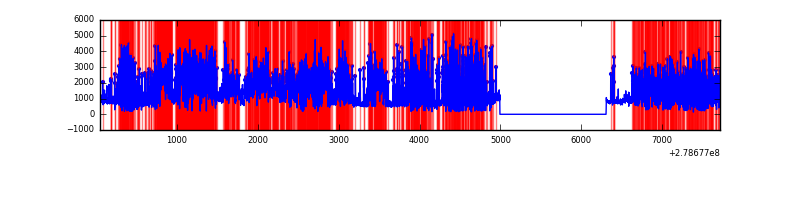 |
Top three noisy pixels from each quadrant. If the there are fewer than three noisy pixels in the level2.evt file, extra rows are filled as -1
| Pixel properties | Quadrant properties | ||||||
|---|---|---|---|---|---|---|---|
| Quadrant | DetID | PixID | Counts | Sigma | Mean | Median | Sigma |
| A | 15 | 174 | 94151 | 526.37 | 888 | 876 | 177.2 |
| A | 0 | 23 | 34853 | 191.74 | 888 | 876 | 177.2 |
| A | 0 | 226 | 9954 | 51.23 | 888 | 876 | 177.2 |
| B | 5 | 236 | 126956 | 768.57 | 880 | 862 | 164.1 |
| B | 15 | 35 | 122341 | 740.44 | 880 | 862 | 164.1 |
| B | 0 | 229 | 31001 | 183.7 | 880 | 862 | 164.1 |
| C | 3 | 233 | 783783 | 3999.96 | 851 | 861 | 195.7 |
| C | 14 | 238 | 133899 | 679.69 | 851 | 861 | 195.7 |
| C | 0 | 207 | 131015 | 664.96 | 851 | 861 | 195.7 |
| D | 1 | 52 | 6575425 | 39919.43 | 671 | 654 | 164.7 |
| D | 11 | 176 | 359388 | 2178.09 | 671 | 654 | 164.7 |
| D | 2 | 16 | 115053 | 694.59 | 671 | 654 | 164.7 |
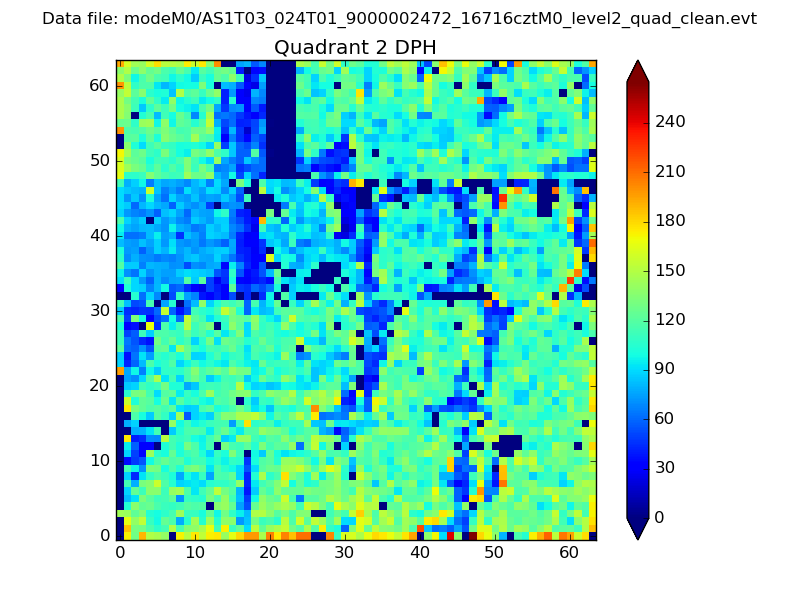
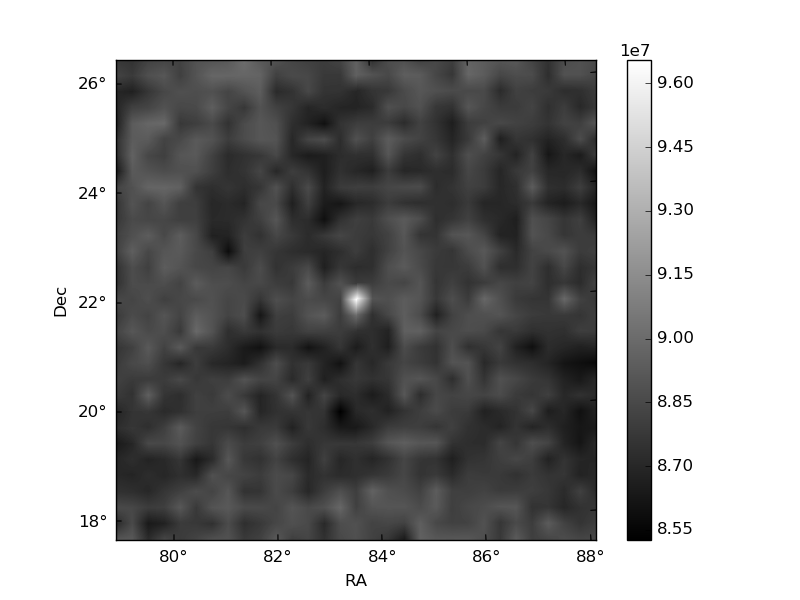
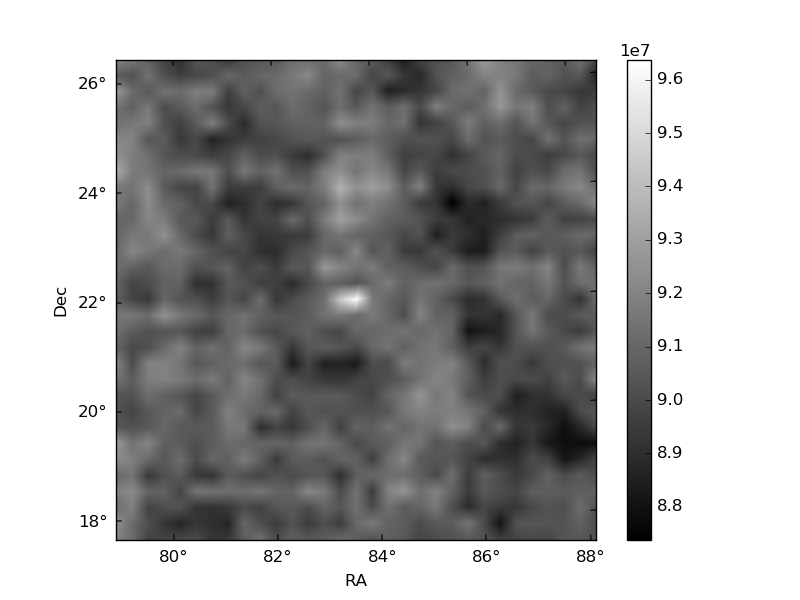
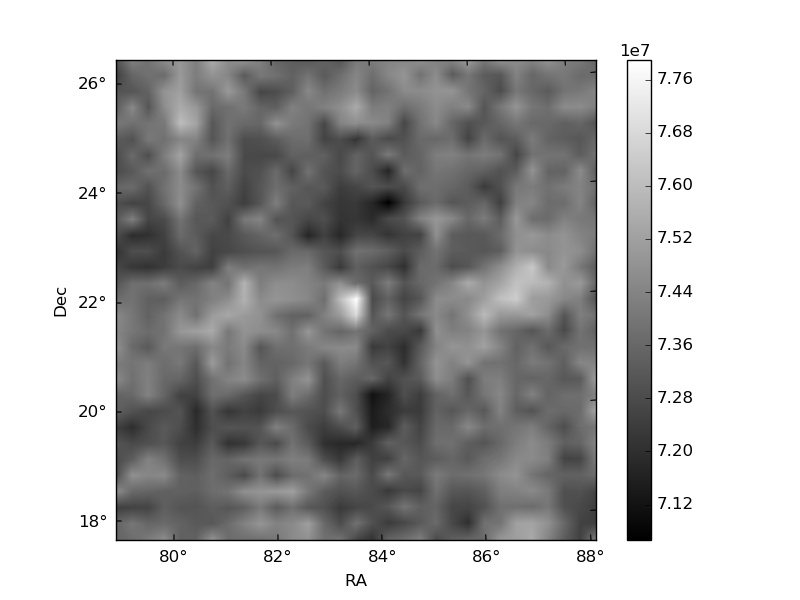
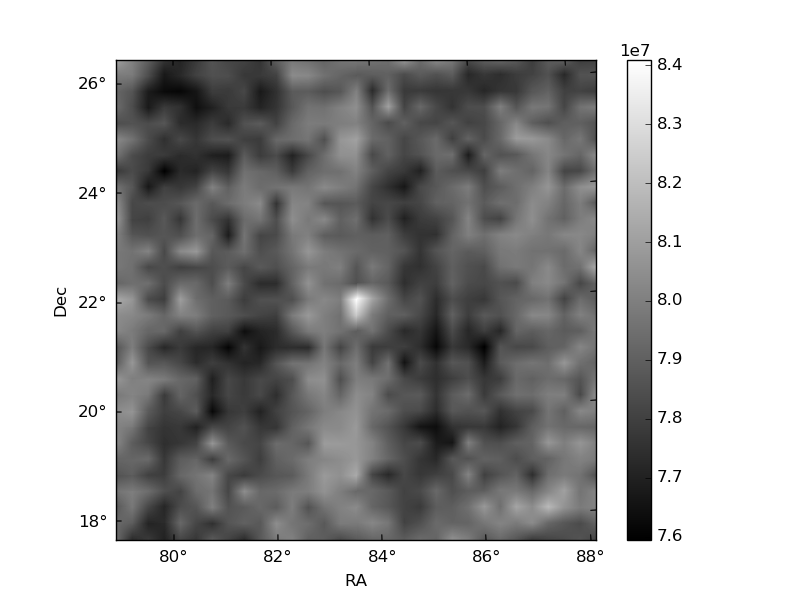
Histogram calculated using DETX and DETY for each event in the final _common_clean file
| Quadrant A | 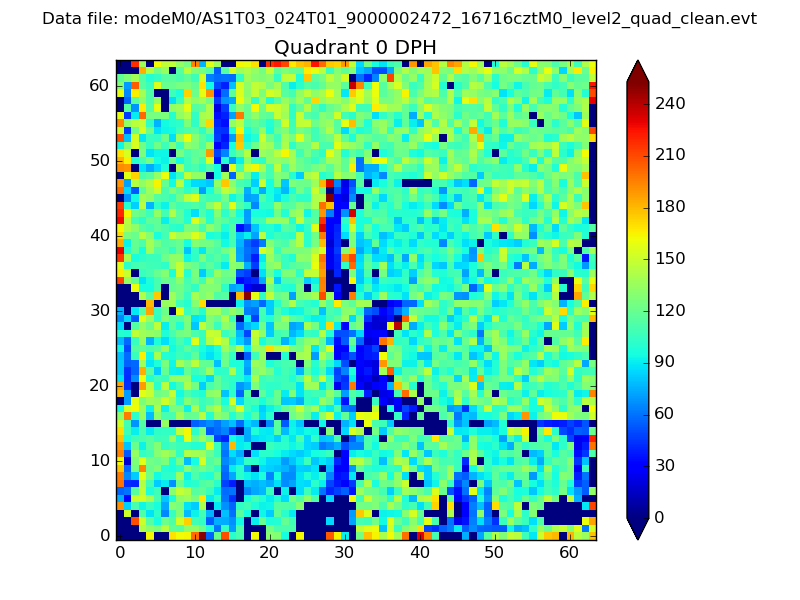 |
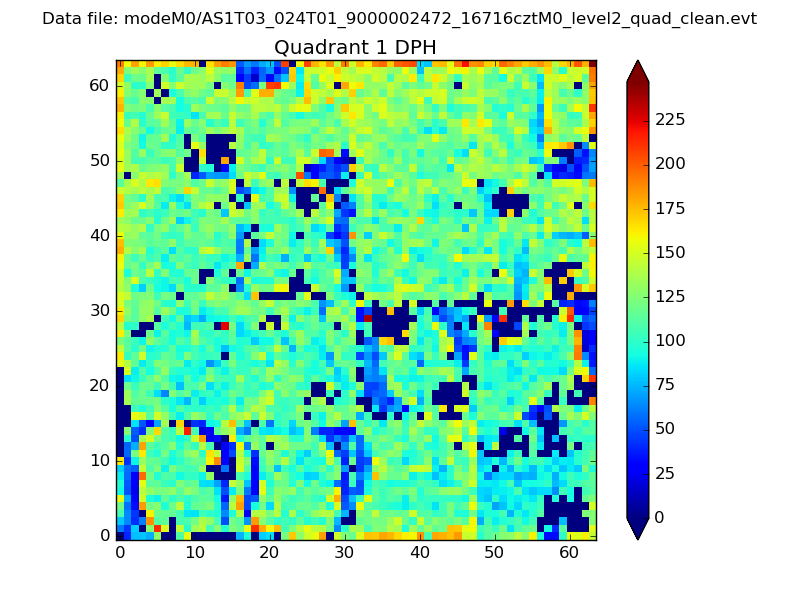 |
Quadrant B |
|---|---|---|---|
| Quadrant D | 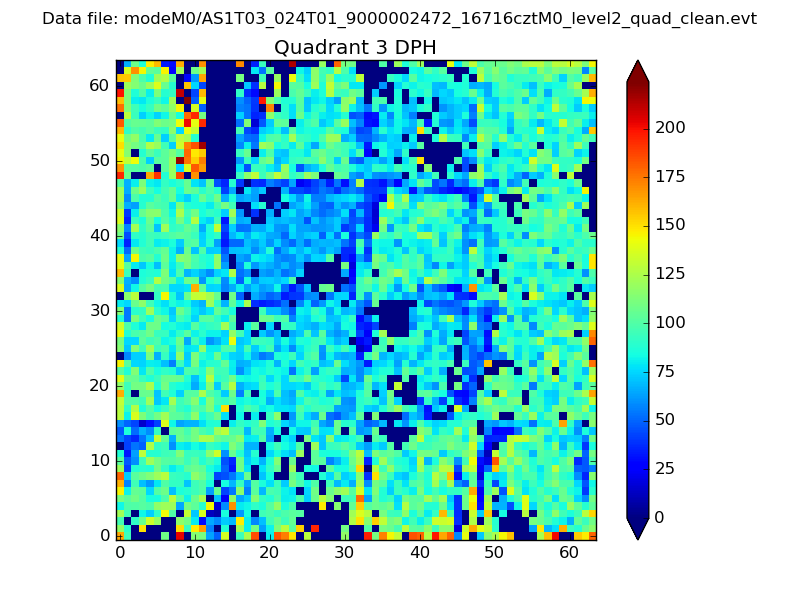 |
 |
Quadrant C |
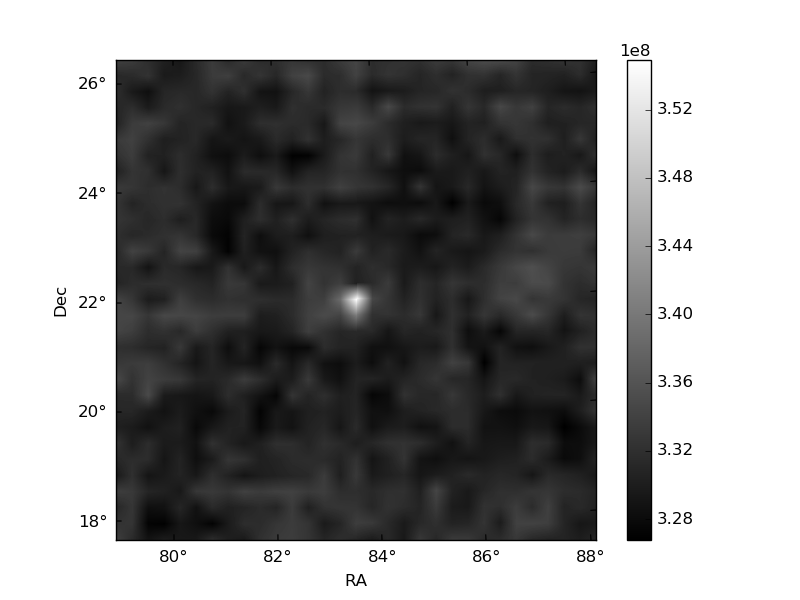
| Plot type | Count rate plots | Images |
|---|---|---|
| Comparison with Poisson distribution Blue bars denote a histogram of data divided into 1 sec bins. Red curve is a Poisson curve with rate = median count rate of data. |
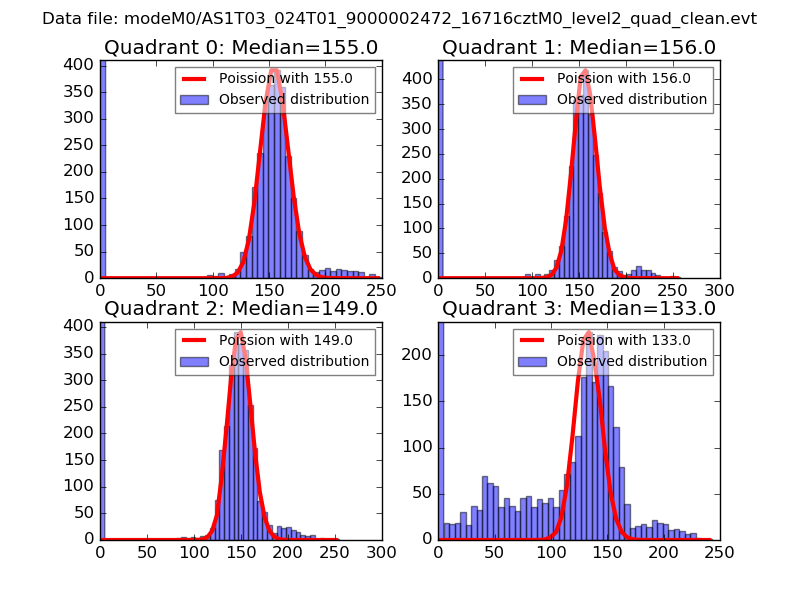 |
 |
| Quadrant-wise count rates Data is divided into 100 sec bins |
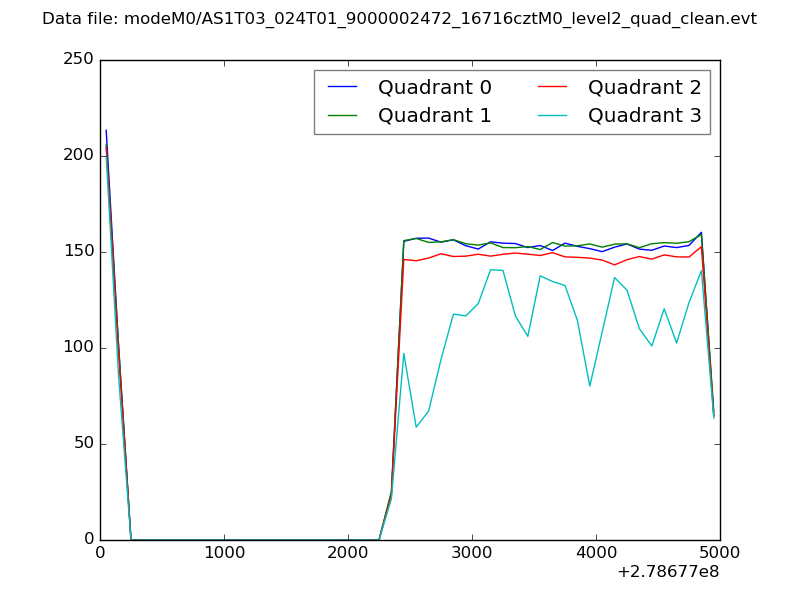 |
|
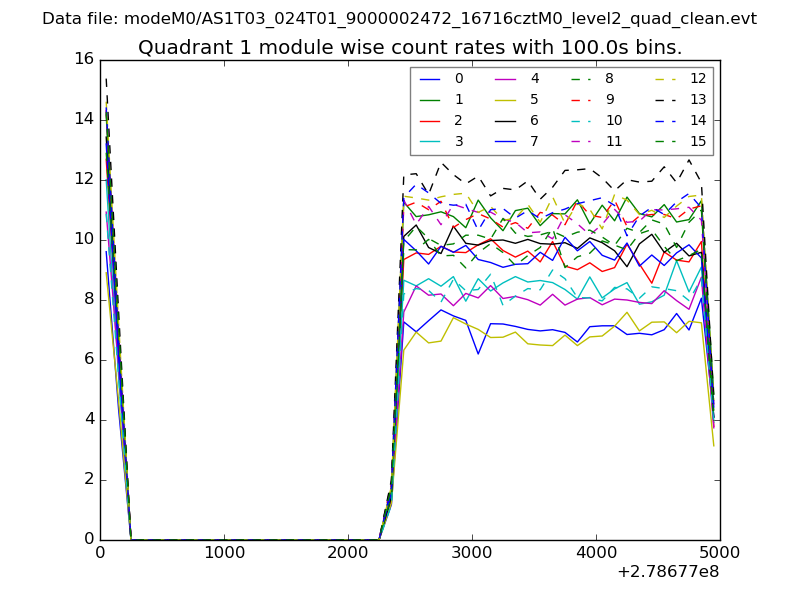
| Module-wise count rates for Quadrant A Data is divided into 100 sec bins |
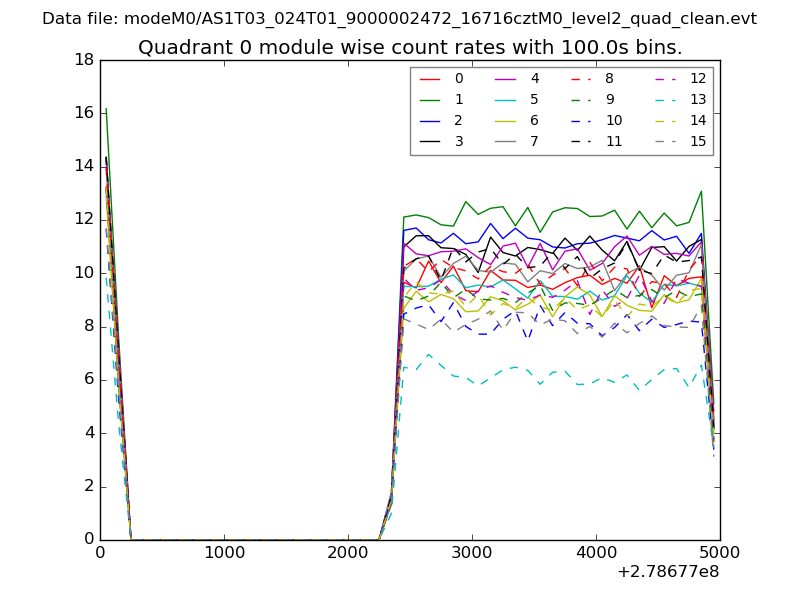 |
 |
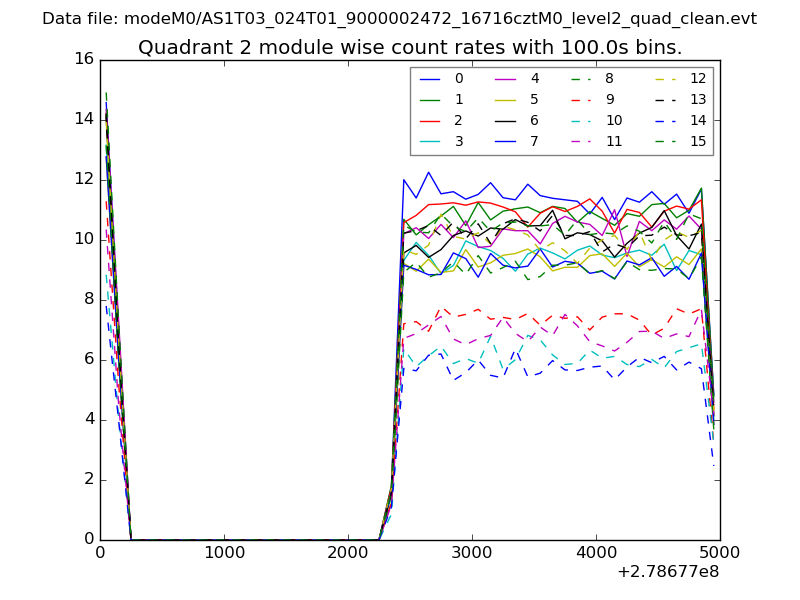
| Module-wise count rates for Quadrant B Data is divided into 100 sec bins |
 |
 |
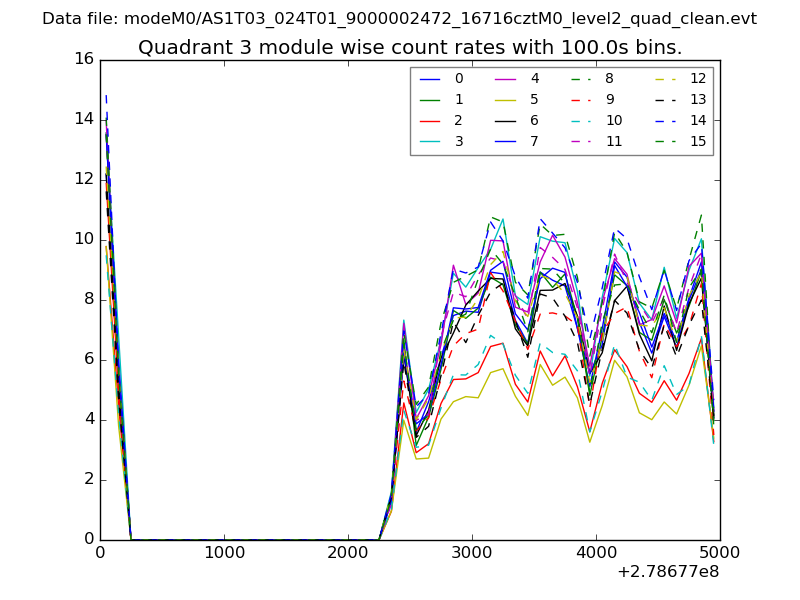
| Module-wise count rates for Quadrant C Data is divided into 100 sec bins |
 |
 |
| Module-wise count rates for Quadrant D Data is divided into 100 sec bins |
 |
 |
| Parameter | Plot |
|---|---|
| CZT HV Monitor | 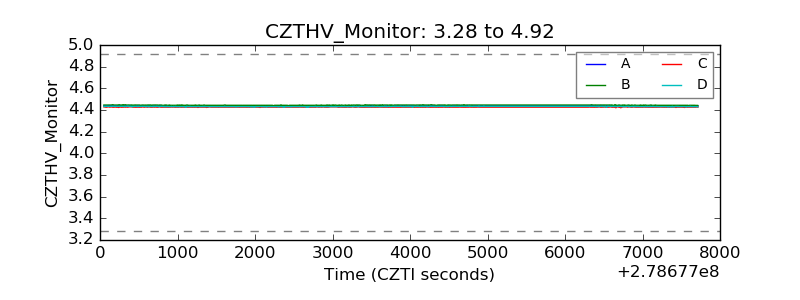 |
| D_VDD | 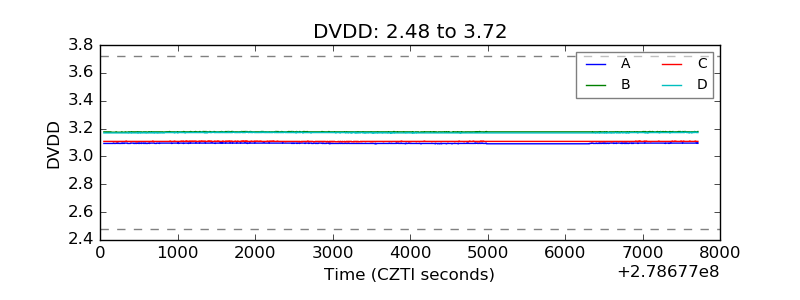 |
| Temperature 1 | 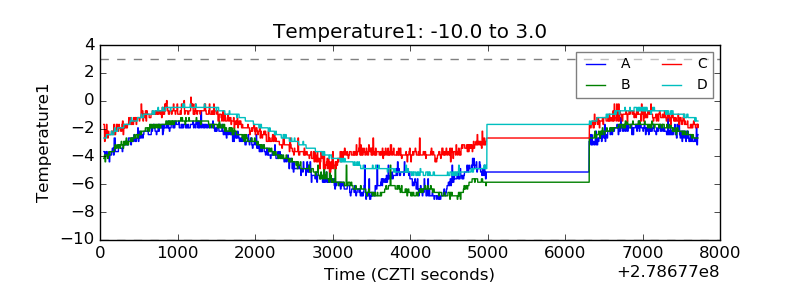 |
| Veto HV Monitor |  |
| Veto LLD | 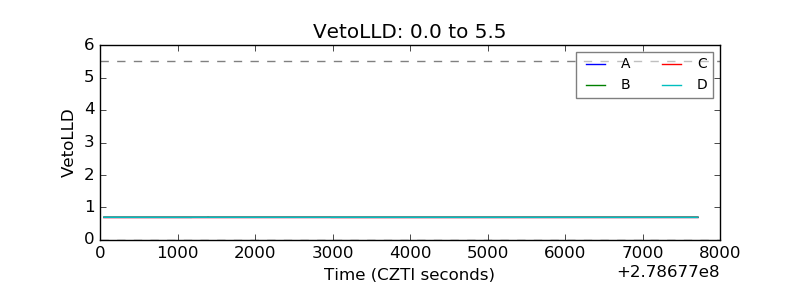 |
| Alpha Counter | 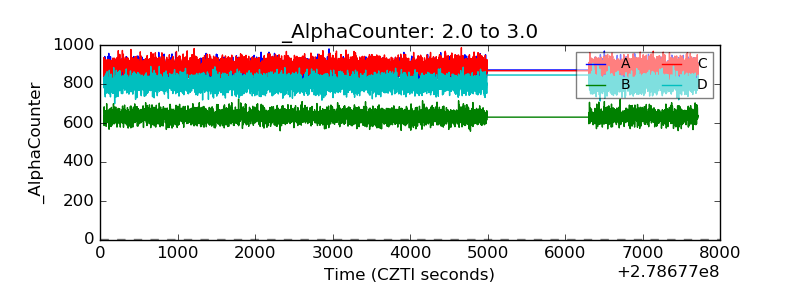 |
| _CPM_Rate | 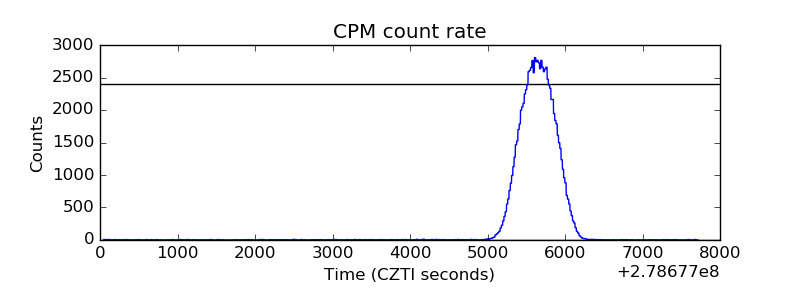 |
| CZT Counter | 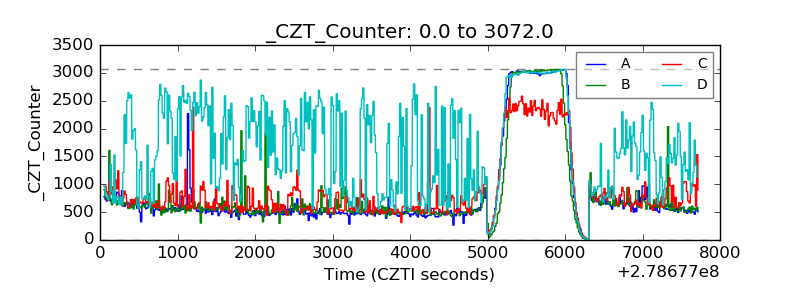 |
| +2.5 Volts monitor |  |
| +5 Volts monitor |  |
| _ROLL_ROT | 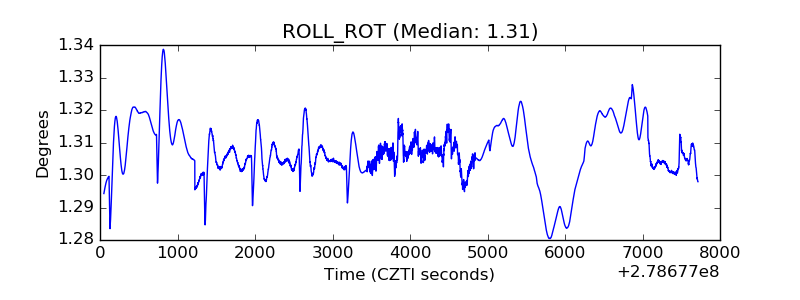 |
| _Roll_DEC | 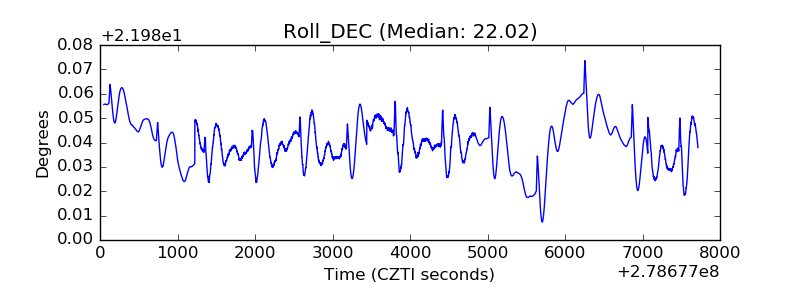 |
| _Roll_RA | 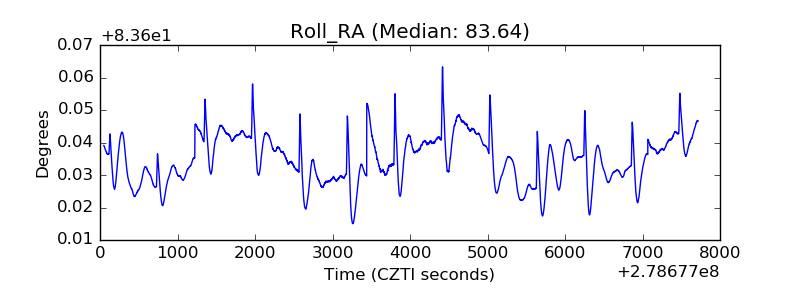 |
| Veto Counter | 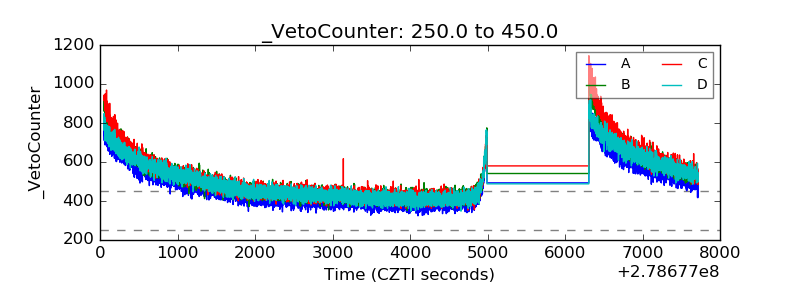 |