| Param | Original file | Final file |
|---|---|---|
| Filename | modeM0/AS1T03_024T01_9000002472_16717cztM0_level2.evt | modeM0/AS1T03_024T01_9000002472_16717cztM0_level2_quad_clean.evt |
| Size (bytes) | 507,712,320 | 61,752,960 |
| Size | 484.2 MB | 58.9 MB |
| Events in quadrant A | 2,450,464 | 410,165 |
| Events in quadrant B | 2,737,578 | 411,346 |
| Events in quadrant C | 3,047,921 | 396,831 |
| Events in quadrant D | 6,831,928 | 331,657 |
| Mode M9 | |||
|---|---|---|---|
| Quadrant | BADHDUFLAG | Total packets | Discarded packets |
| A | 0 | 9 | 0 |
| B | 0 | 9 | 0 |
| C | 0 | 9 | 0 |
| D | 0 | 10 | 0 |
| Mode M0 | |||
|---|---|---|---|
| Quadrant | BADHDUFLAG | Total packets | Discarded packets |
| A | 0 | 10056 | 1 |
| B | 0 | 10958 | 1 |
| C | 0 | 12193 | 1 |
| D | 0 | 23477 | 1 |
| Mode SS | |||
|---|---|---|---|
| Quadrant | BADHDUFLAG | Total packets | Discarded packets |
| A | 0 | 90 | 0 |
| B | 0 | 90 | 0 |
| C | 0 | 90 | 0 |
| D | 0 | 90 | 0 |
| Quadrant | Total seconds | Saturated seconds | Saturation percentage |
|---|---|---|---|
| A | 4545 | 22 | 0.484048% |
| B | 4545 | 37 | 0.814081% |
| C | 4545 | 45 | 0.990099% |
| D | 4545 | 1899 | 41.782178% |
Noise dominated data is calculated using 1-second bins in cleaned event files. If a bin has >2000 counts, and if more than 50% of those come from <1% of pixels, then it is considered to be noise-dominated and hence unusable.
| Quadrant | # 1 sec bins | Bins with >0 counts | Bins with >2000 counts | High rate bins dominated by noise | Noise dominated (total time) | Noise dominated (detector-on time) | Marked lightcurve |
|---|---|---|---|---|---|---|---|
| A | 4546 | 4546 | 3 | 3 | 0.07% | 0.07% | 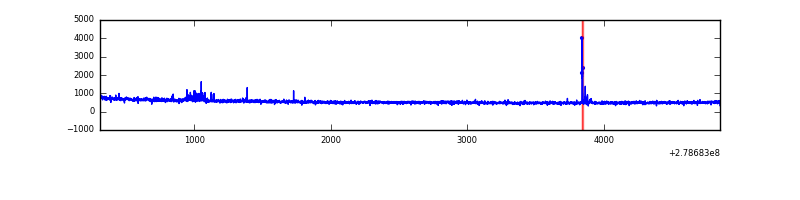 |
| B | 4546 | 4546 | 21 | 21 | 0.46% | 0.46% | 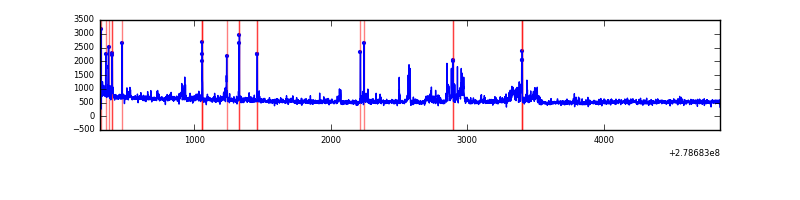 |
| C | 4546 | 4546 | 2 | 2 | 0.04% | 0.04% | 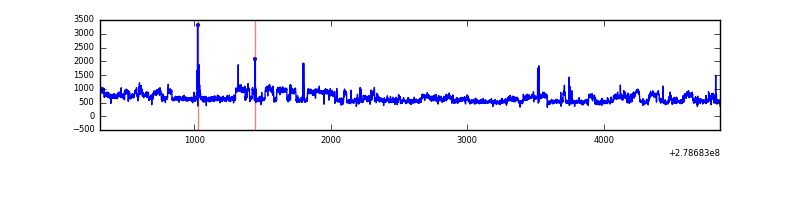 |
| D | 4546 | 4546 | 987 | 987 | 21.71% | 21.71% | 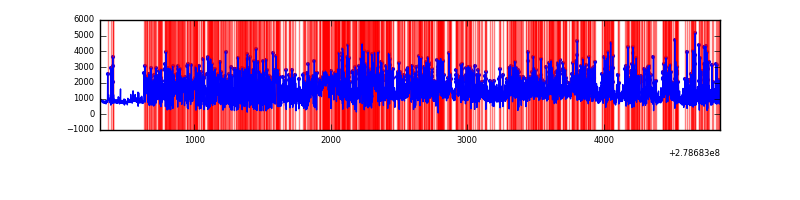 |
Top three noisy pixels from each quadrant. If the there are fewer than three noisy pixels in the level2.evt file, extra rows are filled as -1
| Pixel properties | Quadrant properties | ||||||
|---|---|---|---|---|---|---|---|
| Quadrant | DetID | PixID | Counts | Sigma | Mean | Median | Sigma |
| A | 0 | 23 | 24302 | 188.53 | 624 | 614 | 125.6 |
| A | 15 | 174 | 23932 | 185.58 | 624 | 614 | 125.6 |
| A | 0 | 226 | 6918 | 50.17 | 624 | 614 | 125.6 |
| B | 15 | 35 | 137554 | 1184.08 | 622 | 612 | 115.7 |
| B | 5 | 236 | 57041 | 487.92 | 622 | 612 | 115.7 |
| B | 10 | 16 | 51830 | 442.86 | 622 | 612 | 115.7 |
| C | 3 | 233 | 507735 | 3646.6 | 603 | 612 | 139.1 |
| C | 14 | 238 | 94497 | 675.11 | 603 | 612 | 139.1 |
| C | 0 | 207 | 50729 | 360.38 | 603 | 612 | 139.1 |
| D | 1 | 52 | 4446481 | 38289.97 | 474 | 463 | 116.1 |
| D | 2 | 16 | 335148 | 2882.37 | 474 | 463 | 116.1 |
| D | 11 | 176 | 147246 | 1264.12 | 474 | 463 | 116.1 |
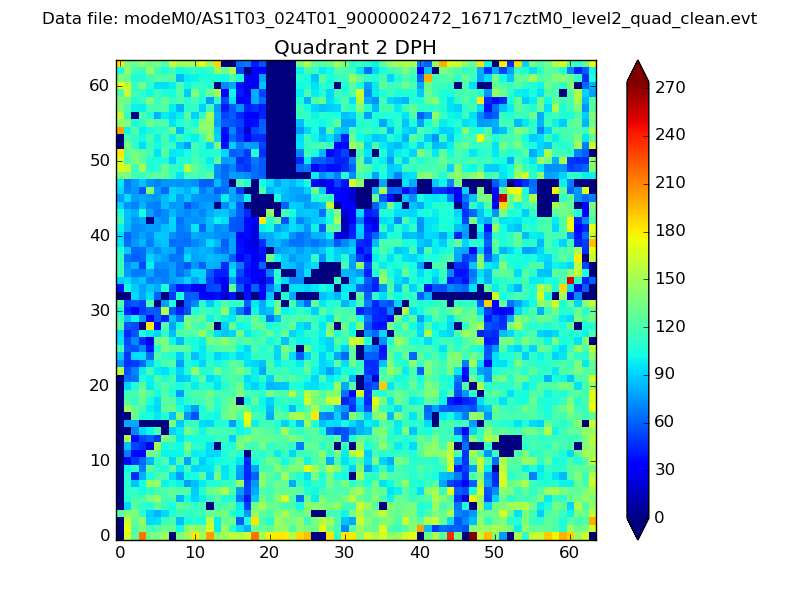
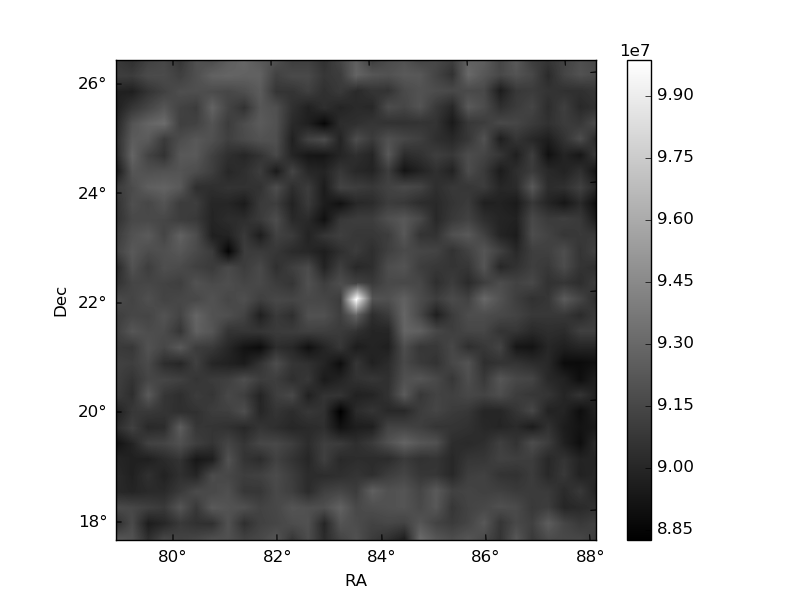
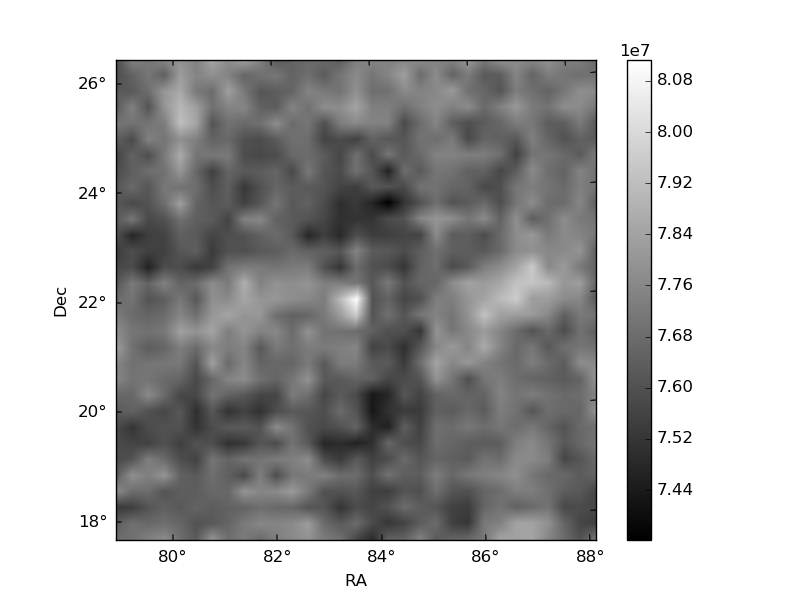
Histogram calculated using DETX and DETY for each event in the final _common_clean file
| Quadrant A | 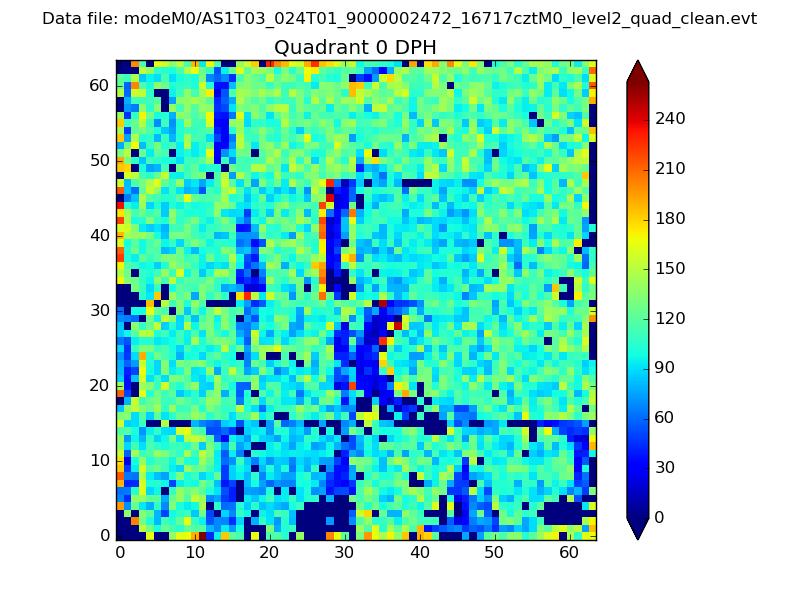 |
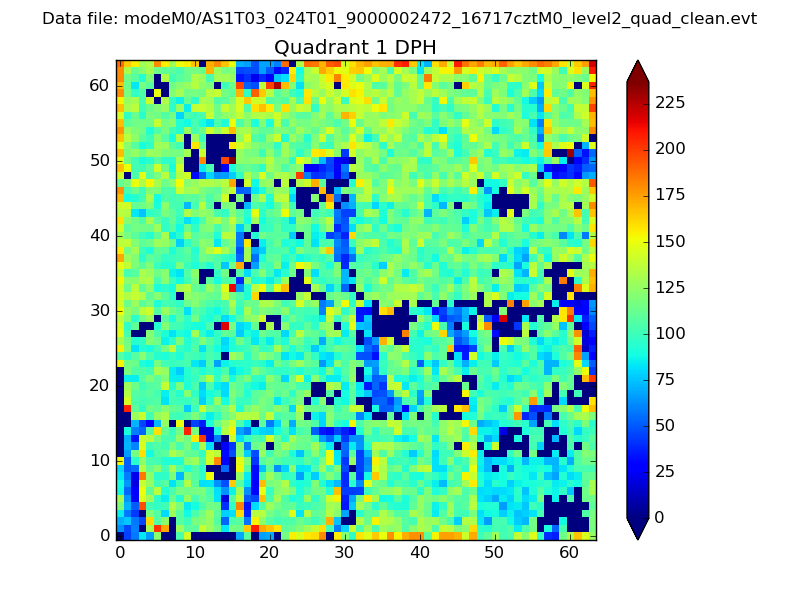 |
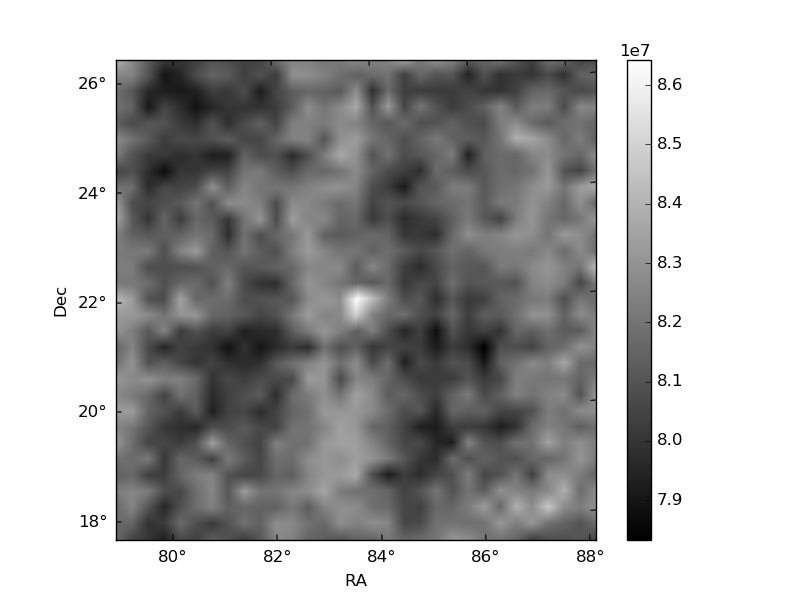
Quadrant B |
|---|---|---|---|
| Quadrant D | 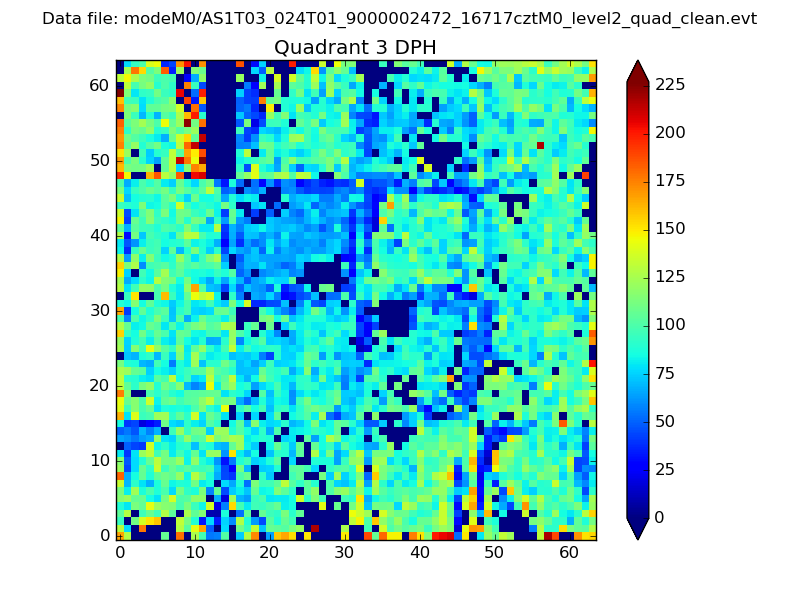 |
 |
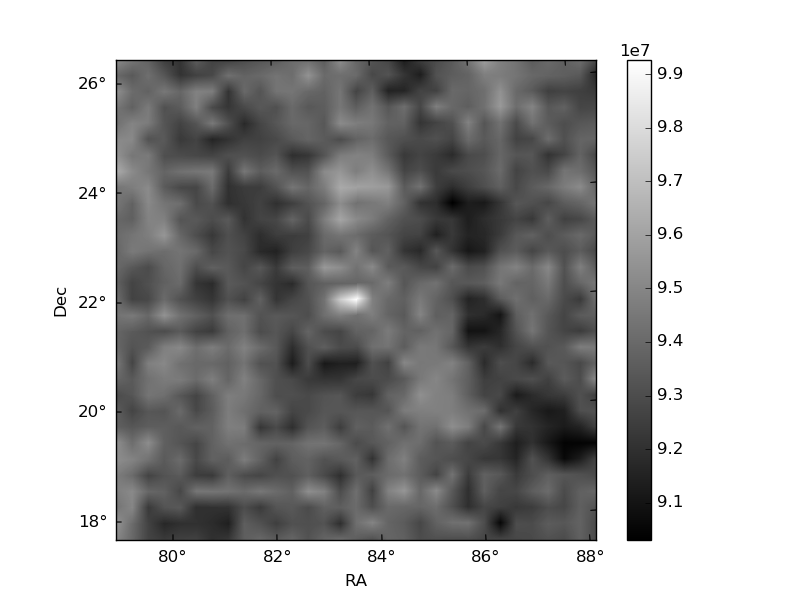
Quadrant C |
| Plot type | Count rate plots | Images |
|---|---|---|
| Comparison with Poisson distribution Blue bars denote a histogram of data divided into 1 sec bins. Red curve is a Poisson curve with rate = median count rate of data. |
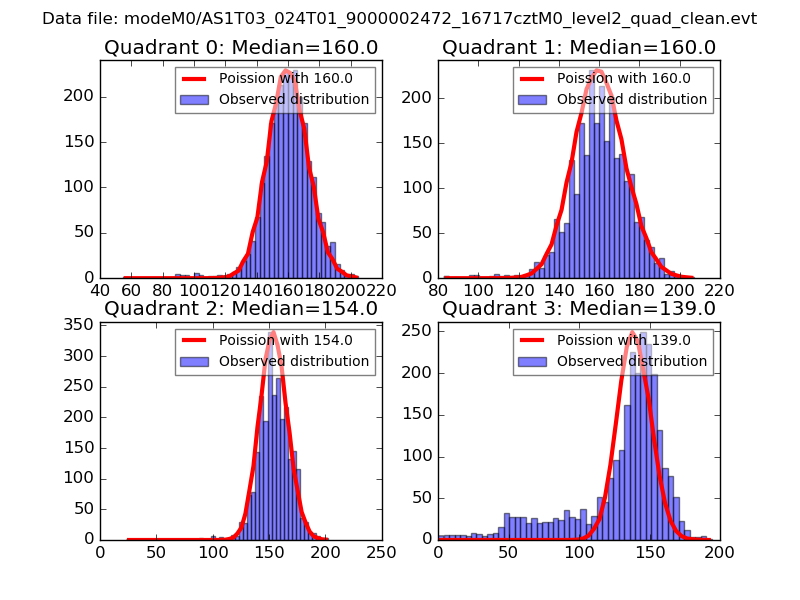 |
 |
| Quadrant-wise count rates Data is divided into 100 sec bins |
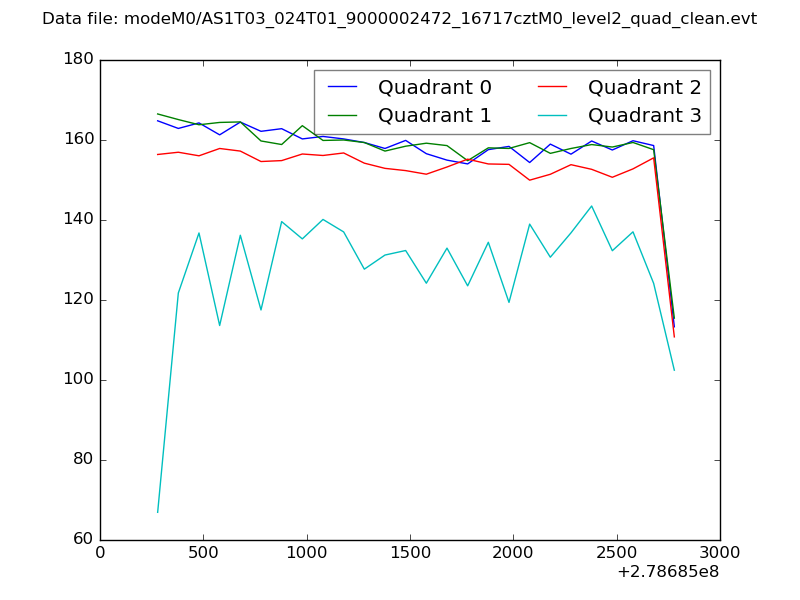 |
|
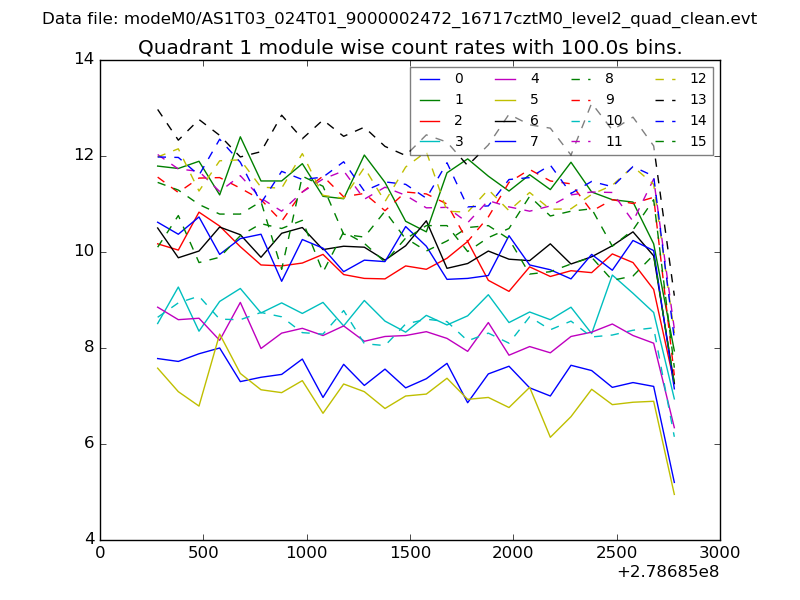
| Module-wise count rates for Quadrant A Data is divided into 100 sec bins |
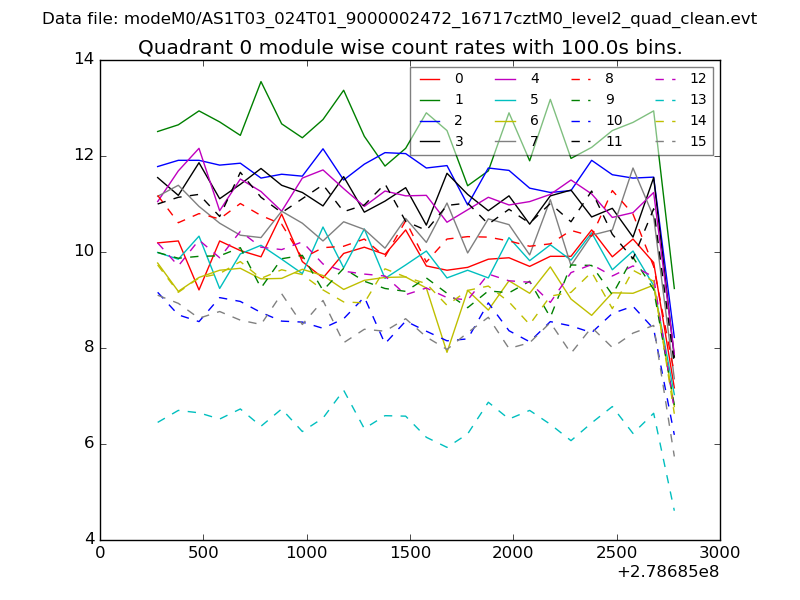 |
 |
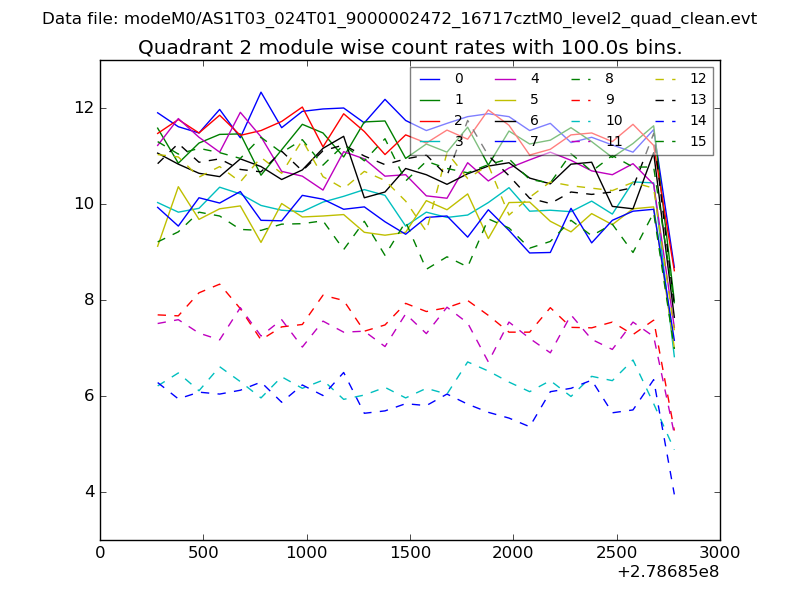
| Module-wise count rates for Quadrant B Data is divided into 100 sec bins |
 |
 |
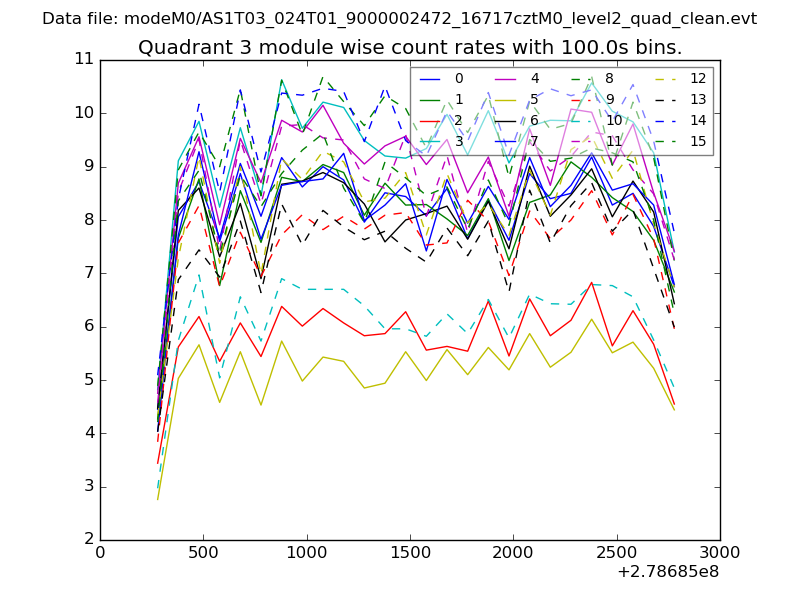
| Module-wise count rates for Quadrant C Data is divided into 100 sec bins |
 |
 |
| Module-wise count rates for Quadrant D Data is divided into 100 sec bins |
 |
 |
| Parameter | Plot |
|---|---|
| CZT HV Monitor | 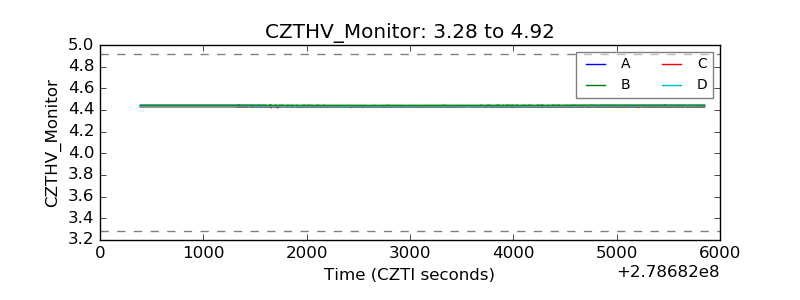 |
| D_VDD | 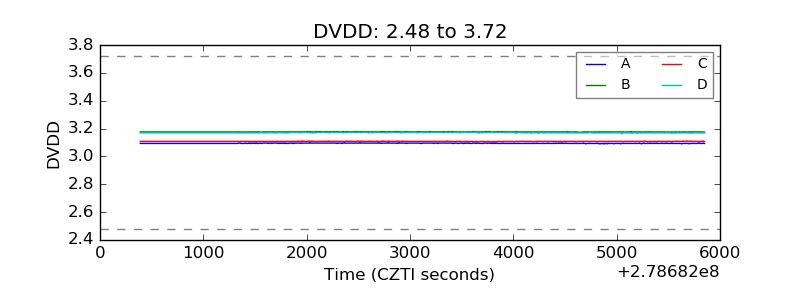 |
| Temperature 1 |  |
| Veto HV Monitor | 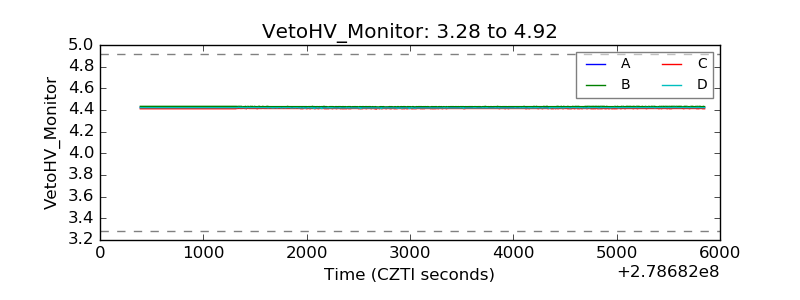 |
| Veto LLD | 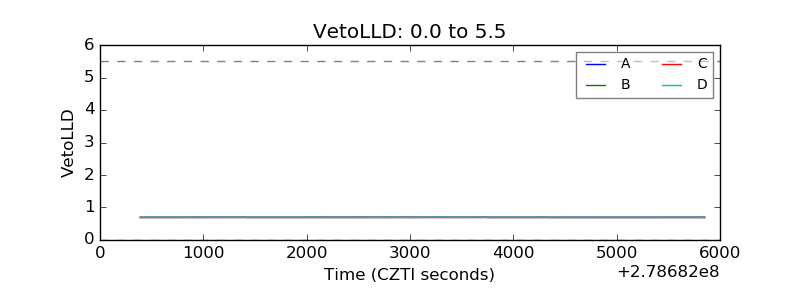 |
| Alpha Counter | 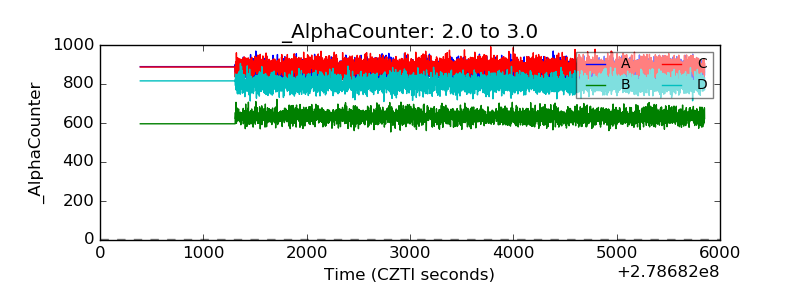 |
| _CPM_Rate | 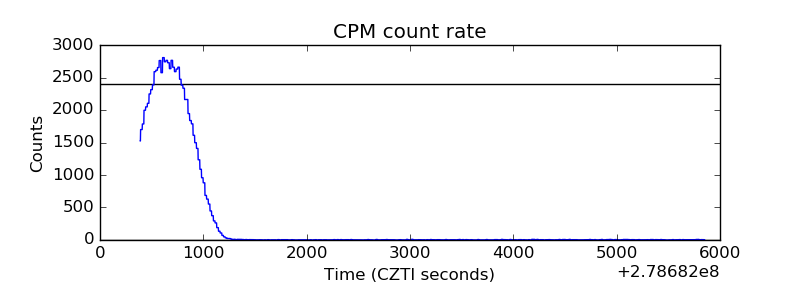 |
| CZT Counter | 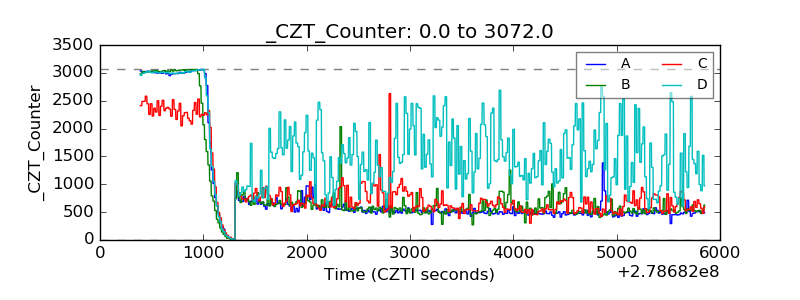 |
| +2.5 Volts monitor |  |
| +5 Volts monitor |  |
| _ROLL_ROT | 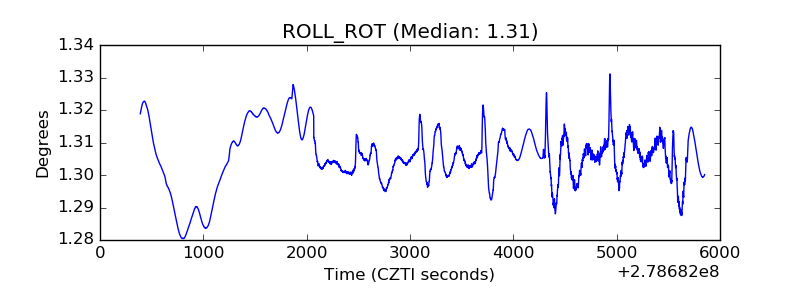 |
| _Roll_DEC |  |
| _Roll_RA | 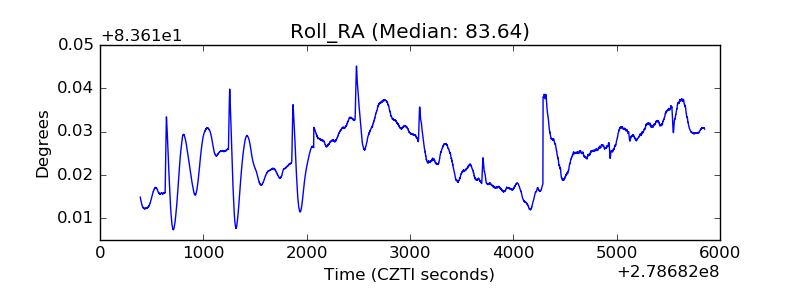 |
| Veto Counter | 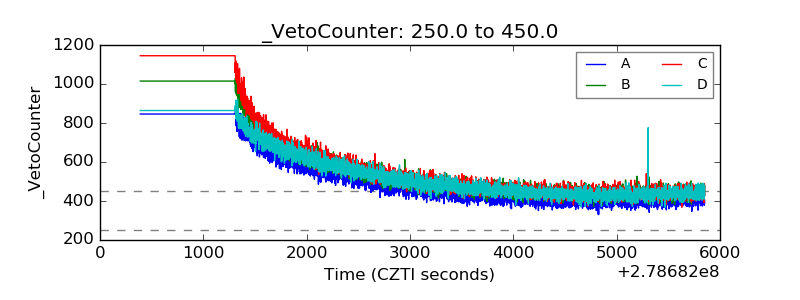 |