| Param | Original file | Final file |
|---|---|---|
| Filename | modeM0/AS1A05_059T03_9000002474cztM0_level2.fits | modeM0/AS1A05_059T03_9000002474cztM0_level2_quad_clean.evt |
| Size (bytes) | 79,629,120 | 29,122,560 |
| Size | 75.9 MB | 27.8 MB |
| Events in quadrant A | 506,982 | 96,036 |
| Events in quadrant B | 489,240 | 97,911 |
| Events in quadrant C | 487,304 | 91,613 |
| Events in quadrant D | 415,666 | 82,571 |
| Mode SS | |||
|---|---|---|---|
| Quadrant | BADHDUFLAG | Total packets | Discarded packets |
| A | 0 | 150 | 0 |
| B | 0 | 150 | 0 |
| C | 0 | 150 | 0 |
| D | 0 | 150 | 0 |
| Mode M9 | |||
|---|---|---|---|
| Quadrant | BADHDUFLAG | Total packets | Discarded packets |
| A | 0 | 18 | 0 |
| B | 0 | 18 | 0 |
| C | 0 | 18 | 0 |
| D | 0 | 18 | 0 |
| Mode M0 | |||
|---|---|---|---|
| Quadrant | BADHDUFLAG | Total packets | Discarded packets |
| A | 0 | 18840 | 0 |
| B | 0 | 17519 | 0 |
| C | 0 | 17048 | 0 |
| D | 0 | 22014 | 0 |
| Quadrant | Total seconds | Saturated seconds | Saturation percentage |
|---|---|---|---|
| A | 7358 | 299 | 4.063604% |
| B | 7358 | 114 | 1.549334% |
| C | 7358 | 132 | 1.793966% |
| D | 7358 | 528 | 7.175863% |
Noise dominated data is calculated using 1-second bins in cleaned event files. If a bin has >2000 counts, and if more than 50% of those come from <1% of pixels, then it is considered to be noise-dominated and hence unusable.
| Quadrant | # 1 sec bins | Bins with >0 counts | Bins with >2000 counts | High rate bins dominated by noise | Noise dominated (total time) | Noise dominated (detector-on time) | Marked lightcurve |
|---|---|---|---|---|---|---|---|
| A | 8712 | 7355 | 0 | 0 | 0.00% | 0.00% |  |
| B | 8712 | 7357 | 0 | 0 | 0.00% | 0.00% |  |
| C | 8712 | 7357 | 0 | 0 | 0.00% | 0.00% |  |
| D | 8712 | 7356 | 0 | 0 | 0.00% | 0.00% |  |
Top three noisy pixels from each quadrant. If the there are fewer than three noisy pixels in the level2.evt file, extra rows are filled as -1
| Pixel properties | Quadrant properties | ||||||
|---|---|---|---|---|---|---|---|
| Quadrant | DetID | PixID | Counts | Sigma | Mean | Median | Sigma |
| A | 0 | 29 | 493 | 11.09 | 132 | 126 | 33.1 |
| A | 0 | 30 | 414 | 8.71 | 132 | 126 | 33.1 |
| A | 7 | 110 | 372 | 7.44 | 132 | 126 | 33.1 |
| B | 2 | 9 | 363 | 8.76 | 130 | 126 | 27.1 |
| B | 12 | 226 | 326 | 7.39 | 130 | 126 | 27.1 |
| B | 5 | 255 | 319 | 7.13 | 130 | 126 | 27.1 |
| C | 12 | 241 | 346 | 6.51 | 128 | 122 | 34.3 |
| C | 3 | 158 | 334 | 6.16 | 128 | 122 | 34.3 |
| C | 3 | 126 | 334 | 6.16 | 128 | 122 | 34.3 |
| D | 10 | 189 | 312 | 6.1 | 118 | 108 | 33.5 |
| D | 6 | 38 | 312 | 6.1 | 118 | 108 | 33.5 |
| D | 1 | 19 | 309 | 6.01 | 118 | 108 | 33.5 |
Histogram calculated using DETX and DETY for each event in the final _common_clean file
| Quadrant A | 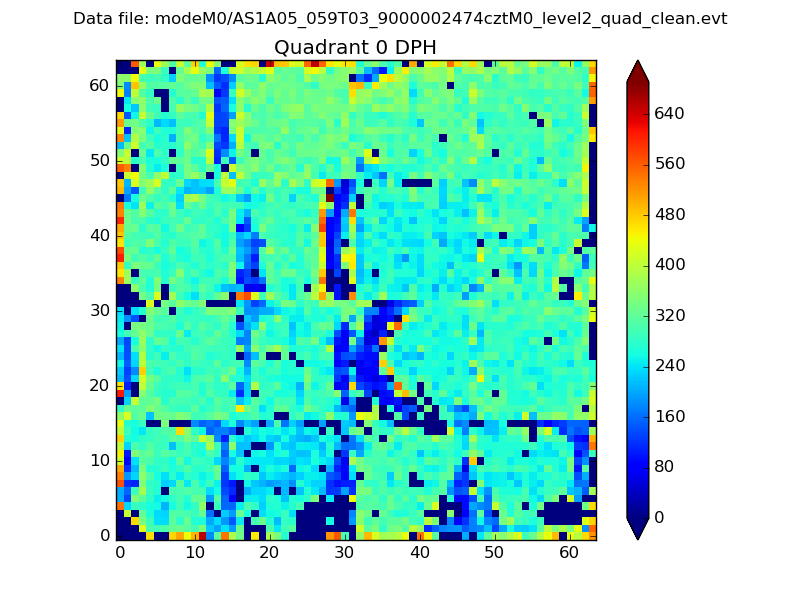 |
 |
Quadrant B |
|---|---|---|---|
| Quadrant D | 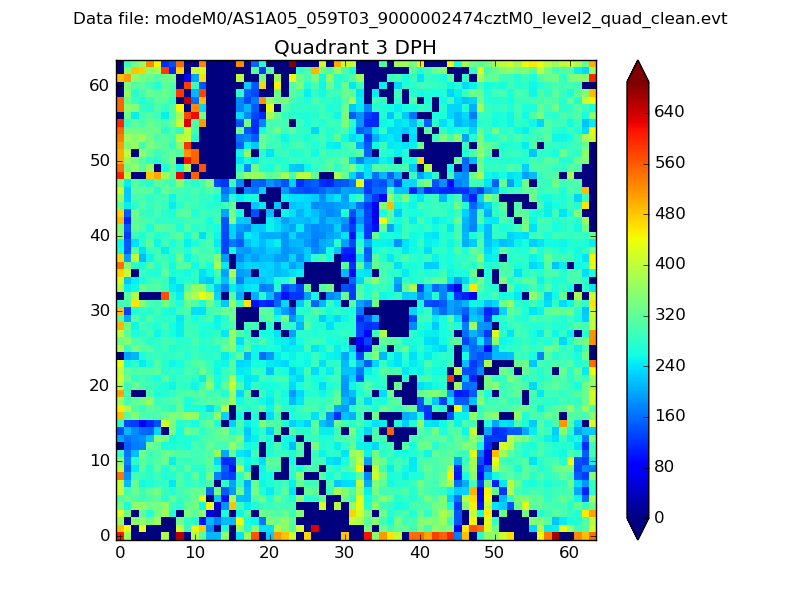 |
 |
Quadrant C |
| Plot type | Count rate plots | Images |
|---|---|---|
| Comparison with Poisson distribution Blue bars denote a histogram of data divided into 1 sec bins. Red curve is a Poisson curve with rate = median count rate of data. |
 |
 |
| Quadrant-wise count rates Data is divided into 100 sec bins |
 |
|
| Module-wise count rates for Quadrant A Data is divided into 100 sec bins |
 |
 |
| Module-wise count rates for Quadrant B Data is divided into 100 sec bins |
 |
 |
| Module-wise count rates for Quadrant C Data is divided into 100 sec bins |
 |
 |
| Module-wise count rates for Quadrant D Data is divided into 100 sec bins |
 |
 |
| Parameter | Plot |
|---|---|
| CZT HV Monitor |  |
| D_VDD |  |
| Temperature 1 |  |
| Veto HV Monitor |  |
| Veto LLD |  |
| Alpha Counter |  |
| _CPM_Rate |  |
| CZT Counter |  |
| +2.5 Volts monitor |  |
| +5 Volts monitor |  |
| _ROLL_ROT |  |
| _Roll_DEC |  |
| _Roll_RA |  |
| Veto Counter |  |