| Param | Original file | Final file |
|---|---|---|
| Filename | modeM0/AS1A05_059T03_9000002474_16717cztM0_level2.evt | modeM0/AS1A05_059T03_9000002474_16717cztM0_level2_quad_clean.evt |
| Size (bytes) | 153,743,040 | 35,179,200 |
| Size | 146.6 MB | 33.5 MB |
| Events in quadrant A | 1,045,076 | 242,743 |
| Events in quadrant B | 973,114 | 255,136 |
| Events in quadrant C | 930,388 | 242,630 |
| Events in quadrant D | 1,607,565 | 217,569 |
| Mode SS | |||
|---|---|---|---|
| Quadrant | BADHDUFLAG | Total packets | Discarded packets |
| A | 0 | 28 | 0 |
| B | 0 | 28 | 0 |
| C | 0 | 28 | 0 |
| D | 0 | 28 | 0 |
| Mode M9 | |||
|---|---|---|---|
| Quadrant | BADHDUFLAG | Total packets | Discarded packets |
| A | 0 | 5 | 0 |
| B | 0 | 5 | 0 |
| C | 0 | 5 | 0 |
| D | 0 | 5 | 0 |
| Mode M0 | |||
|---|---|---|---|
| Quadrant | BADHDUFLAG | Total packets | Discarded packets |
| A | 0 | 4116 | 2 |
| B | 0 | 4015 | 1 |
| C | 0 | 3853 | 1 |
| D | 0 | 5764 | 1 |
| Quadrant | Total seconds | Saturated seconds | Saturation percentage |
|---|---|---|---|
| A | 1439 | 100 | 6.949270% |
| B | 1439 | 22 | 1.528839% |
| C | 1439 | 18 | 1.250869% |
| D | 1439 | 245 | 17.025712% |
Noise dominated data is calculated using 1-second bins in cleaned event files. If a bin has >2000 counts, and if more than 50% of those come from <1% of pixels, then it is considered to be noise-dominated and hence unusable.
| Quadrant | # 1 sec bins | Bins with >0 counts | Bins with >2000 counts | High rate bins dominated by noise | Noise dominated (total time) | Noise dominated (detector-on time) | Marked lightcurve |
|---|---|---|---|---|---|---|---|
| A | 1440 | 1440 | 58 | 58 | 4.03% | 4.03% | 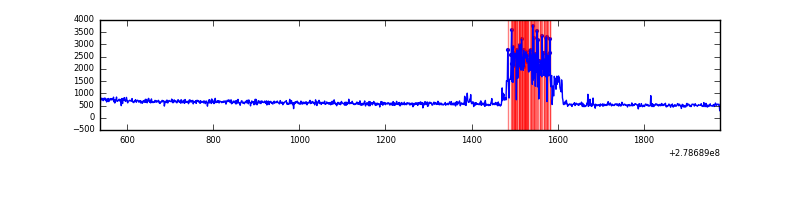 |
| B | 1440 | 1440 | 3 | 3 | 0.21% | 0.21% | 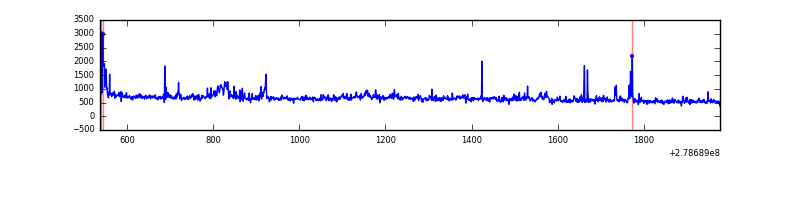 |
| C | 1440 | 1440 | 0 | 0 | 0.00% | 0.00% | 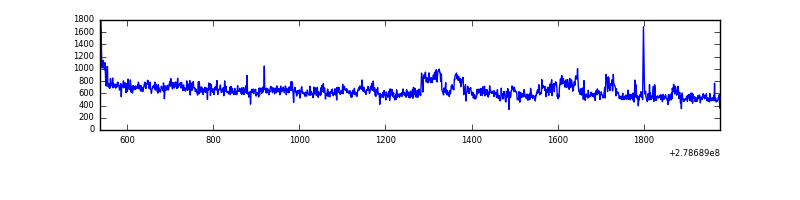 |
| D | 1440 | 1440 | 146 | 146 | 10.14% | 10.14% | 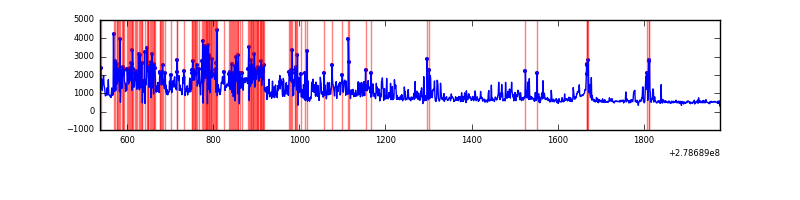 |
Top three noisy pixels from each quadrant. If the there are fewer than three noisy pixels in the level2.evt file, extra rows are filled as -1
| Pixel properties | Quadrant properties | ||||||
|---|---|---|---|---|---|---|---|
| Quadrant | DetID | PixID | Counts | Sigma | Mean | Median | Sigma |
| A | 15 | 174 | 225377 | 5147.0 | 213 | 209 | 43.7 |
| A | 0 | 226 | 2075 | 42.64 | 213 | 209 | 43.7 |
| A | 12 | 194 | 1620 | 32.24 | 213 | 209 | 43.7 |
| B | 5 | 236 | 28611 | 686.79 | 214 | 210 | 41.4 |
| B | 0 | 189 | 27222 | 653.2 | 214 | 210 | 41.4 |
| B | 3 | 209 | 19410 | 464.29 | 214 | 210 | 41.4 |
| C | 3 | 233 | 83063 | 1757.44 | 203 | 204 | 47.1 |
| C | 14 | 238 | 32364 | 682.11 | 203 | 204 | 47.1 |
| C | 0 | 207 | 11964 | 249.43 | 203 | 204 | 47.1 |
| D | 1 | 52 | 440516 | 8869.05 | 197 | 191 | 49.6 |
| D | 5 | 222 | 234653 | 4722.55 | 197 | 191 | 49.6 |
| D | 11 | 176 | 109538 | 2202.47 | 197 | 191 | 49.6 |
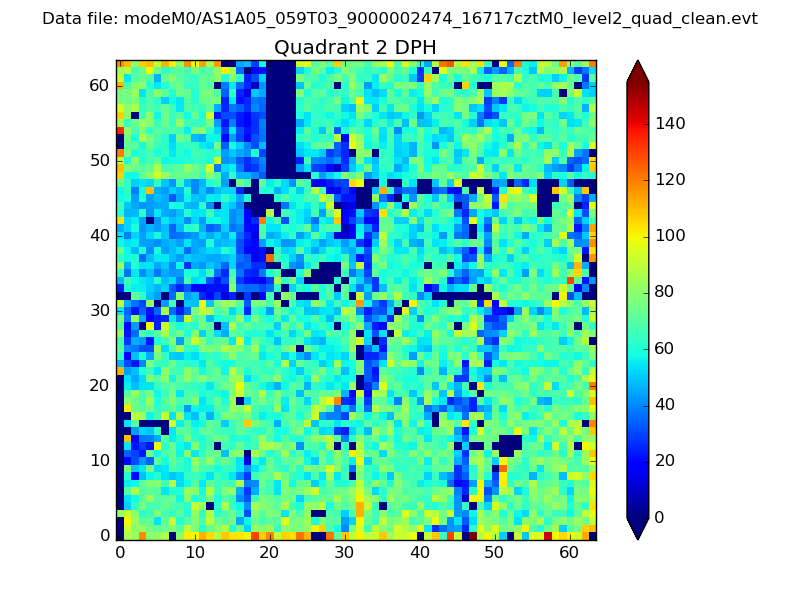
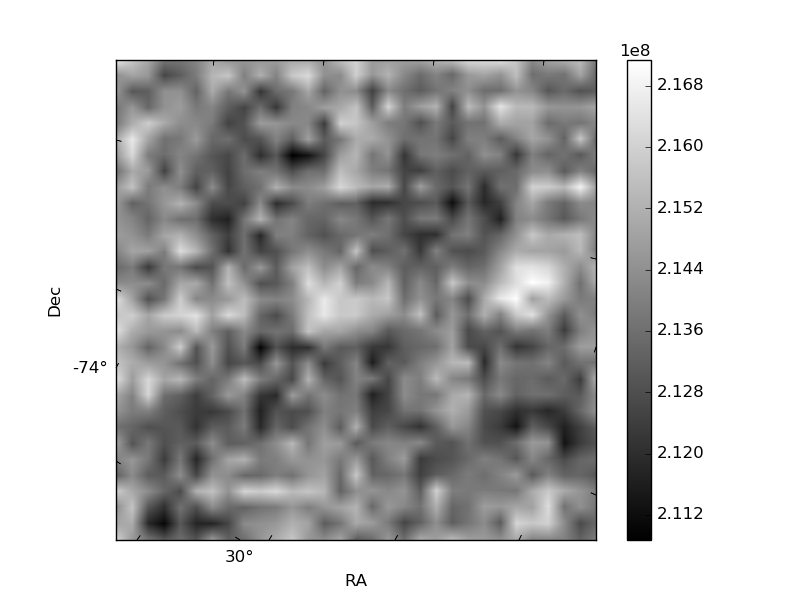
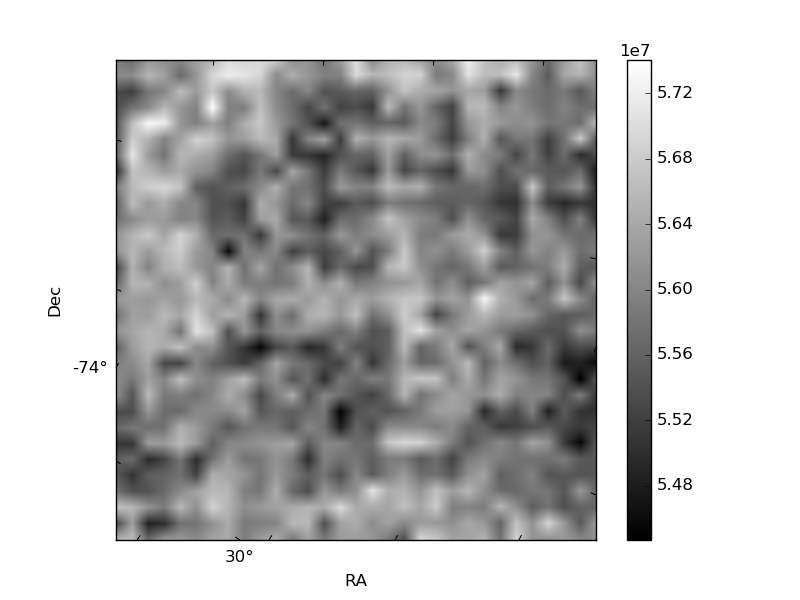
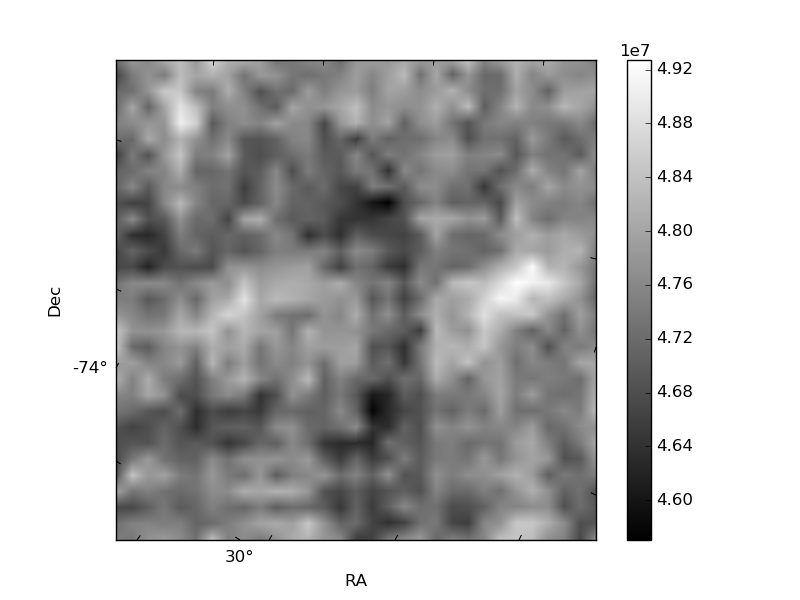
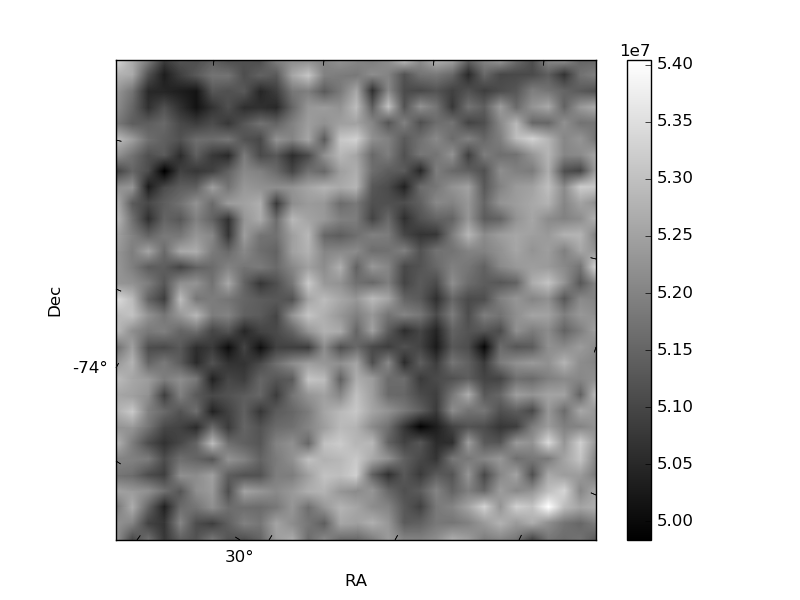
Histogram calculated using DETX and DETY for each event in the final _common_clean file
| Quadrant A | 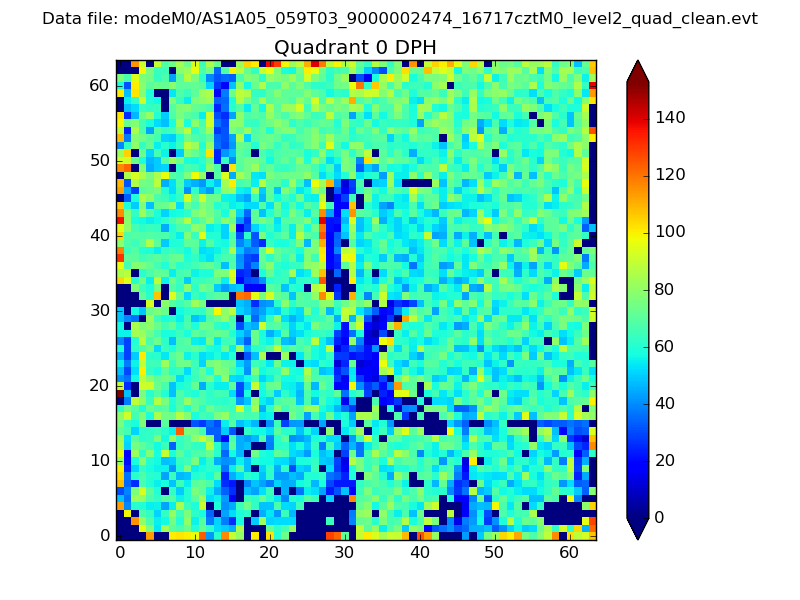 |
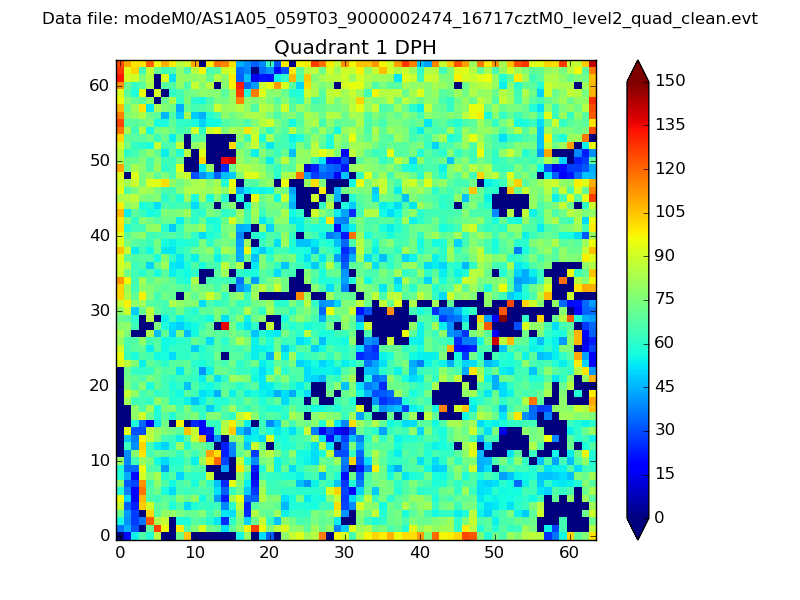 |
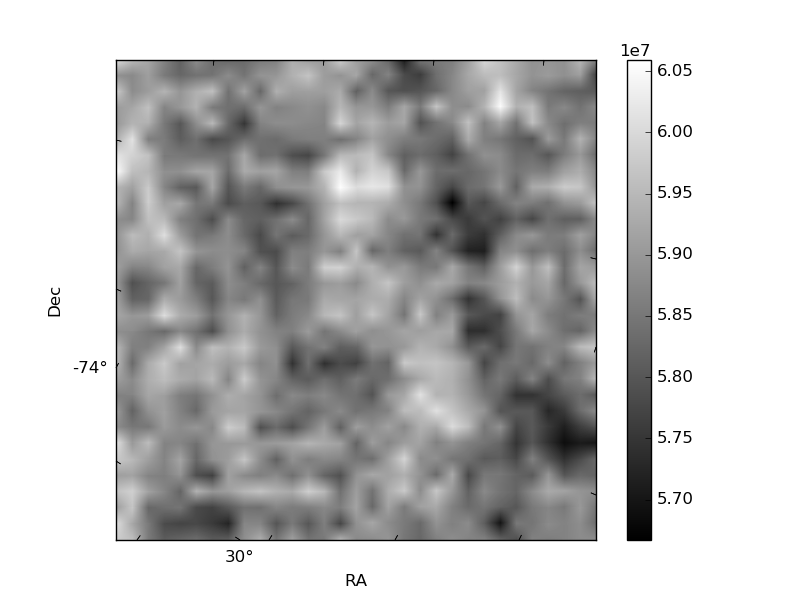
Quadrant B |
|---|---|---|---|
| Quadrant D | 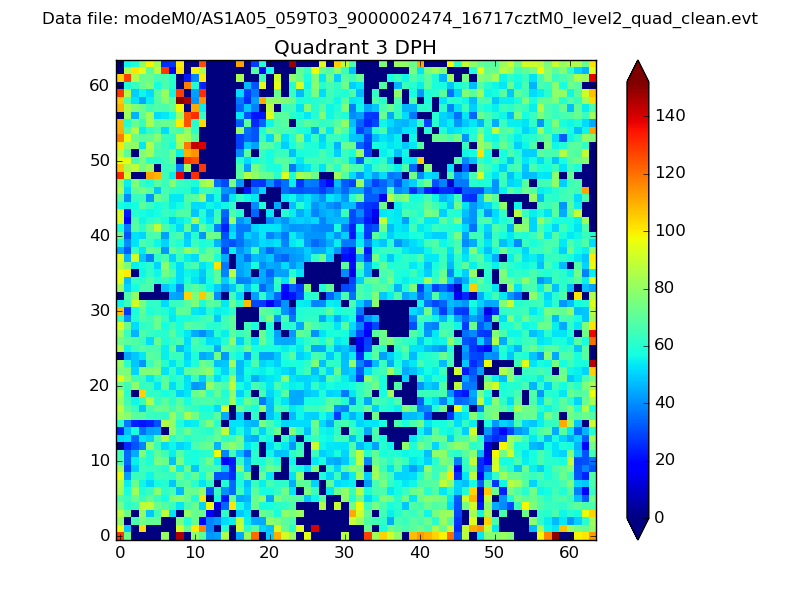 |
 |
Quadrant C |
| Plot type | Count rate plots | Images |
|---|---|---|
| Comparison with Poisson distribution Blue bars denote a histogram of data divided into 1 sec bins. Red curve is a Poisson curve with rate = median count rate of data. |
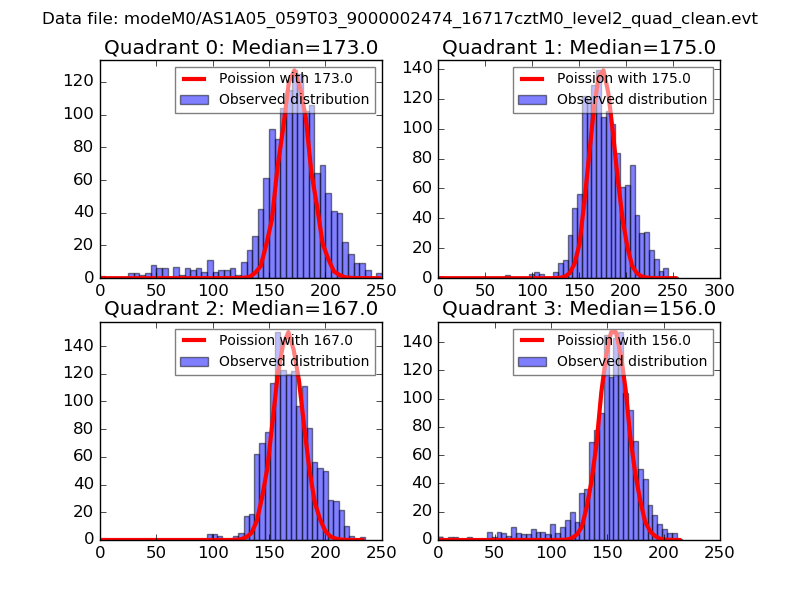 |
 |
| Quadrant-wise count rates Data is divided into 100 sec bins |
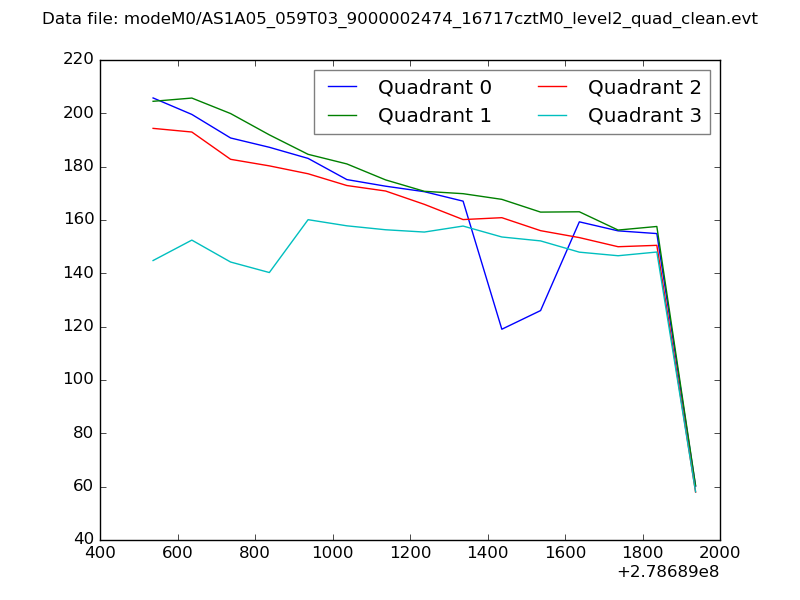 |
|
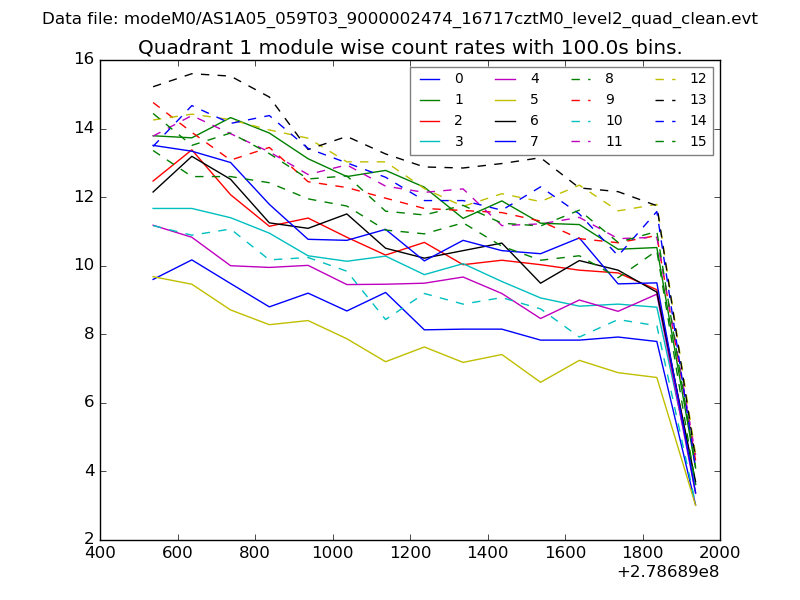
| Module-wise count rates for Quadrant A Data is divided into 100 sec bins |
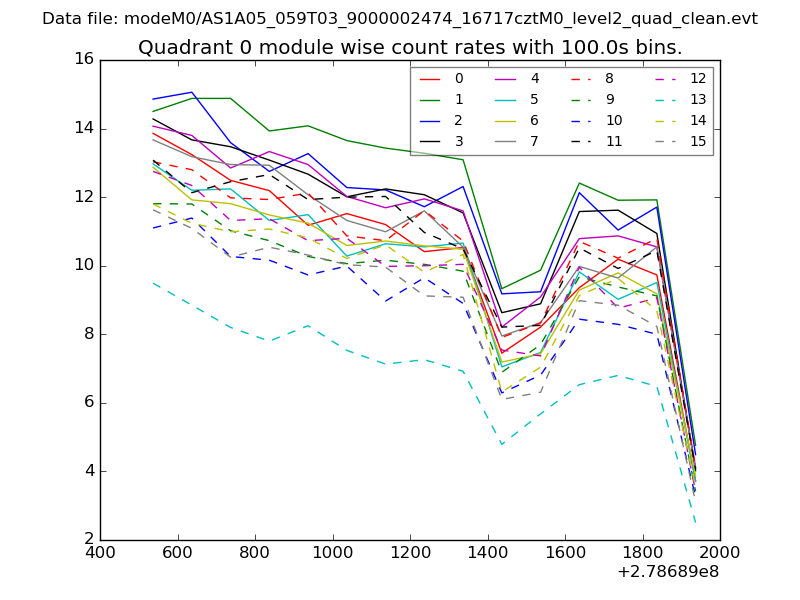 |
 |
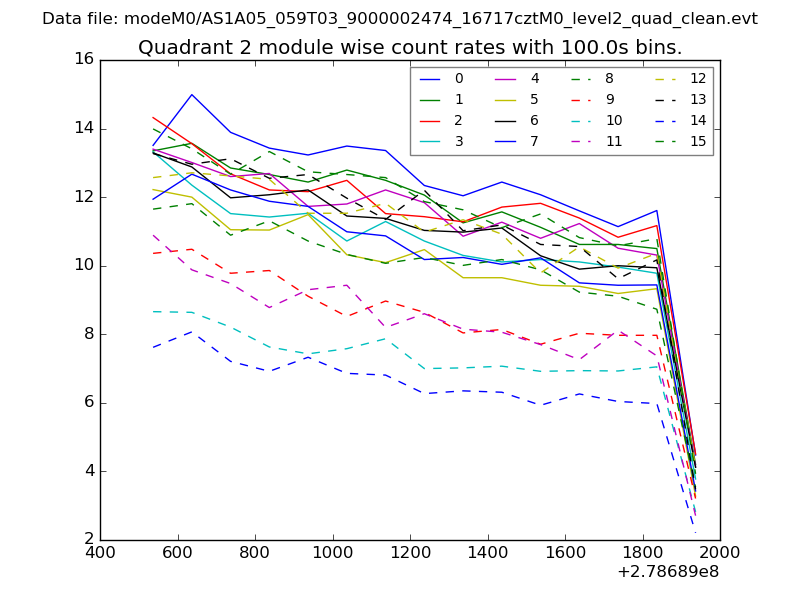
| Module-wise count rates for Quadrant B Data is divided into 100 sec bins |
 |
 |
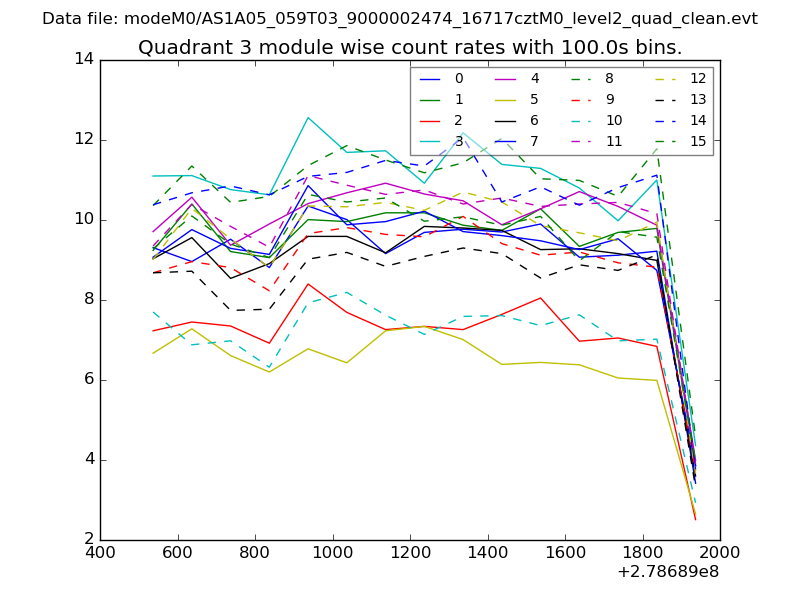
| Module-wise count rates for Quadrant C Data is divided into 100 sec bins |
 |
 |
| Module-wise count rates for Quadrant D Data is divided into 100 sec bins |
 |
 |
| Parameter | Plot |
|---|---|
| CZT HV Monitor | 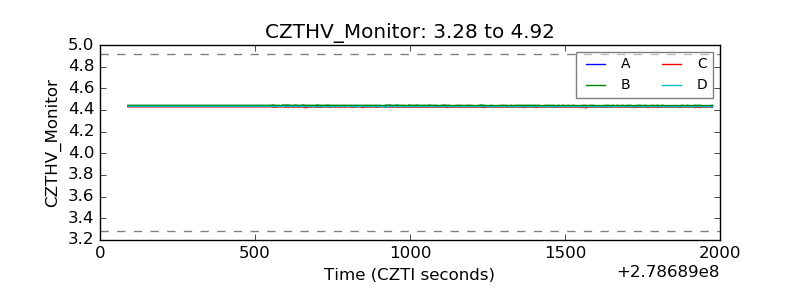 |
| D_VDD | 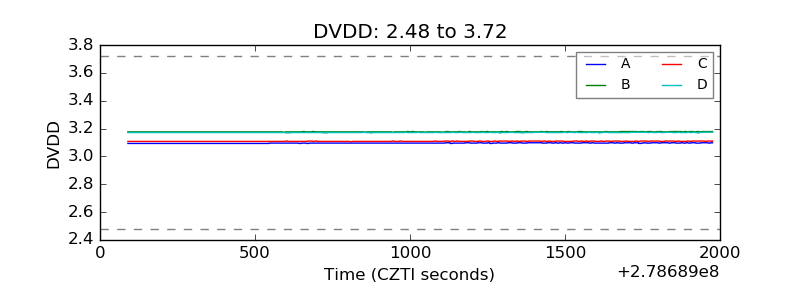 |
| Temperature 1 | 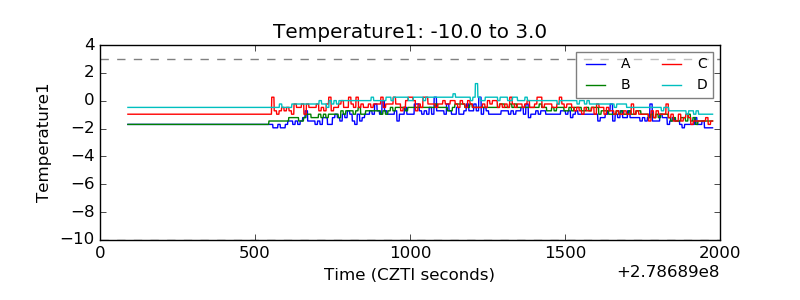 |
| Veto HV Monitor | 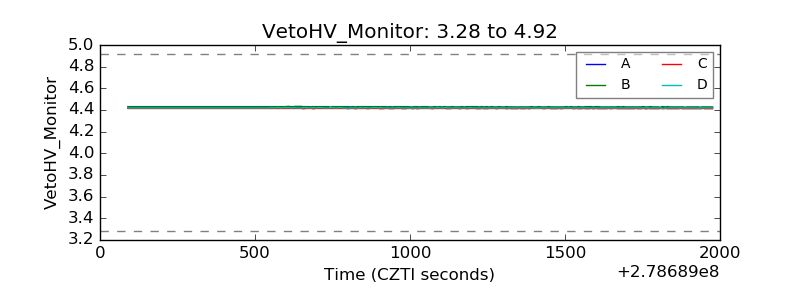 |
| Veto LLD | 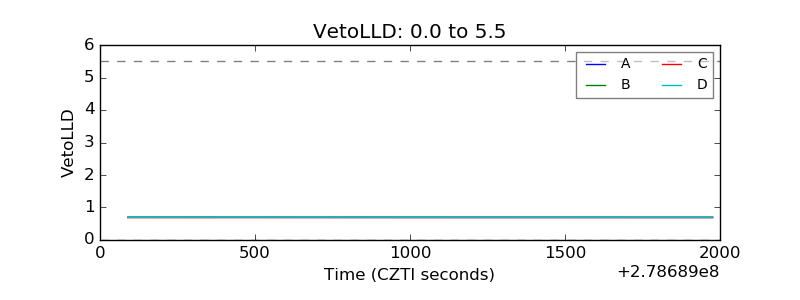 |
| Alpha Counter | 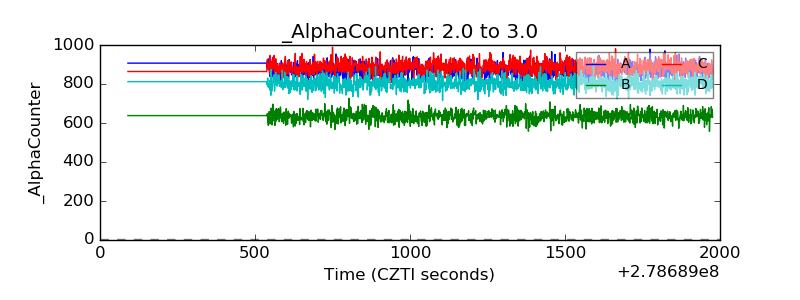 |
| _CPM_Rate | 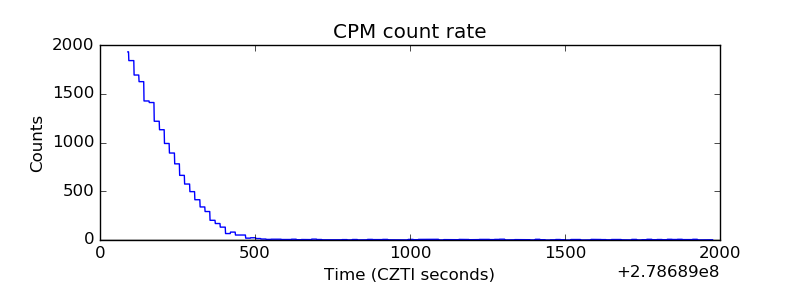 |
| CZT Counter | 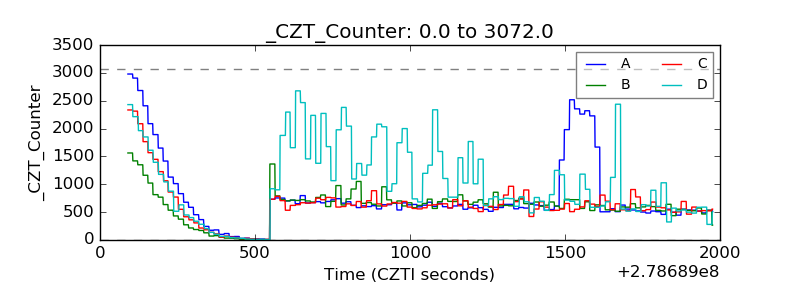 |
| +2.5 Volts monitor |  |
| +5 Volts monitor |  |
| _ROLL_ROT | 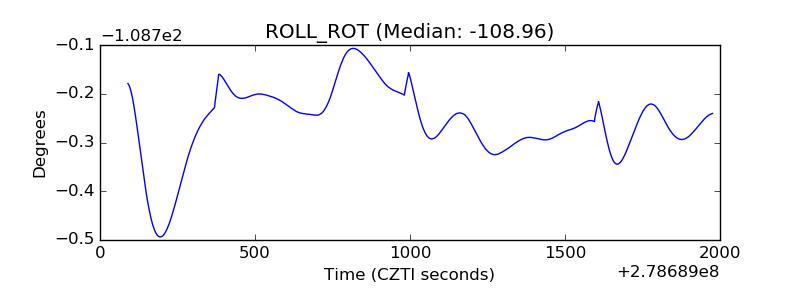 |
| _Roll_DEC |  |
| _Roll_RA | 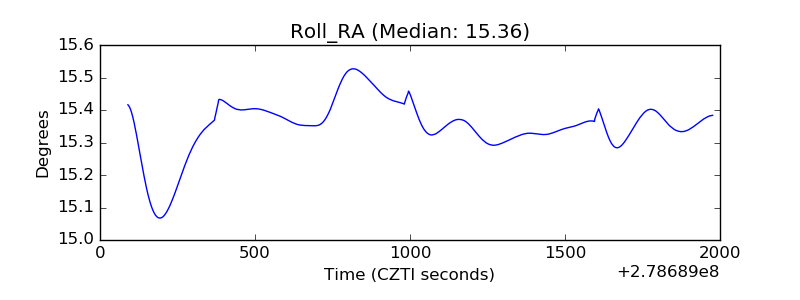 |
| Veto Counter | 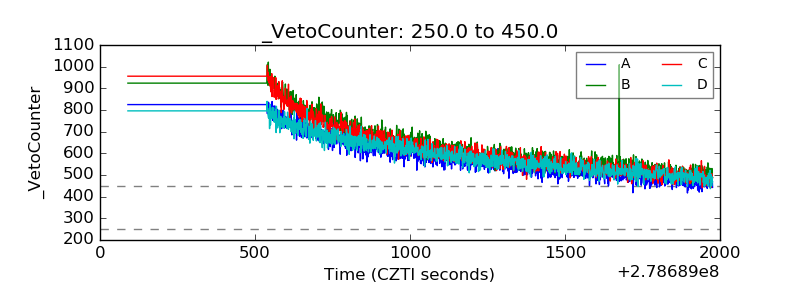 |