| Param | Original file | Final file |
|---|---|---|
| Filename | modeM0/AS1A05_059T03_9000002474_16718cztM0_level2.evt | modeM0/AS1A05_059T03_9000002474_16718cztM0_level2_quad_clean.evt |
| Size (bytes) | 543,032,640 | 135,118,080 |
| Size | 517.9 MB | 128.9 MB |
| Events in quadrant A | 4,088,297 | 928,376 |
| Events in quadrant B | 3,667,111 | 955,688 |
| Events in quadrant C | 3,454,525 | 907,968 |
| Events in quadrant D | 4,813,328 | 865,177 |
| Mode SS | |||
|---|---|---|---|
| Quadrant | BADHDUFLAG | Total packets | Discarded packets |
| A | 0 | 128 | 0 |
| B | 0 | 128 | 0 |
| C | 0 | 128 | 0 |
| D | 0 | 128 | 0 |
| Mode M9 | |||
|---|---|---|---|
| Quadrant | BADHDUFLAG | Total packets | Discarded packets |
| A | 0 | 13 | 0 |
| B | 0 | 13 | 0 |
| C | 0 | 13 | 0 |
| D | 0 | 13 | 0 |
| Mode M0 | |||
|---|---|---|---|
| Quadrant | BADHDUFLAG | Total packets | Discarded packets |
| A | 0 | 16259 | 2 |
| B | 0 | 14922 | 1 |
| C | 0 | 14376 | 1 |
| D | 0 | 18422 | 1 |
| Quadrant | Total seconds | Saturated seconds | Saturation percentage |
|---|---|---|---|
| A | 6230 | 296 | 4.751204% |
| B | 6230 | 96 | 1.540931% |
| C | 6230 | 118 | 1.894061% |
| D | 6230 | 421 | 6.757624% |
Noise dominated data is calculated using 1-second bins in cleaned event files. If a bin has >2000 counts, and if more than 50% of those come from <1% of pixels, then it is considered to be noise-dominated and hence unusable.
| Quadrant | # 1 sec bins | Bins with >0 counts | Bins with >2000 counts | High rate bins dominated by noise | Noise dominated (total time) | Noise dominated (detector-on time) | Marked lightcurve |
|---|---|---|---|---|---|---|---|
| A | 7586 | 6232 | 188 | 188 | 2.48% | 3.02% | 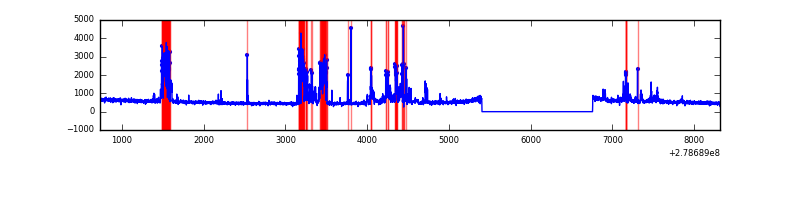 |
| B | 7586 | 6232 | 11 | 11 | 0.15% | 0.18% | 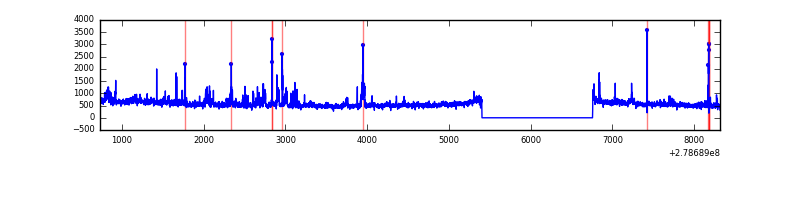 |
| C | 7586 | 6232 | 15 | 15 | 0.20% | 0.24% | 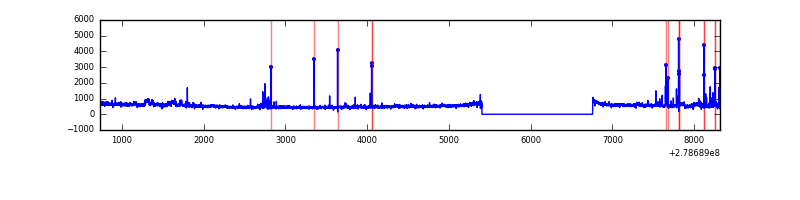 |
| D | 7586 | 6232 | 247 | 247 | 3.26% | 3.96% |  |
Top three noisy pixels from each quadrant. If the there are fewer than three noisy pixels in the level2.evt file, extra rows are filled as -1
| Pixel properties | Quadrant properties | ||||||
|---|---|---|---|---|---|---|---|
| Quadrant | DetID | PixID | Counts | Sigma | Mean | Median | Sigma |
| A | 15 | 174 | 975885 | 6137.15 | 803 | 789 | 158.9 |
| A | 9 | 143 | 12960 | 76.6 | 803 | 789 | 158.9 |
| A | 0 | 226 | 7585 | 42.77 | 803 | 789 | 158.9 |
| B | 15 | 35 | 146378 | 983.82 | 813 | 797 | 148.0 |
| B | 0 | 229 | 103199 | 692.02 | 813 | 797 | 148.0 |
| B | 0 | 189 | 55998 | 373.04 | 813 | 797 | 148.0 |
| C | 3 | 233 | 172091 | 988.86 | 766 | 772 | 173.2 |
| C | 0 | 207 | 138140 | 792.89 | 766 | 772 | 173.2 |
| C | 14 | 238 | 123698 | 709.53 | 766 | 772 | 173.2 |
| D | 1 | 52 | 925330 | 5093.89 | 761 | 741 | 181.5 |
| D | 5 | 222 | 522963 | 2877.11 | 761 | 741 | 181.5 |
| D | 11 | 176 | 142843 | 782.89 | 761 | 741 | 181.5 |
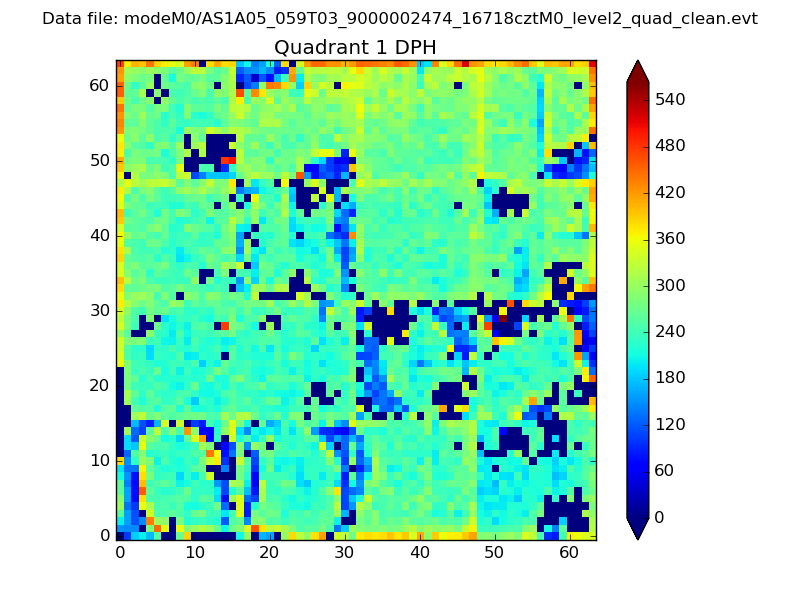
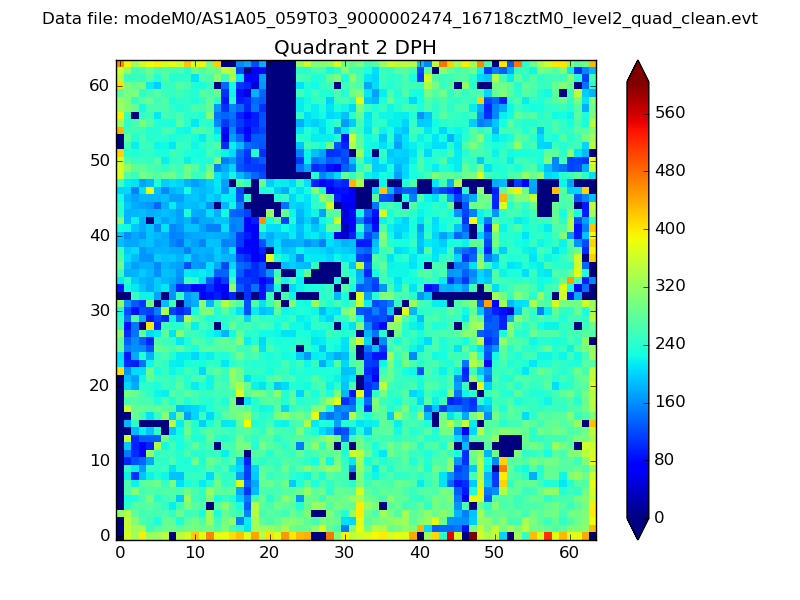
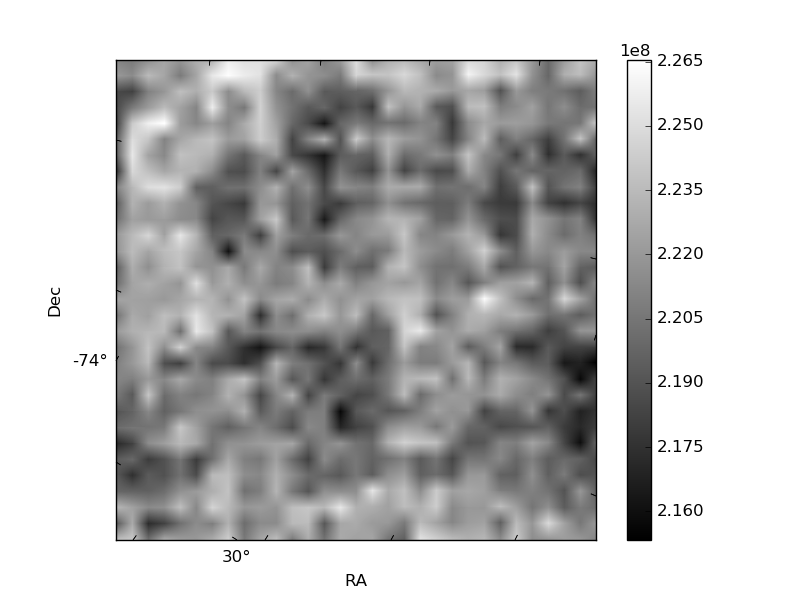
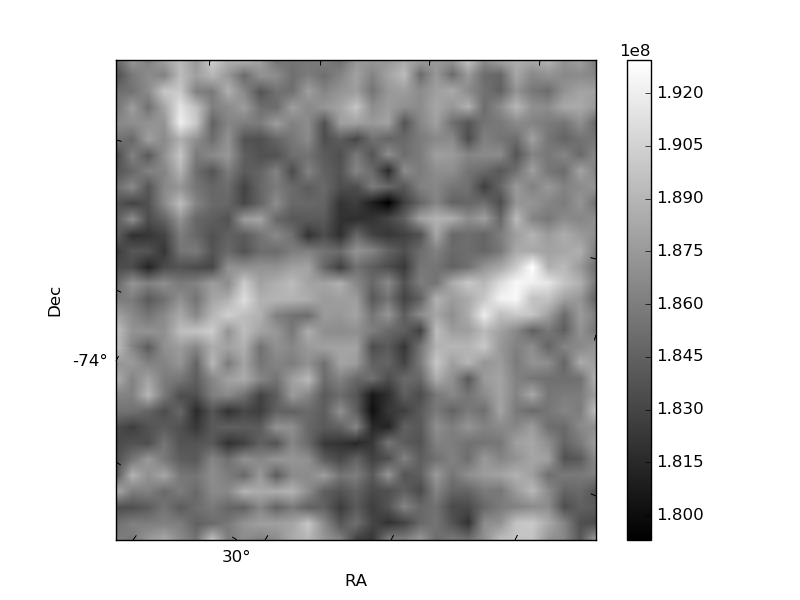
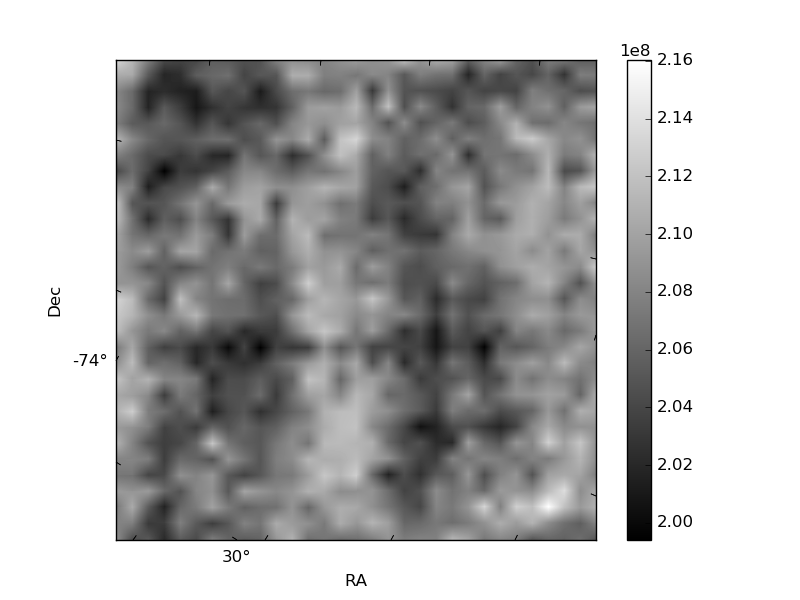
Histogram calculated using DETX and DETY for each event in the final _common_clean file
| Quadrant A | 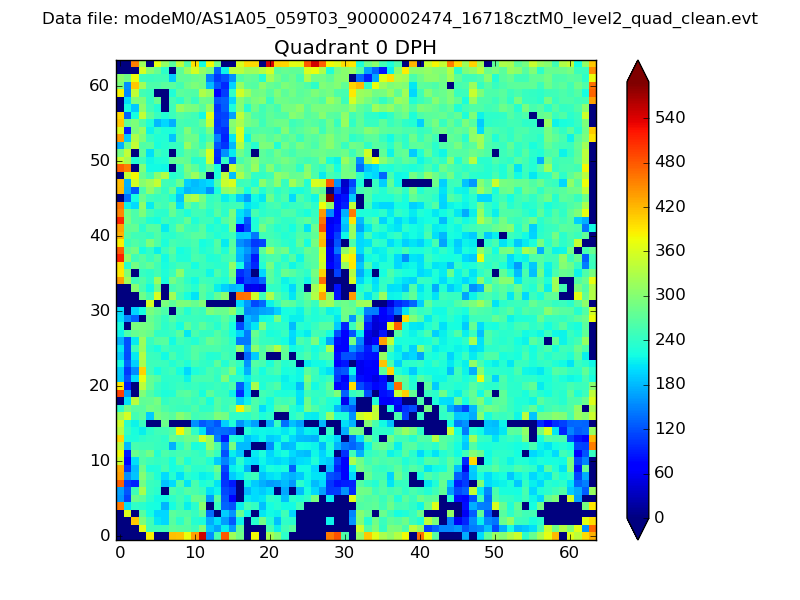 |
 |
Quadrant B |
|---|---|---|---|
| Quadrant D | 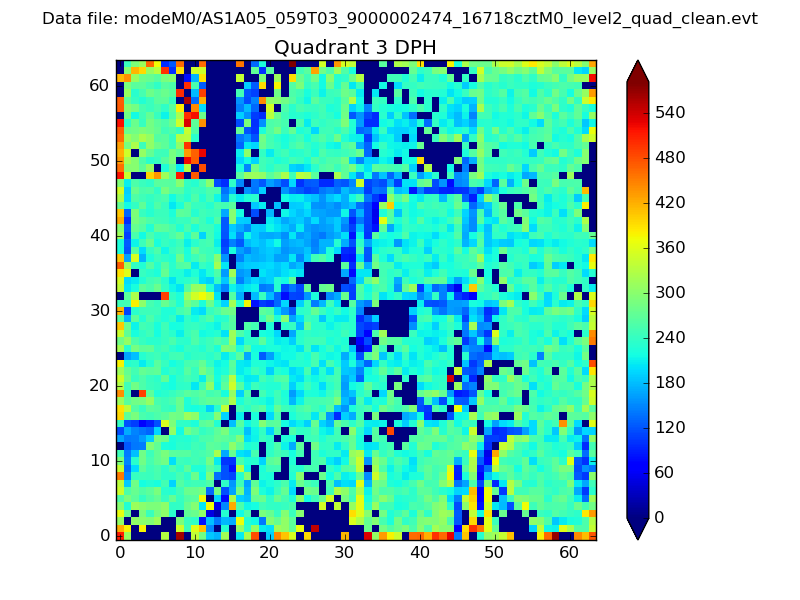 |
 |
Quadrant C |
| Plot type | Count rate plots | Images |
|---|---|---|
| Comparison with Poisson distribution Blue bars denote a histogram of data divided into 1 sec bins. Red curve is a Poisson curve with rate = median count rate of data. |
 |
 |
| Quadrant-wise count rates Data is divided into 100 sec bins |
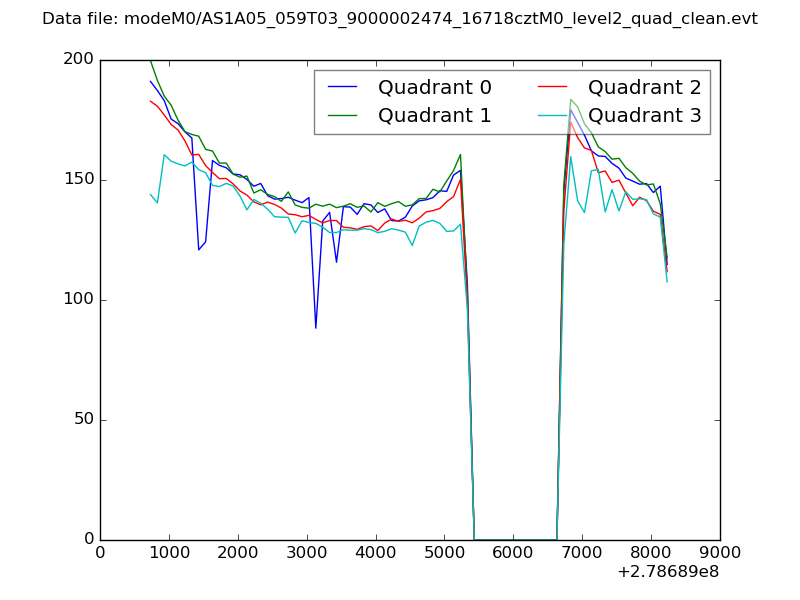 |
|
| Module-wise count rates for Quadrant A Data is divided into 100 sec bins |
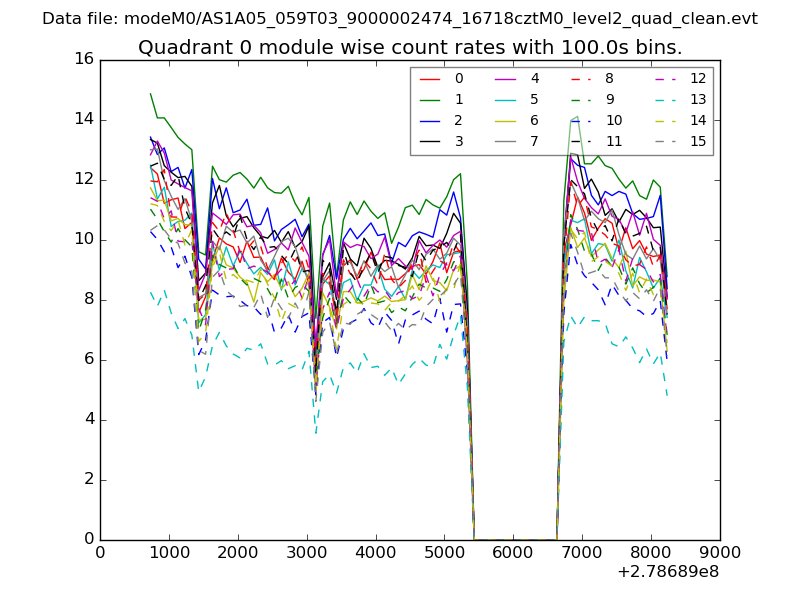 |
 |
| Module-wise count rates for Quadrant B Data is divided into 100 sec bins |
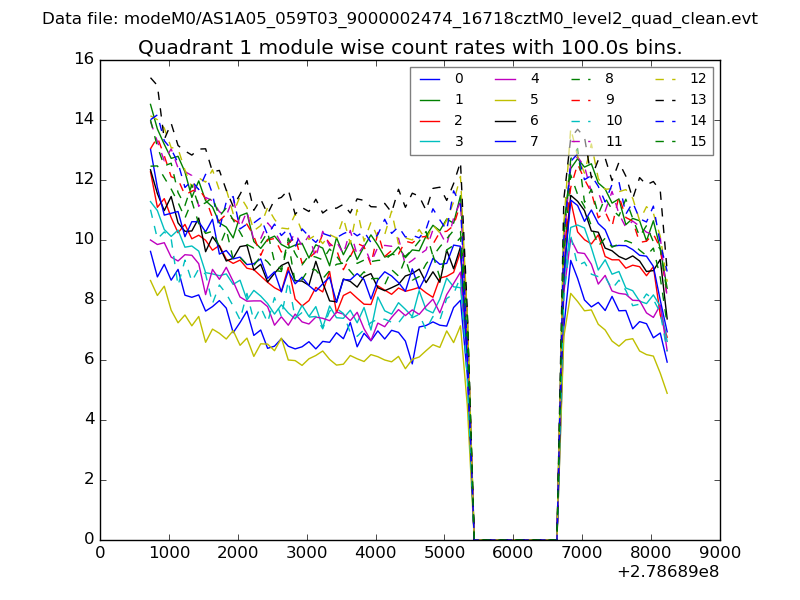 |
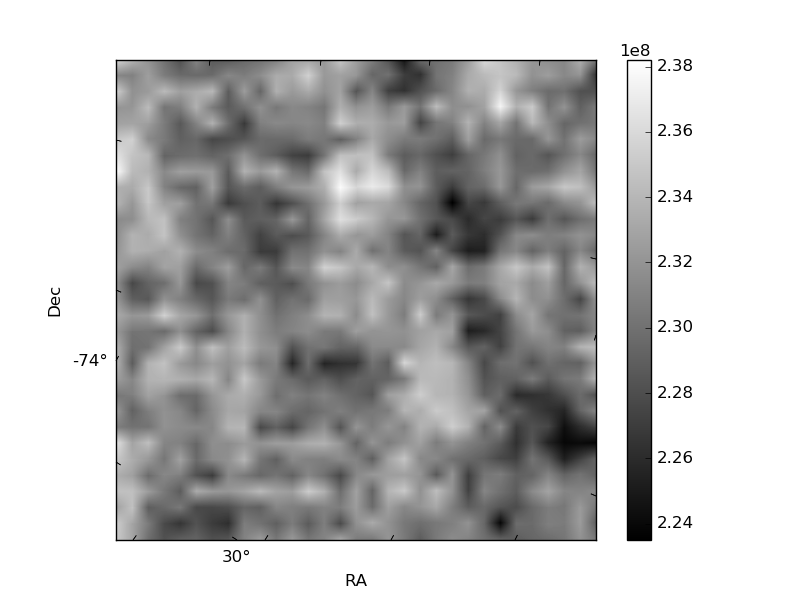 |
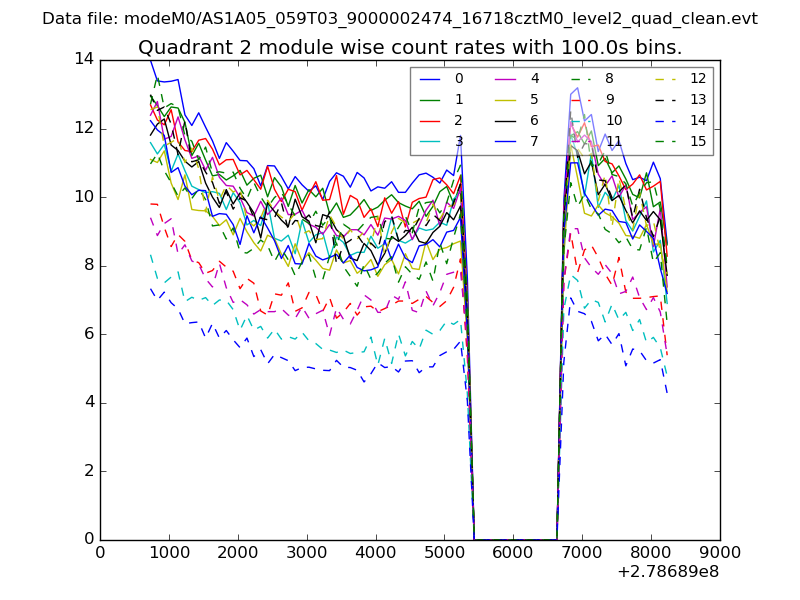
| Module-wise count rates for Quadrant C Data is divided into 100 sec bins |
 |
 |
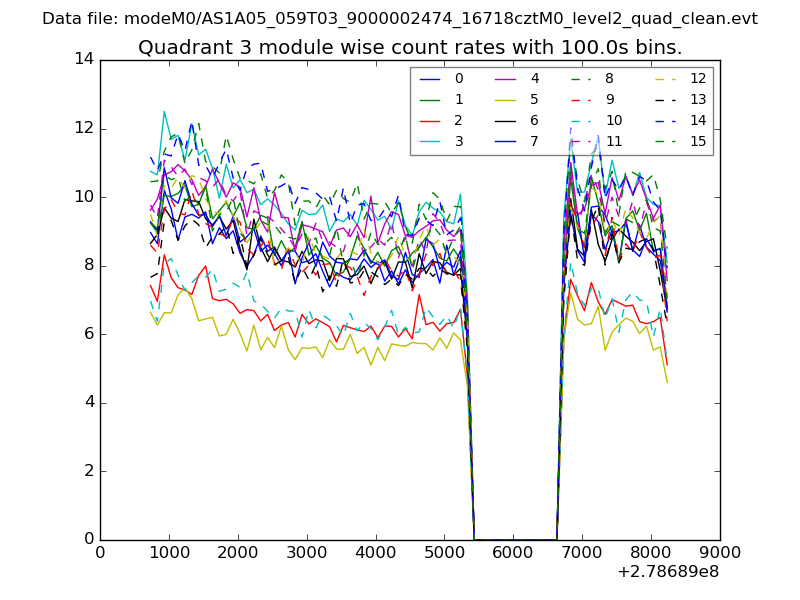
| Module-wise count rates for Quadrant D Data is divided into 100 sec bins |
 |
 |
| Parameter | Plot |
|---|---|
| CZT HV Monitor |  |
| D_VDD |  |
| Temperature 1 | 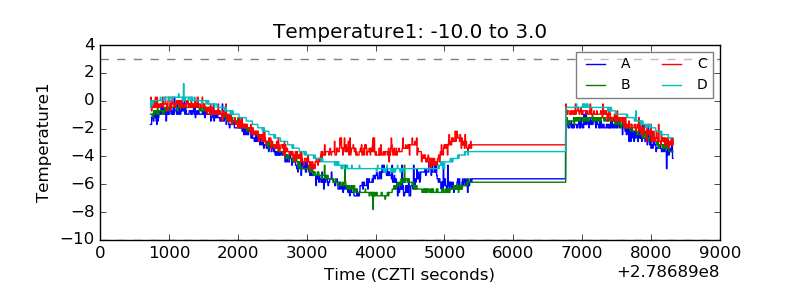 |
| Veto HV Monitor | 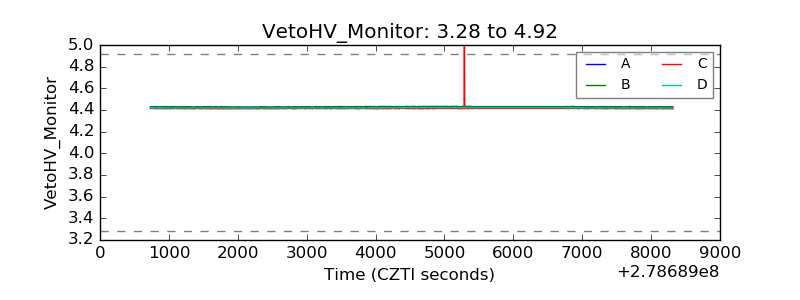 |
| Veto LLD | 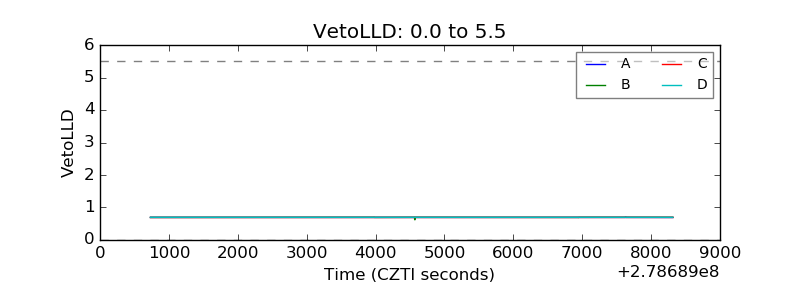 |
| Alpha Counter | 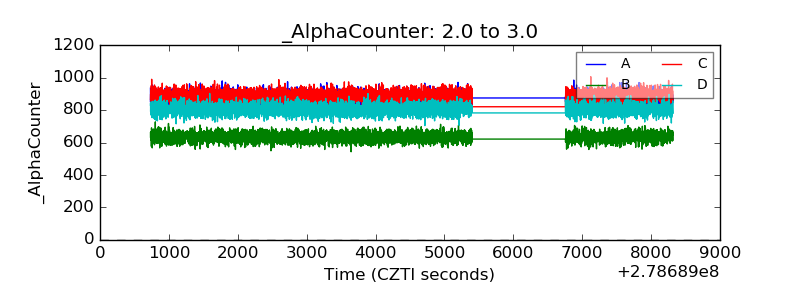 |
| _CPM_Rate | 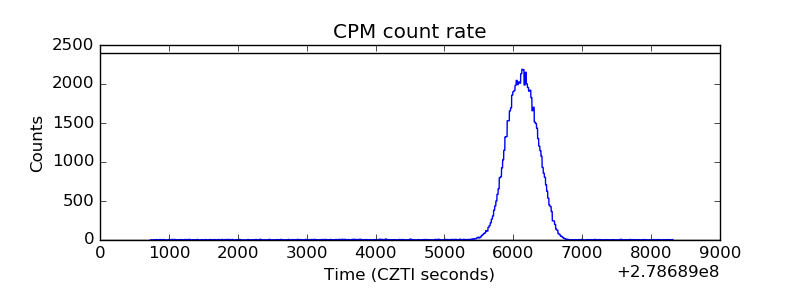 |
| CZT Counter | 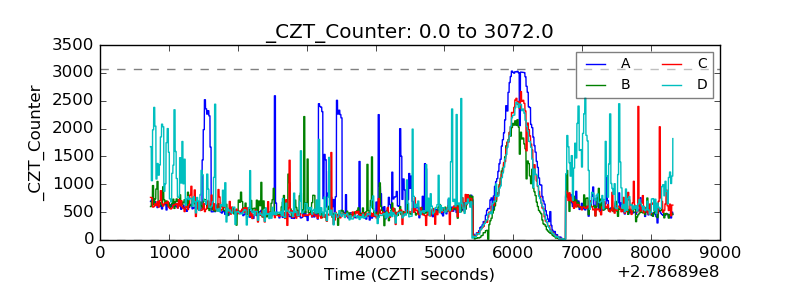 |
| +2.5 Volts monitor |  |
| +5 Volts monitor |  |
| _ROLL_ROT | 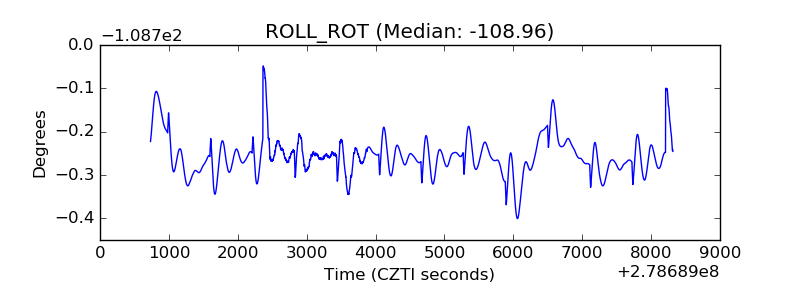 |
| _Roll_DEC | 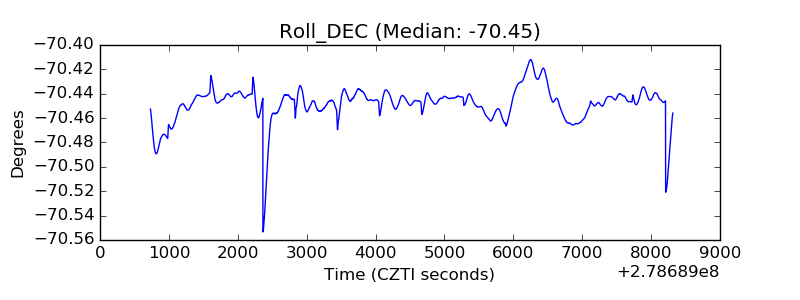 |
| _Roll_RA | 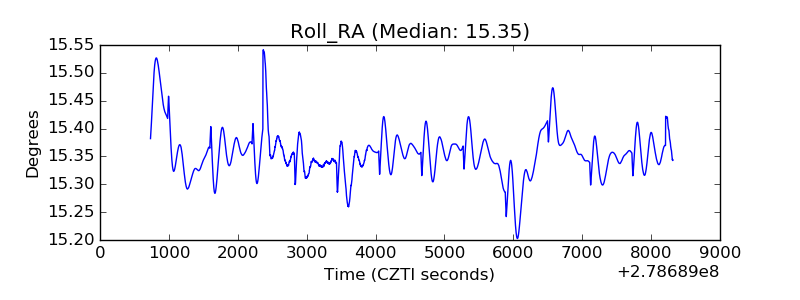 |
| Veto Counter | 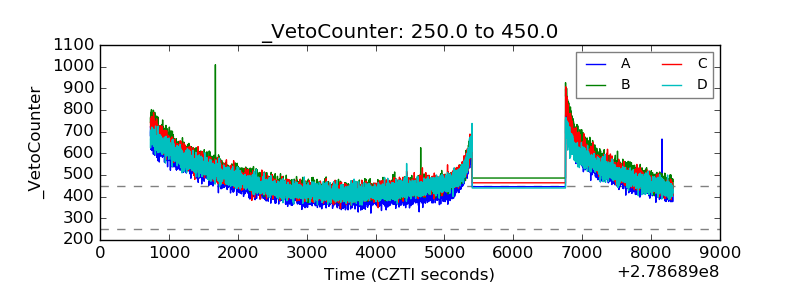 |