| Param | Original file | Final file |
|---|---|---|
| Filename | modeM0/AS1A05_059T03_9000002474_16719cztM0_level2.evt | modeM0/AS1A05_059T03_9000002474_16719cztM0_level2_quad_clean.evt |
| Size (bytes) | 211,847,040 | 53,219,520 |
| Size | 202.0 MB | 50.8 MB |
| Events in quadrant A | 1,367,489 | 368,415 |
| Events in quadrant B | 1,350,630 | 375,384 |
| Events in quadrant C | 1,443,879 | 351,907 |
| Events in quadrant D | 2,084,342 | 338,389 |
| Mode SS | |||
|---|---|---|---|
| Quadrant | BADHDUFLAG | Total packets | Discarded packets |
| A | 0 | 50 | 0 |
| B | 0 | 50 | 0 |
| C | 0 | 50 | 0 |
| D | 0 | 50 | 0 |
| Mode M0 | |||
|---|---|---|---|
| Quadrant | BADHDUFLAG | Total packets | Discarded packets |
| A | 0 | 5734 | 1 |
| B | 0 | 5609 | 1 |
| C | 0 | 5901 | 1 |
| D | 0 | 7868 | 1 |
| Quadrant | Total seconds | Saturated seconds | Saturation percentage |
|---|---|---|---|
| A | 2466 | 14 | 0.567721% |
| B | 2466 | 13 | 0.527170% |
| C | 2466 | 32 | 1.297648% |
| D | 2466 | 132 | 5.352798% |
Noise dominated data is calculated using 1-second bins in cleaned event files. If a bin has >2000 counts, and if more than 50% of those come from <1% of pixels, then it is considered to be noise-dominated and hence unusable.
| Quadrant | # 1 sec bins | Bins with >0 counts | Bins with >2000 counts | High rate bins dominated by noise | Noise dominated (total time) | Noise dominated (detector-on time) | Marked lightcurve |
|---|---|---|---|---|---|---|---|
| A | 2467 | 2467 | 8 | 8 | 0.32% | 0.32% | 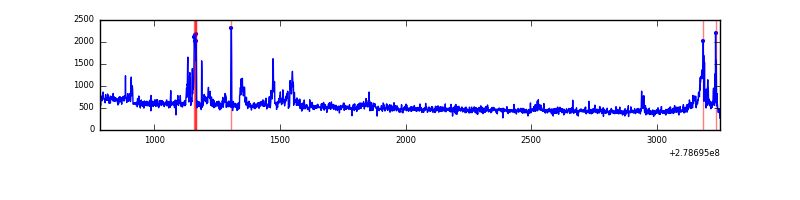 |
| B | 2467 | 2467 | 5 | 5 | 0.20% | 0.20% | 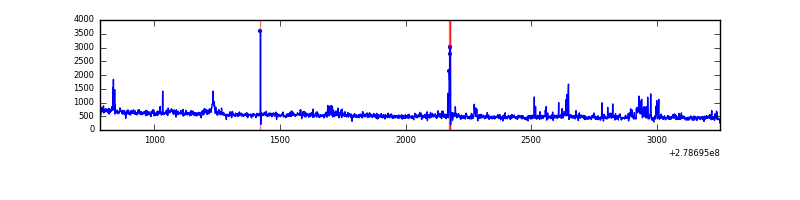 |
| C | 2467 | 2467 | 14 | 14 | 0.57% | 0.57% | 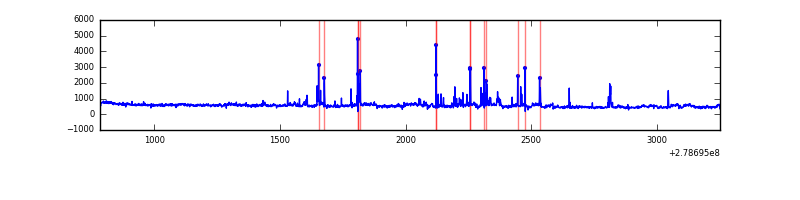 |
| D | 2467 | 2467 | 98 | 98 | 3.97% | 3.97% | 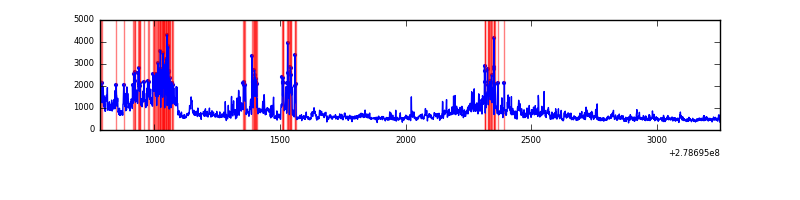 |
Top three noisy pixels from each quadrant. If the there are fewer than three noisy pixels in the level2.evt file, extra rows are filled as -1
| Pixel properties | Quadrant properties | ||||||
|---|---|---|---|---|---|---|---|
| Quadrant | DetID | PixID | Counts | Sigma | Mean | Median | Sigma |
| A | 15 | 174 | 147069 | 2266.79 | 315 | 309 | 64.7 |
| A | 10 | 234 | 4186 | 59.88 | 315 | 309 | 64.7 |
| A | 9 | 143 | 3107 | 43.22 | 315 | 309 | 64.7 |
| B | 15 | 35 | 29856 | 500.32 | 313 | 307 | 59.1 |
| B | 7 | 220 | 19388 | 323.07 | 313 | 307 | 59.1 |
| B | 0 | 197 | 17525 | 291.53 | 313 | 307 | 59.1 |
| C | 0 | 207 | 123130 | 1829.21 | 290 | 292 | 67.2 |
| C | 3 | 233 | 115402 | 1714.13 | 290 | 292 | 67.2 |
| C | 14 | 238 | 47672 | 705.55 | 290 | 292 | 67.2 |
| D | 1 | 52 | 603992 | 8466.44 | 291 | 283 | 71.3 |
| D | 5 | 222 | 240891 | 3374.3 | 291 | 283 | 71.3 |
| D | 10 | 70 | 92423 | 1292.18 | 291 | 283 | 71.3 |
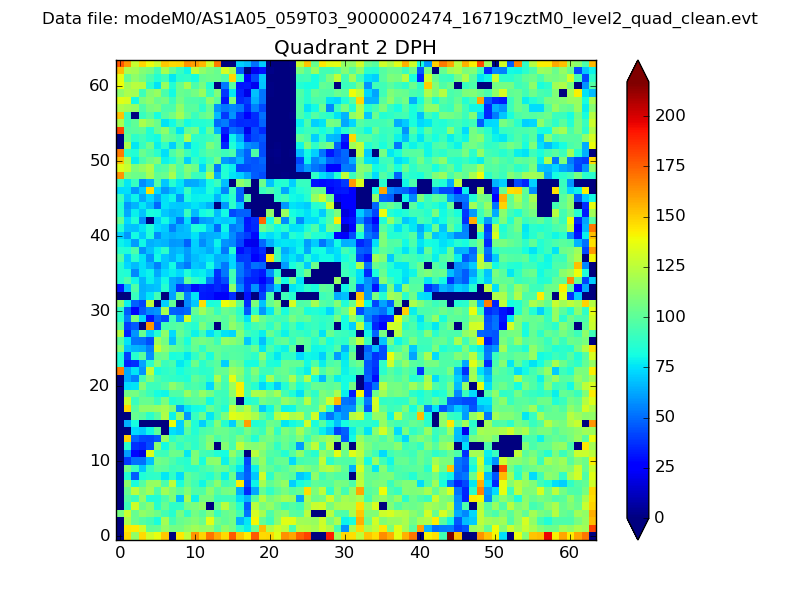
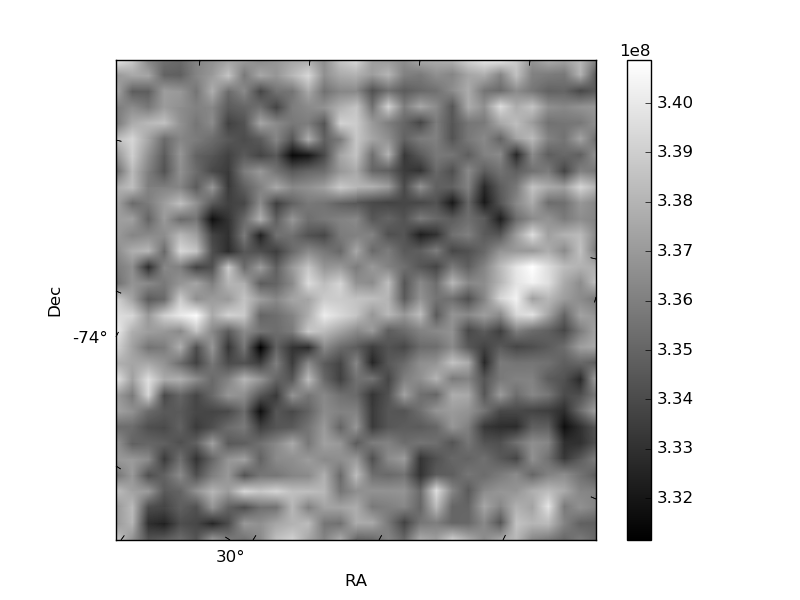
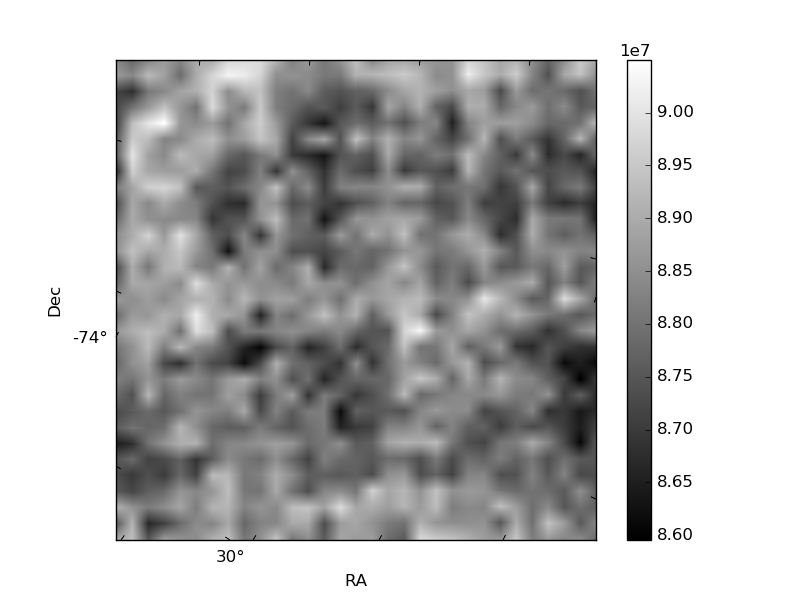
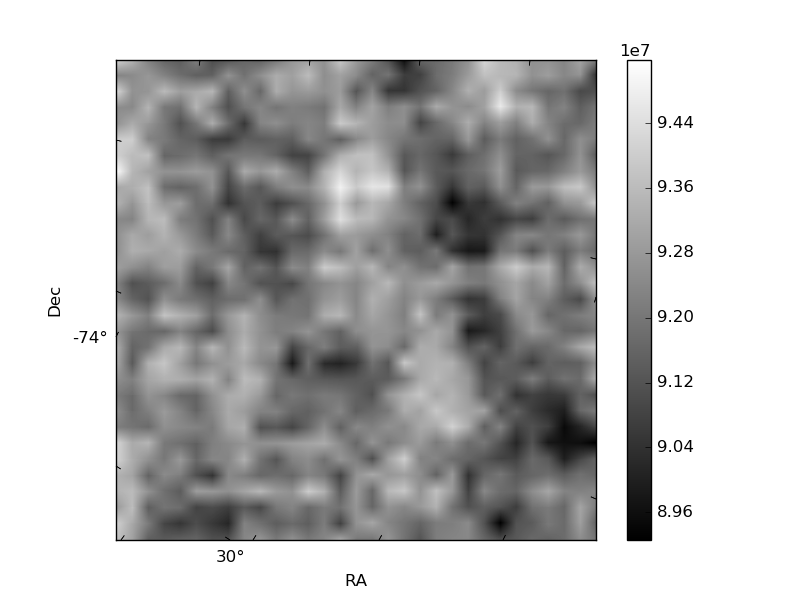
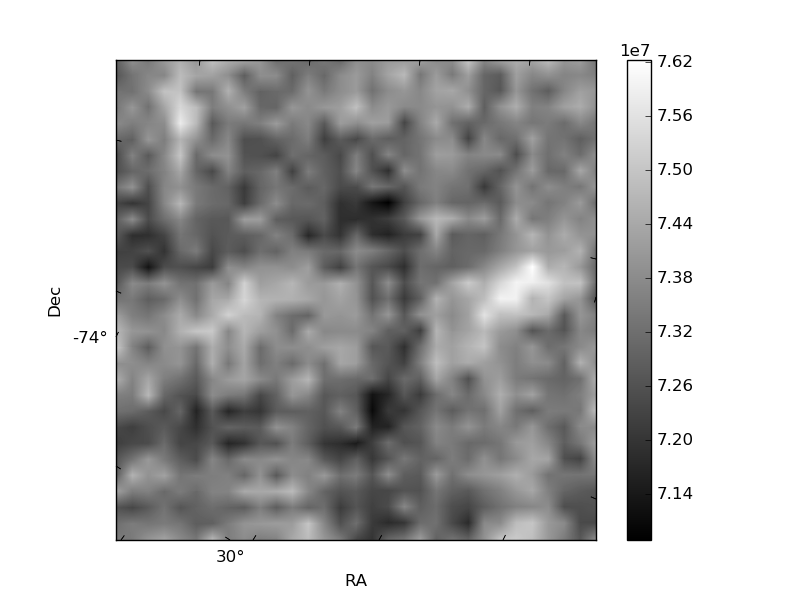
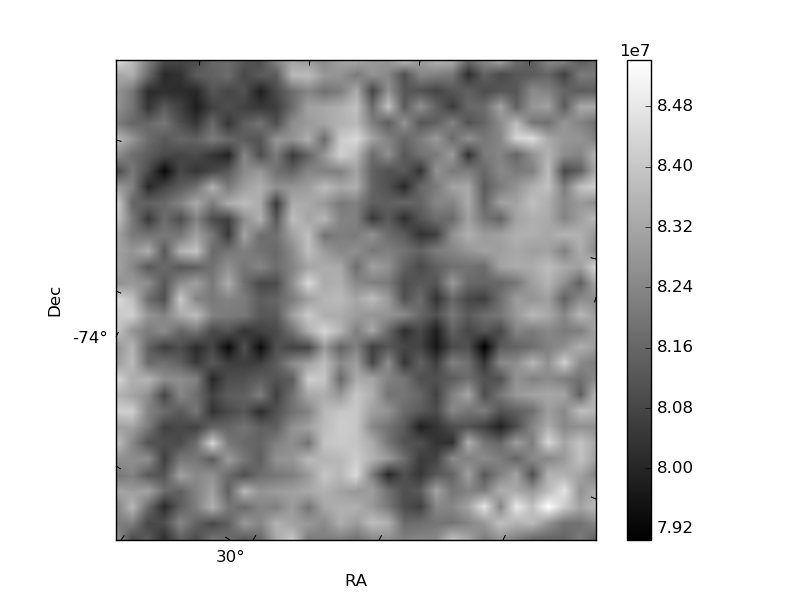
Histogram calculated using DETX and DETY for each event in the final _common_clean file
| Quadrant A | 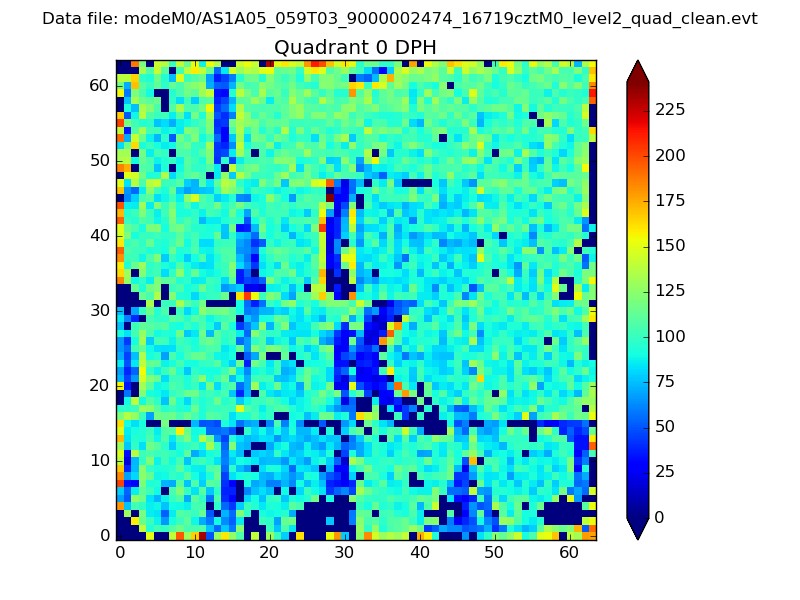 |
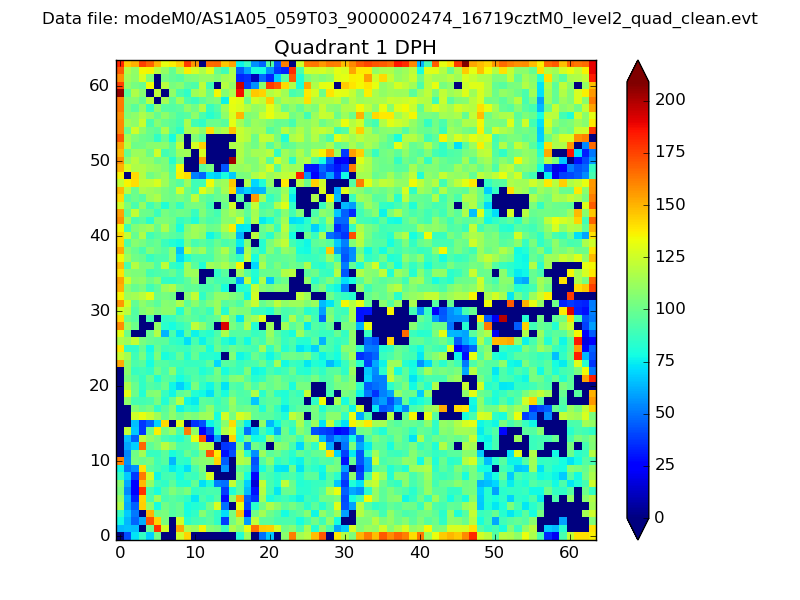 |
Quadrant B |
|---|---|---|---|
| Quadrant D | 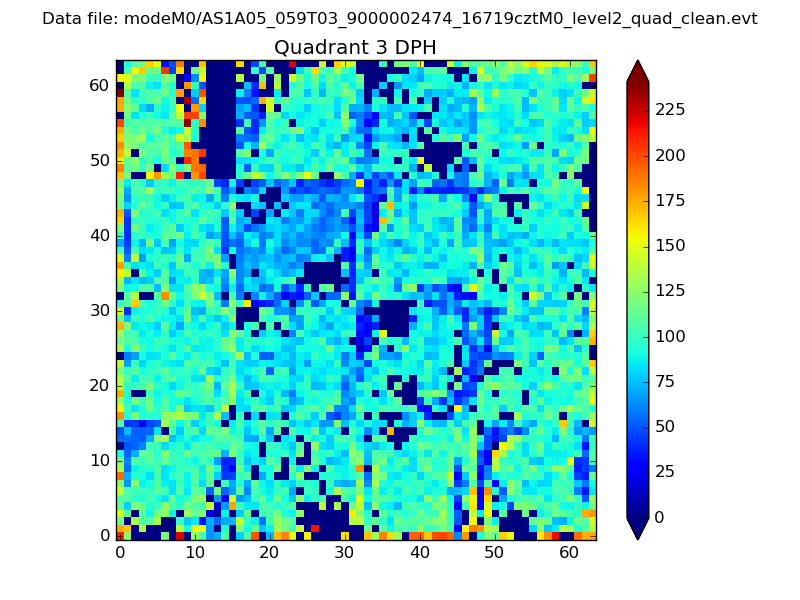 |
 |
Quadrant C |
| Plot type | Count rate plots | Images |
|---|---|---|
| Comparison with Poisson distribution Blue bars denote a histogram of data divided into 1 sec bins. Red curve is a Poisson curve with rate = median count rate of data. |
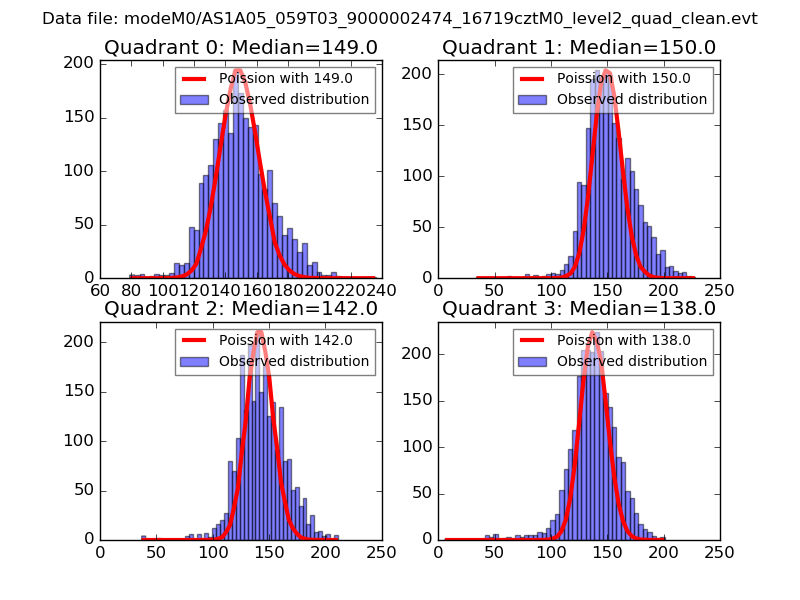 |
 |
| Quadrant-wise count rates Data is divided into 100 sec bins |
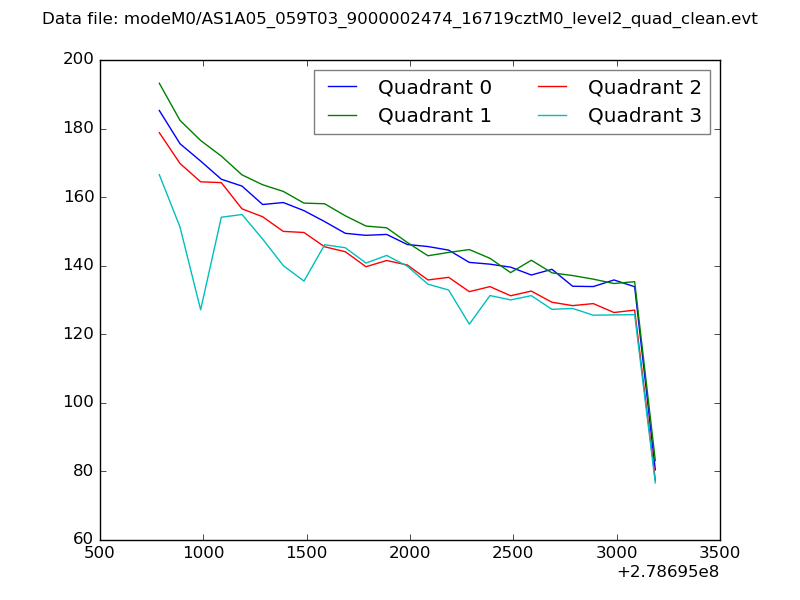 |
|
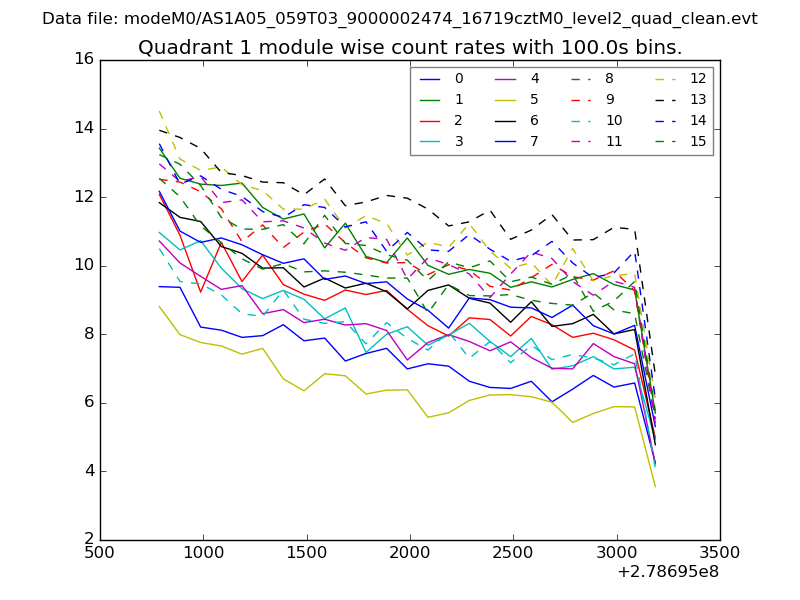
| Module-wise count rates for Quadrant A Data is divided into 100 sec bins |
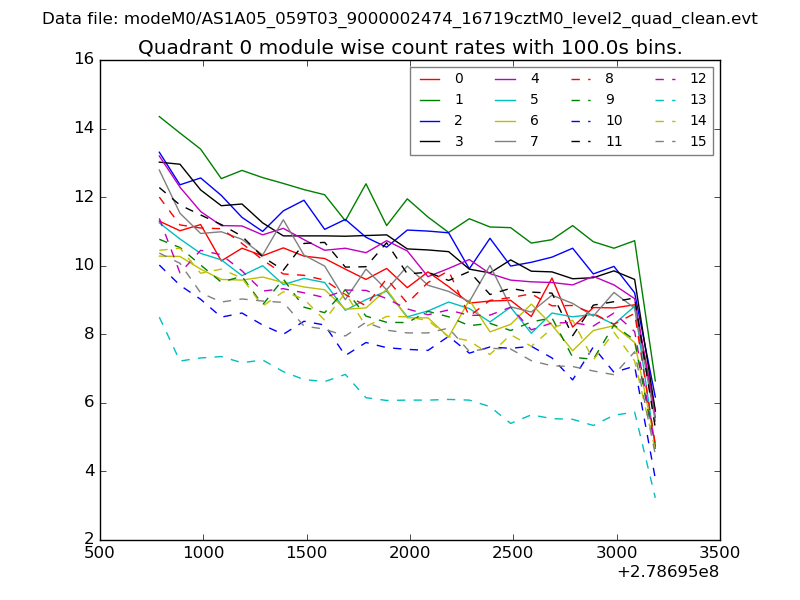 |
 |
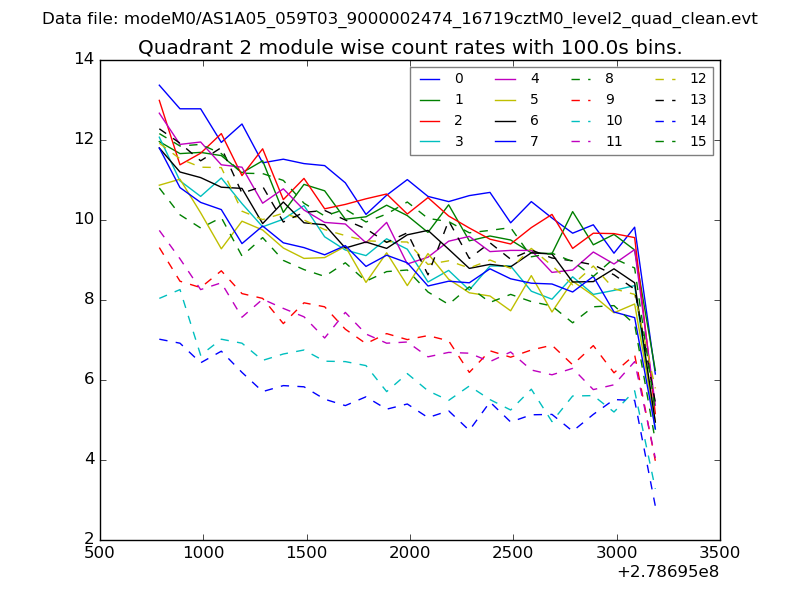
| Module-wise count rates for Quadrant B Data is divided into 100 sec bins |
 |
 |
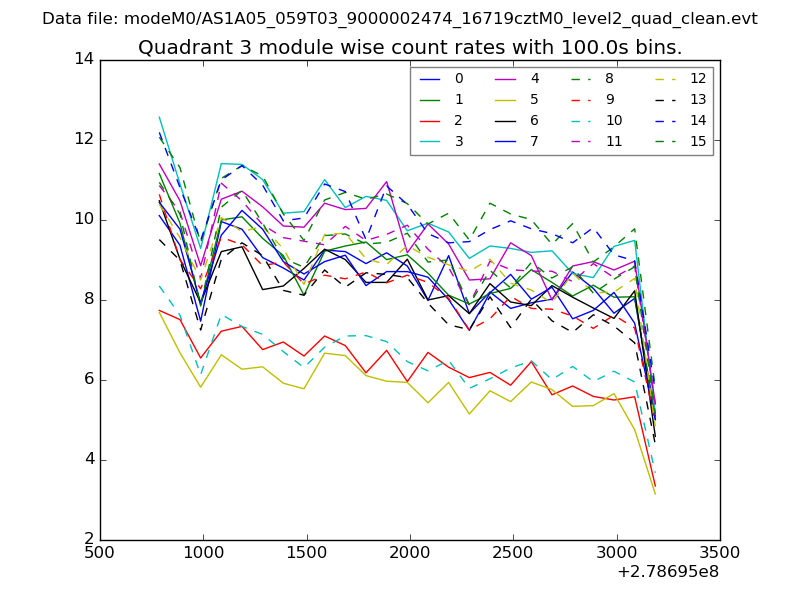
| Module-wise count rates for Quadrant C Data is divided into 100 sec bins |
 |
 |
| Module-wise count rates for Quadrant D Data is divided into 100 sec bins |
 |
 |
| Parameter | Plot |
|---|---|
| CZT HV Monitor | 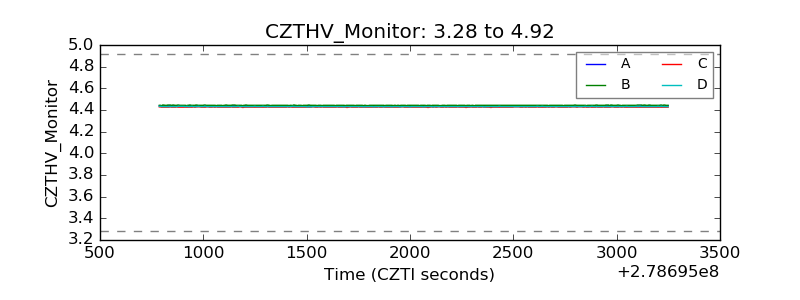 |
| D_VDD | 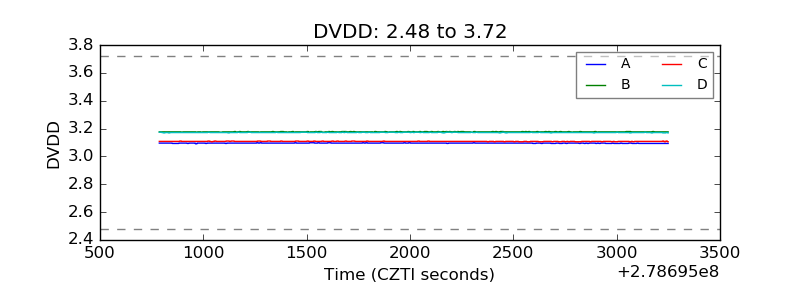 |
| Temperature 1 | 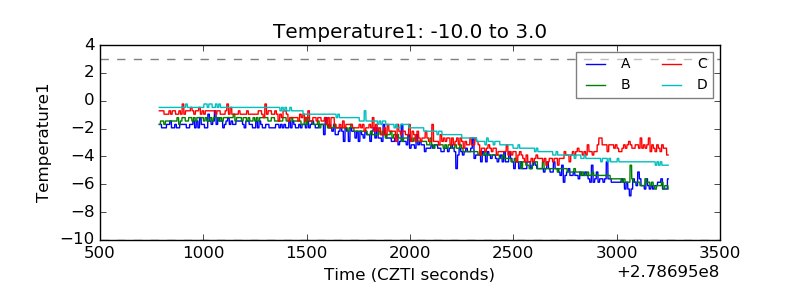 |
| Veto HV Monitor |  |
| Veto LLD | 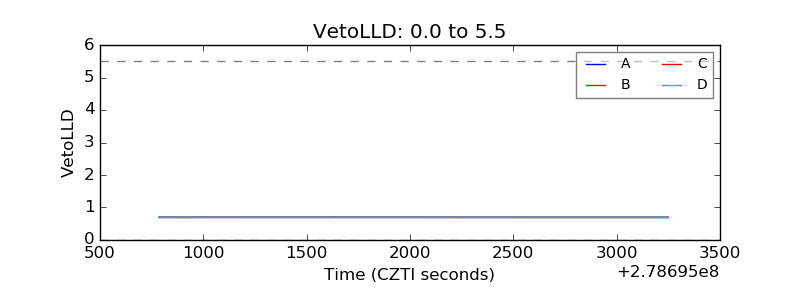 |
| Alpha Counter | 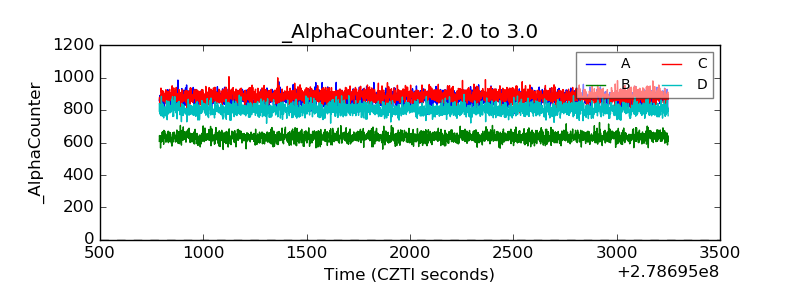 |
| _CPM_Rate | 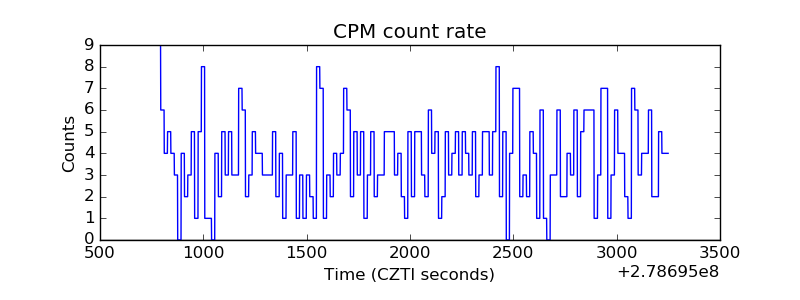 |
| CZT Counter | 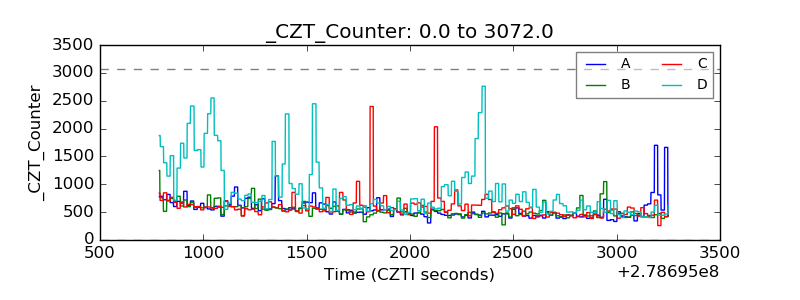 |
| +2.5 Volts monitor |  |
| +5 Volts monitor |  |
| _ROLL_ROT | 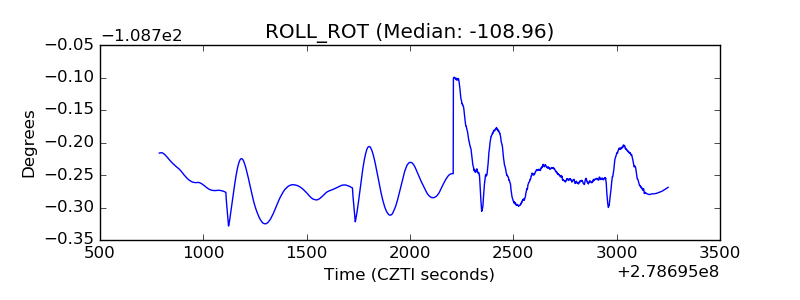 |
| _Roll_DEC | 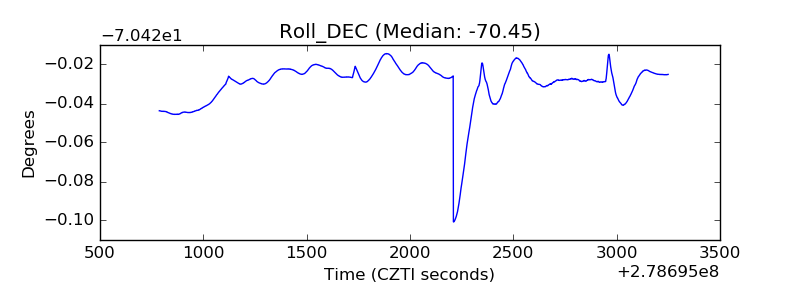 |
| _Roll_RA |  |
| Veto Counter | 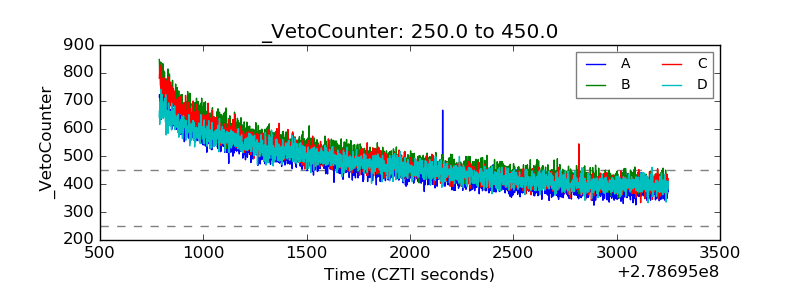 |