| Param | Original file | Final file |
|---|---|---|
| Filename | modeM0/AS1A05_059T04_9000002476cztM0_level2.fits | modeM0/AS1A05_059T04_9000002476cztM0_level2_quad_clean.evt |
| Size (bytes) | 89,167,680 | 105,661,440 |
| Size | 85.0 MB | 100.8 MB |
| Events in quadrant A | 540,460 | 652,787 |
| Events in quadrant B | 528,634 | 684,461 |
| Events in quadrant C | 530,982 | 635,856 |
| Events in quadrant D | 469,440 | 595,335 |
| Mode M0 | |||
|---|---|---|---|
| Quadrant | BADHDUFLAG | Total packets | Discarded packets |
| A | 0 | 24870 | 0 |
| B | 0 | 20689 | 0 |
| C | 0 | 24087 | 0 |
| D | 0 | 21429 | 0 |
| Mode SS | |||
|---|---|---|---|
| Quadrant | BADHDUFLAG | Total packets | Discarded packets |
| A | 0 | 186 | 0 |
| B | 0 | 186 | 0 |
| C | 0 | 186 | 0 |
| D | 0 | 186 | 0 |
| Mode M9 | |||
|---|---|---|---|
| Quadrant | BADHDUFLAG | Total packets | Discarded packets |
| A | 0 | 23 | 0 |
| B | 0 | 23 | 0 |
| C | 0 | 23 | 0 |
| D | 0 | 23 | 0 |
| Quadrant | Total seconds | Saturated seconds | Saturation percentage |
|---|---|---|---|
| A | 9092 | 541 | 5.950286% |
| B | 9092 | 160 | 1.759789% |
| C | 9092 | 242 | 2.661681% |
| D | 9092 | 138 | 1.517818% |
Noise dominated data is calculated using 1-second bins in cleaned event files. If a bin has >2000 counts, and if more than 50% of those come from <1% of pixels, then it is considered to be noise-dominated and hence unusable.
| Quadrant | # 1 sec bins | Bins with >0 counts | Bins with >2000 counts | High rate bins dominated by noise | Noise dominated (total time) | Noise dominated (detector-on time) | Marked lightcurve |
|---|---|---|---|---|---|---|---|
| A | 11382 | 9092 | 0 | 0 | 0.00% | 0.00% | 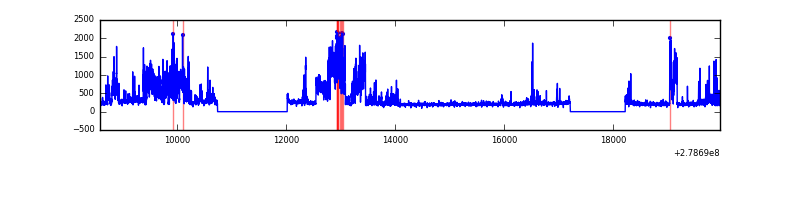 |
| B | 11382 | 9092 | 0 | 0 | 0.00% | 0.00% | 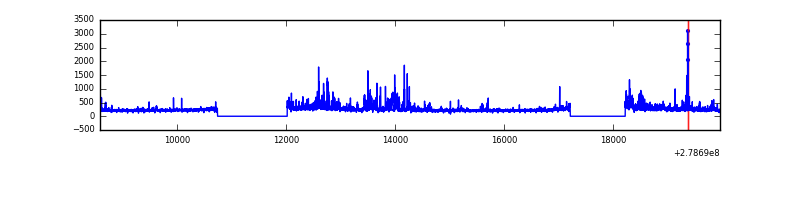 |
| C | 11382 | 9092 | 0 | 0 | 0.00% | 0.00% | 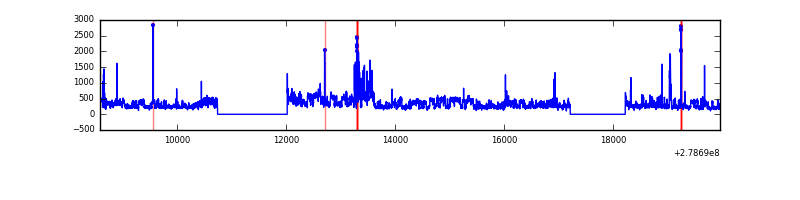 |
| D | 11382 | 9092 | 0 | 0 | 0.00% | 0.00% |  |
Top three noisy pixels from each quadrant. If the there are fewer than three noisy pixels in the level2.evt file, extra rows are filled as -1
| Pixel properties | Quadrant properties | ||||||
|---|---|---|---|---|---|---|---|
| Quadrant | DetID | PixID | Counts | Sigma | Mean | Median | Sigma |
| A | 0 | 29 | 544 | 11.09 | 140 | 133 | 37.1 |
| A | 7 | 110 | 407 | 7.39 | 140 | 133 | 37.1 |
| A | 0 | 30 | 403 | 7.29 | 140 | 133 | 37.1 |
| B | 2 | 9 | 383 | 8.47 | 140 | 135 | 29.3 |
| B | 14 | 254 | 373 | 8.13 | 140 | 135 | 29.3 |
| B | 3 | 17 | 356 | 7.55 | 140 | 135 | 29.3 |
| C | 1 | 81 | 397 | 7.02 | 140 | 132 | 37.7 |
| C | 3 | 158 | 377 | 6.49 | 140 | 132 | 37.7 |
| C | 1 | 80 | 372 | 6.36 | 140 | 132 | 37.7 |
| D | 4 | 246 | 364 | 6.56 | 133 | 121 | 37.0 |
| D | 10 | 189 | 356 | 6.34 | 133 | 121 | 37.0 |
| D | 6 | 67 | 347 | 6.1 | 133 | 121 | 37.0 |
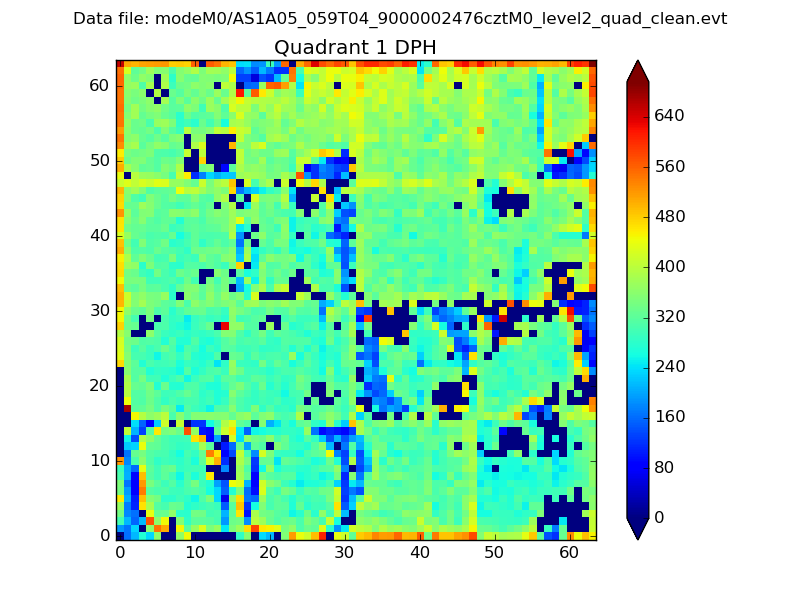
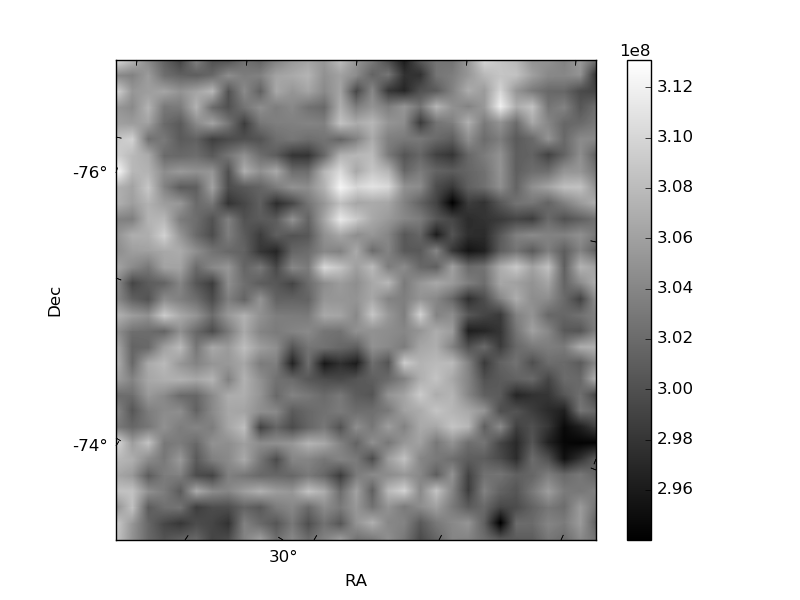
Histogram calculated using DETX and DETY for each event in the final _common_clean file
| Quadrant A | 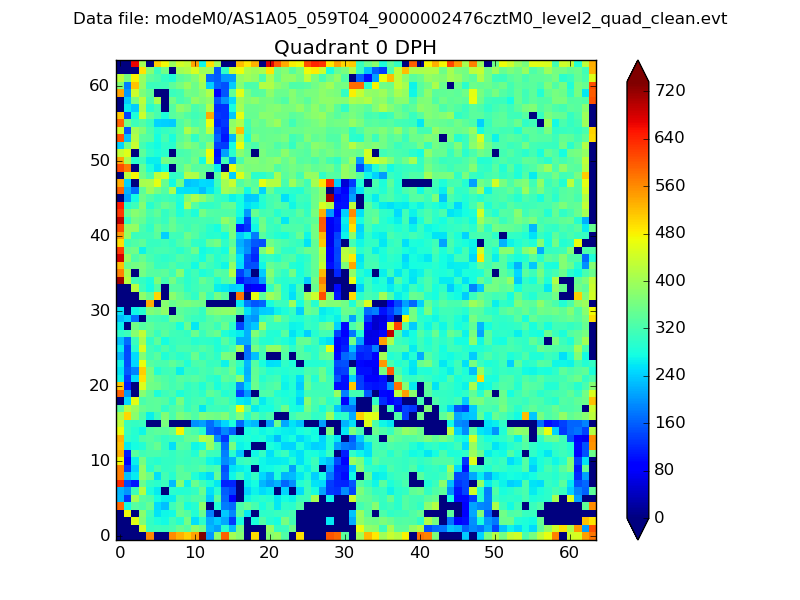 |
 |
Quadrant B |
|---|---|---|---|
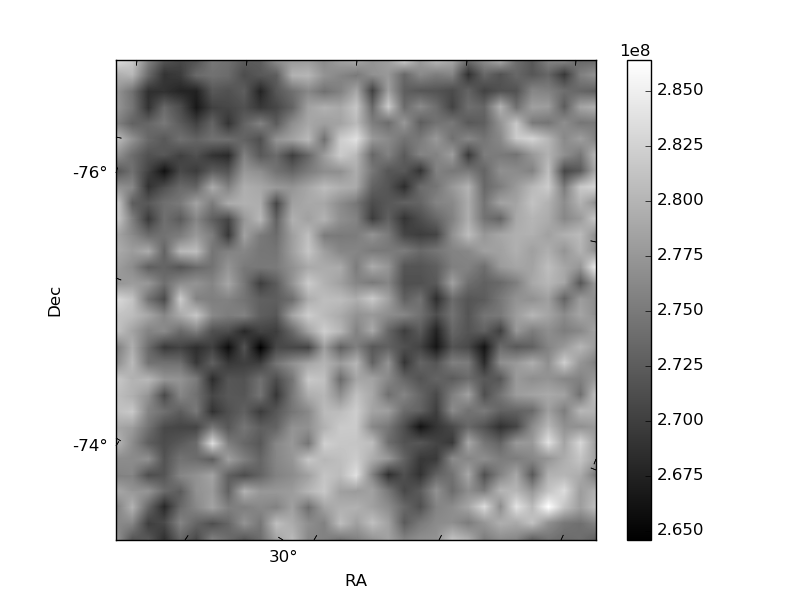
| Quadrant D | 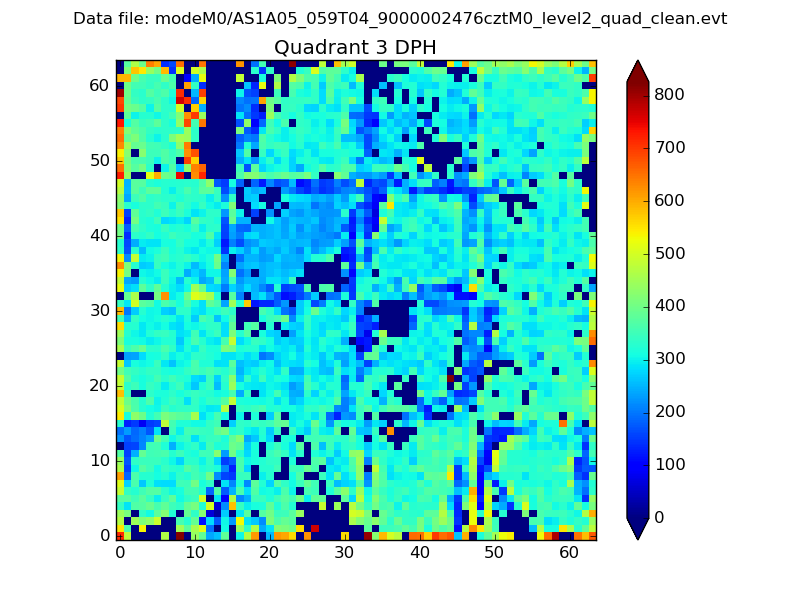 |
 |
Quadrant C |
| Plot type | Count rate plots | Images |
|---|---|---|
| Comparison with Poisson distribution Blue bars denote a histogram of data divided into 1 sec bins. Red curve is a Poisson curve with rate = median count rate of data. |
 |
 |
| Quadrant-wise count rates Data is divided into 100 sec bins |
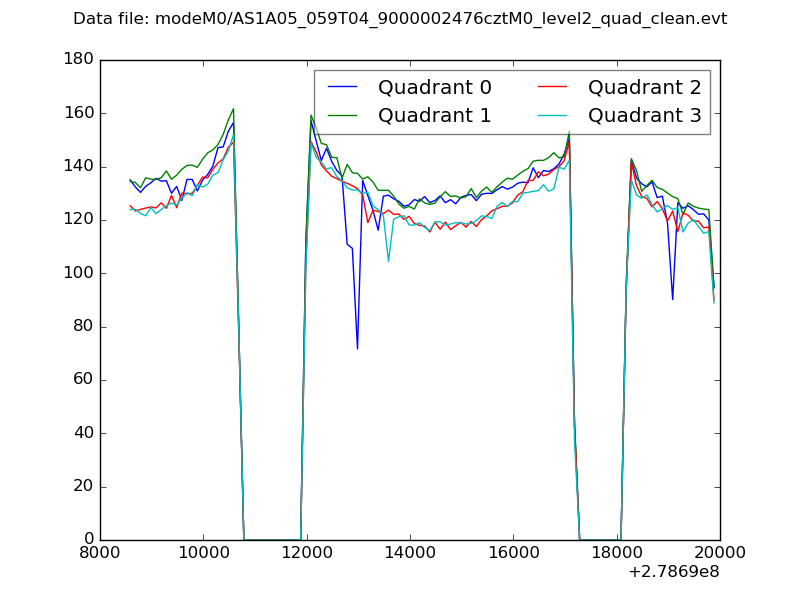 |
|
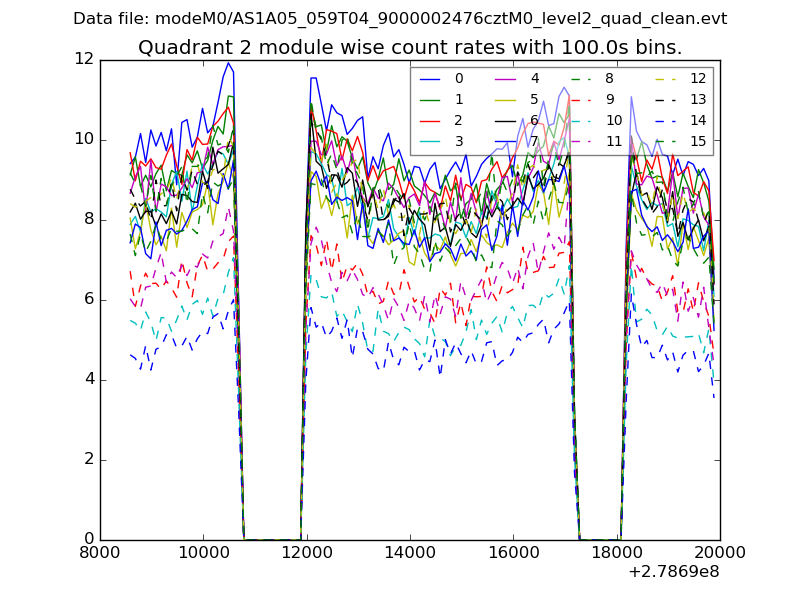
| Module-wise count rates for Quadrant A Data is divided into 100 sec bins |
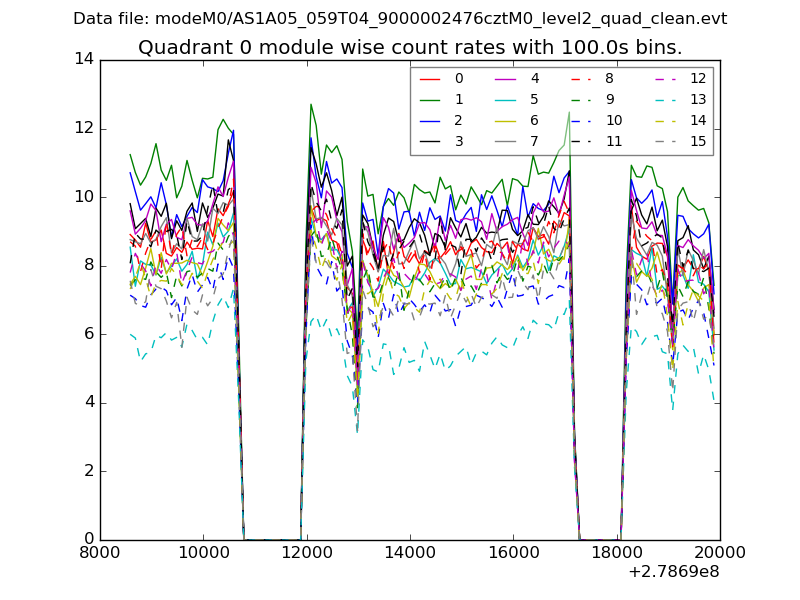 |
 |
| Module-wise count rates for Quadrant B Data is divided into 100 sec bins |
 |
 |
| Module-wise count rates for Quadrant C Data is divided into 100 sec bins |
 |
 |
| Module-wise count rates for Quadrant D Data is divided into 100 sec bins |
 |
 |
| Parameter | Plot |
|---|---|
| CZT HV Monitor | 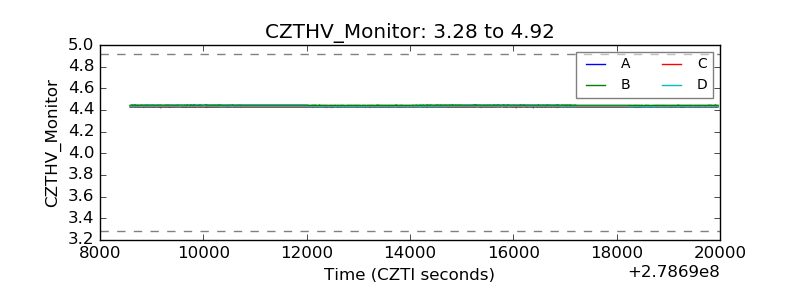 |
| D_VDD | 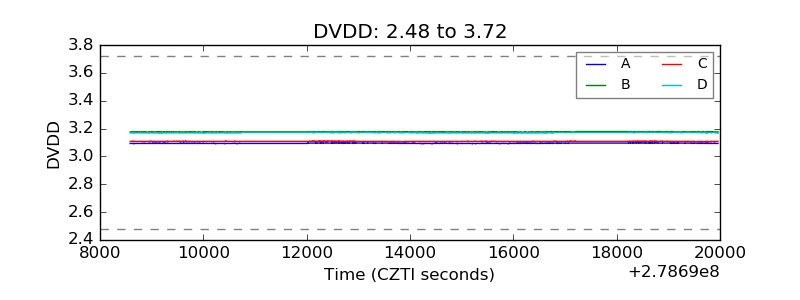 |
| Temperature 1 |  |
| Veto HV Monitor | 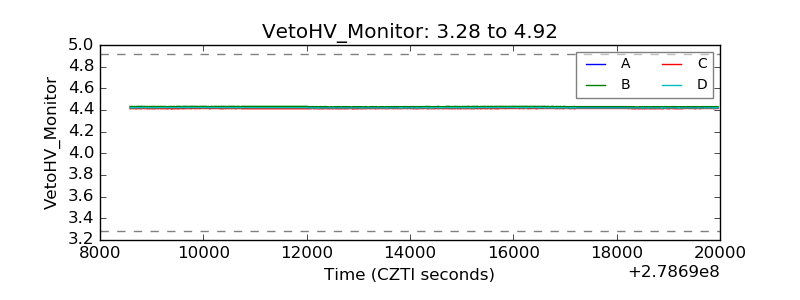 |
| Veto LLD | 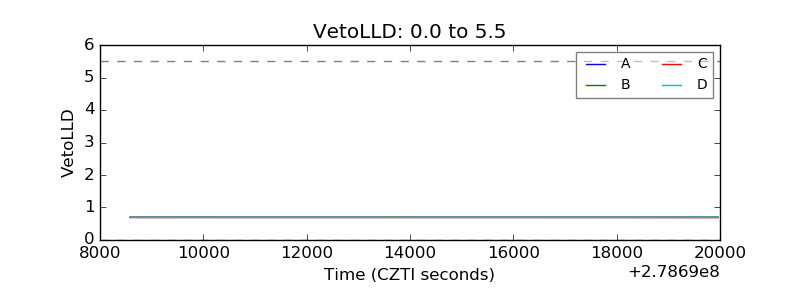 |
| Alpha Counter | 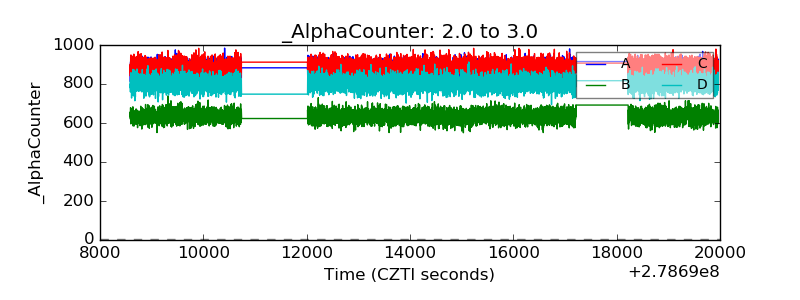 |
| _CPM_Rate | 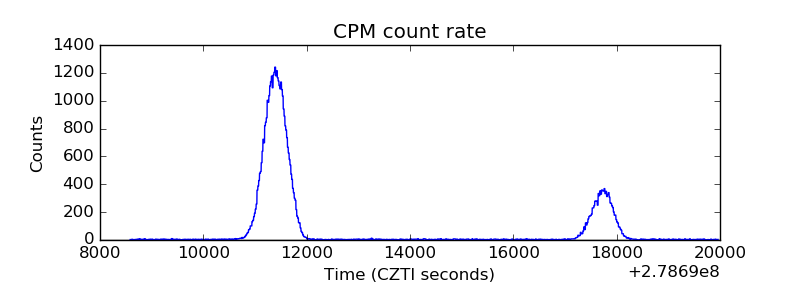 |
| CZT Counter | 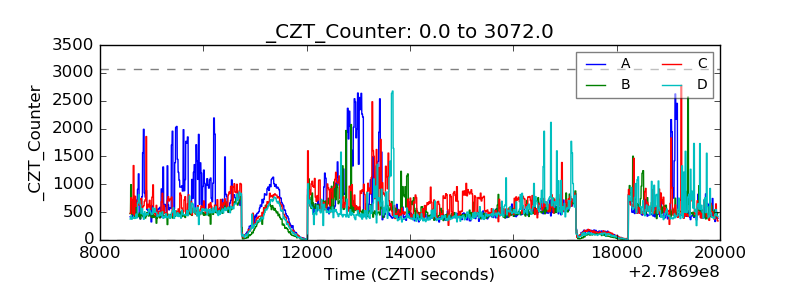 |
| +2.5 Volts monitor |  |
| +5 Volts monitor |  |
| _ROLL_ROT | 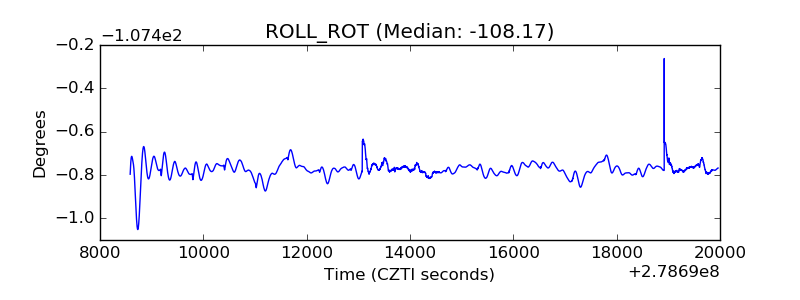 |
| _Roll_DEC | 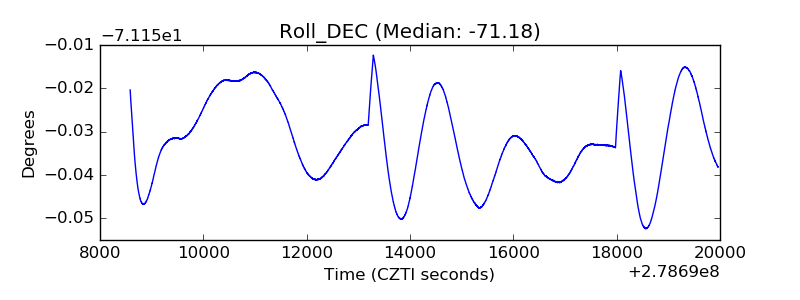 |
| _Roll_RA | 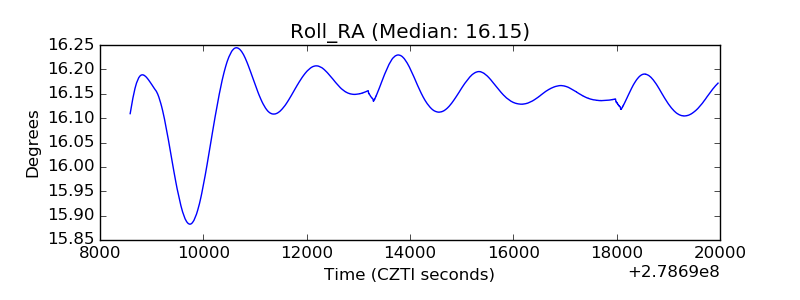 |
| Veto Counter | 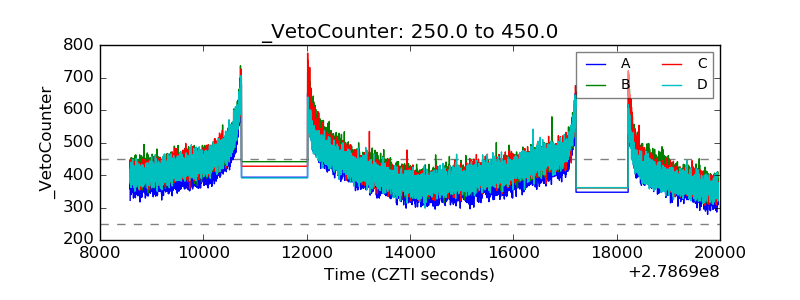 |