| Param | Original file | Final file |
|---|---|---|
| Filename | modeM0/AS1A05_059T04_9000002476_16719cztM0_level2.evt | modeM0/AS1A05_059T04_9000002476_16719cztM0_level2_quad_clean.evt |
| Size (bytes) | 325,800,000 | 71,311,680 |
| Size | 310.7 MB | 68.0 MB |
| Events in quadrant A | 3,320,222 | 474,851 |
| Events in quadrant B | 1,941,836 | 500,204 |
| Events in quadrant C | 2,530,992 | 468,231 |
| Events in quadrant D | 1,834,751 | 467,569 |
| Mode M0 | |||
|---|---|---|---|
| Quadrant | BADHDUFLAG | Total packets | Discarded packets |
| A | 0 | 12213 | 2 |
| B | 0 | 8070 | 1 |
| C | 0 | 9942 | 1 |
| D | 0 | 7666 | 1 |
| Mode SS | |||
|---|---|---|---|
| Quadrant | BADHDUFLAG | Total packets | Discarded packets |
| A | 0 | 72 | 0 |
| B | 0 | 72 | 0 |
| C | 0 | 72 | 0 |
| D | 0 | 72 | 0 |
| Mode M9 | |||
|---|---|---|---|
| Quadrant | BADHDUFLAG | Total packets | Discarded packets |
| A | 0 | 13 | 0 |
| B | 0 | 13 | 0 |
| C | 0 | 13 | 0 |
| D | 0 | 13 | 0 |
| Quadrant | Total seconds | Saturated seconds | Saturation percentage |
|---|---|---|---|
| A | 3508 | 401 | 11.431015% |
| B | 3508 | 83 | 2.366021% |
| C | 3508 | 142 | 4.047891% |
| D | 3508 | 36 | 1.026226% |
Noise dominated data is calculated using 1-second bins in cleaned event files. If a bin has >2000 counts, and if more than 50% of those come from <1% of pixels, then it is considered to be noise-dominated and hence unusable.
| Quadrant | # 1 sec bins | Bins with >0 counts | Bins with >2000 counts | High rate bins dominated by noise | Noise dominated (total time) | Noise dominated (detector-on time) | Marked lightcurve |
|---|---|---|---|---|---|---|---|
| A | 4789 | 3510 | 269 | 269 | 5.62% | 7.66% | 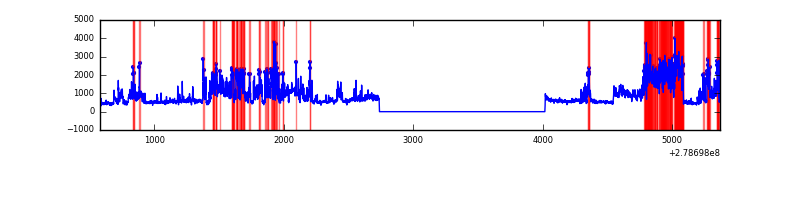 |
| B | 4789 | 3510 | 10 | 10 | 0.21% | 0.28% | 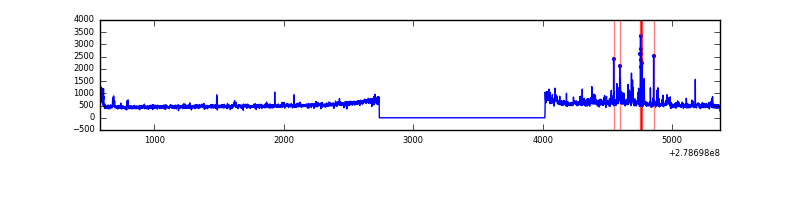 |
| C | 4789 | 3510 | 30 | 30 | 0.63% | 0.85% | 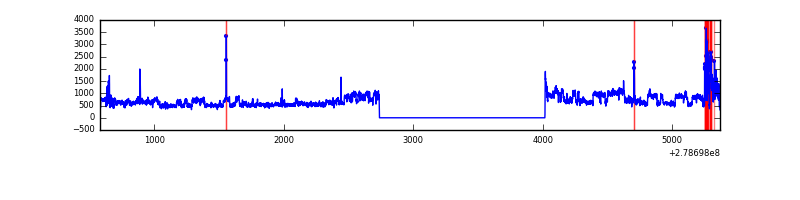 |
| D | 4789 | 3510 | 3 | 3 | 0.06% | 0.09% | 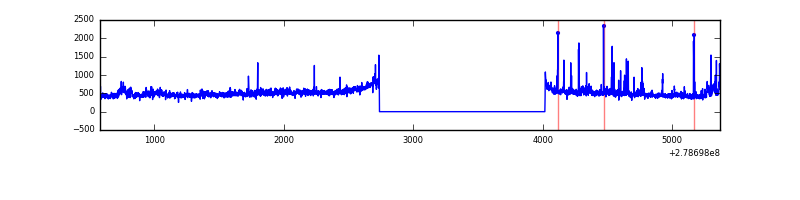 |
Top three noisy pixels from each quadrant. If the there are fewer than three noisy pixels in the level2.evt file, extra rows are filled as -1
| Pixel properties | Quadrant properties | ||||||
|---|---|---|---|---|---|---|---|
| Quadrant | DetID | PixID | Counts | Sigma | Mean | Median | Sigma |
| A | 15 | 174 | 1648177 | 18904.21 | 430 | 421 | 87.2 |
| A | 10 | 234 | 11536 | 127.52 | 430 | 421 | 87.2 |
| A | 0 | 226 | 3949 | 40.48 | 430 | 421 | 87.2 |
| B | 7 | 220 | 90353 | 1077.86 | 443 | 433 | 83.4 |
| B | 15 | 35 | 26666 | 314.45 | 443 | 433 | 83.4 |
| B | 0 | 229 | 18223 | 213.25 | 443 | 433 | 83.4 |
| C | 3 | 233 | 633455 | 6420.68 | 421 | 423 | 98.6 |
| C | 0 | 207 | 137400 | 1389.32 | 421 | 423 | 98.6 |
| C | 14 | 238 | 65968 | 664.81 | 421 | 423 | 98.6 |
| D | 1 | 52 | 145465 | 1384.53 | 429 | 415 | 104.8 |
| D | 11 | 176 | 30239 | 284.68 | 429 | 415 | 104.8 |
| D | 2 | 234 | 15669 | 145.6 | 429 | 415 | 104.8 |
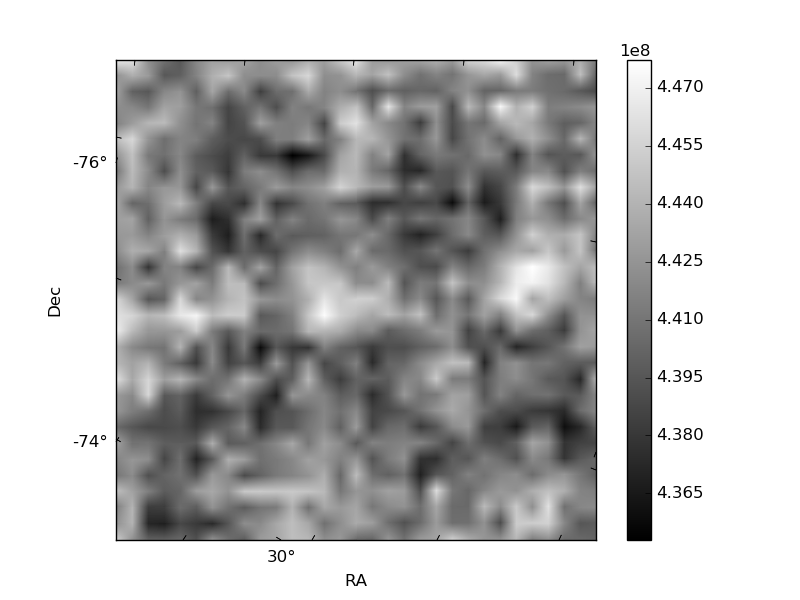
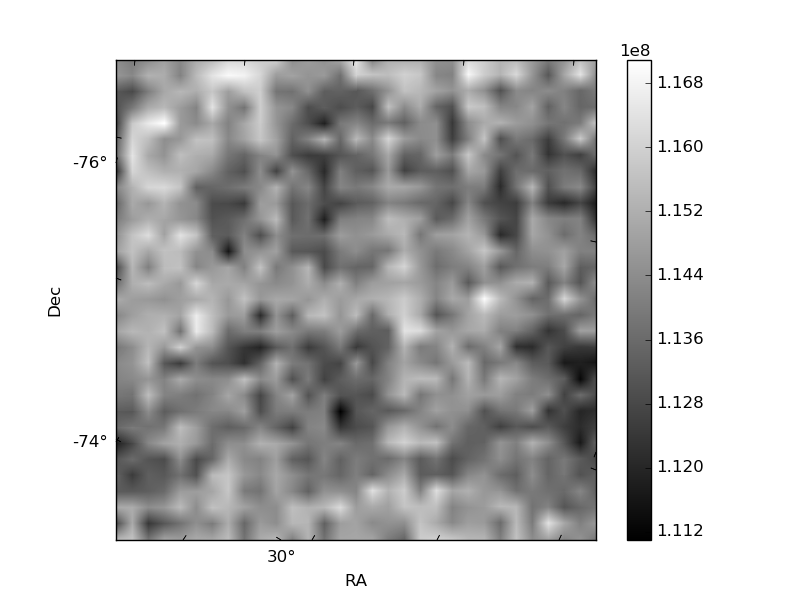
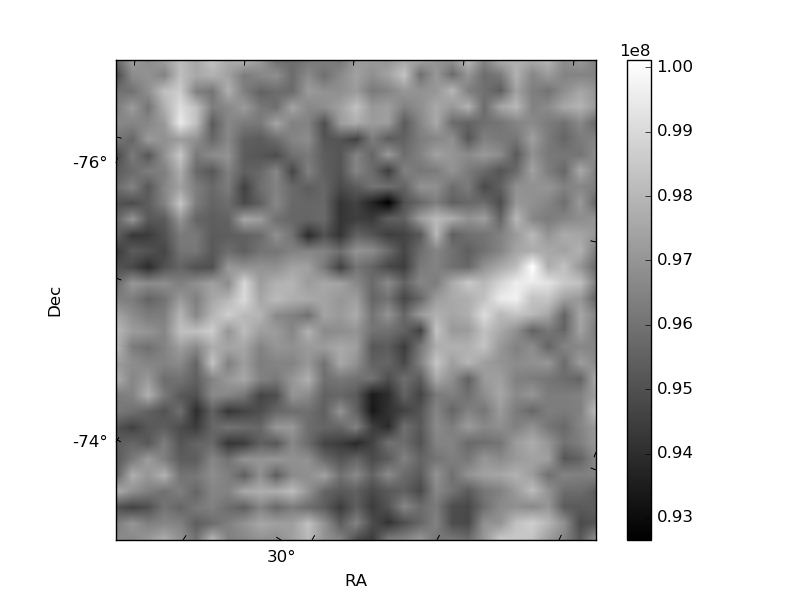
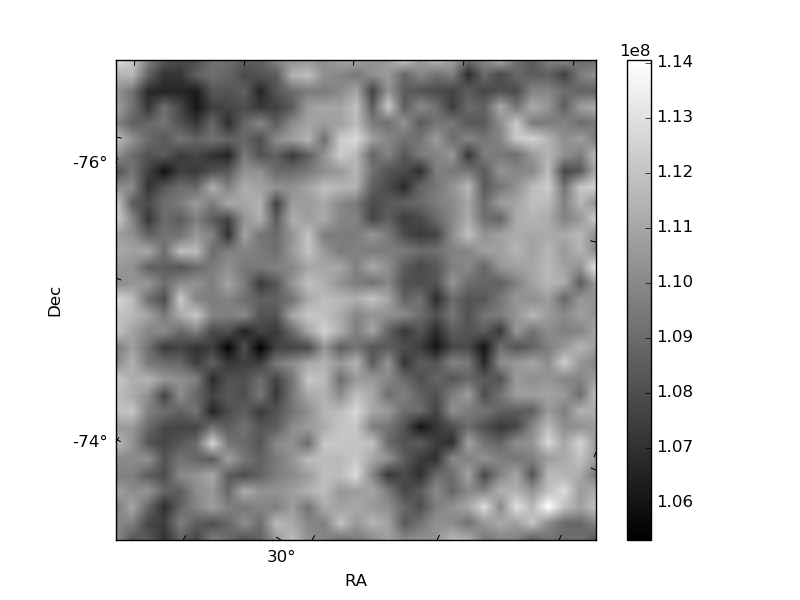
Histogram calculated using DETX and DETY for each event in the final _common_clean file
| Quadrant A | 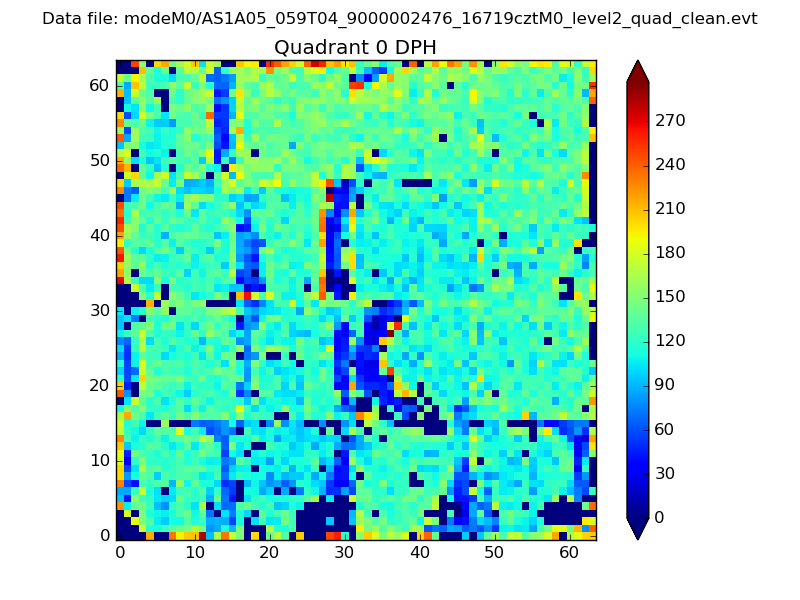 |
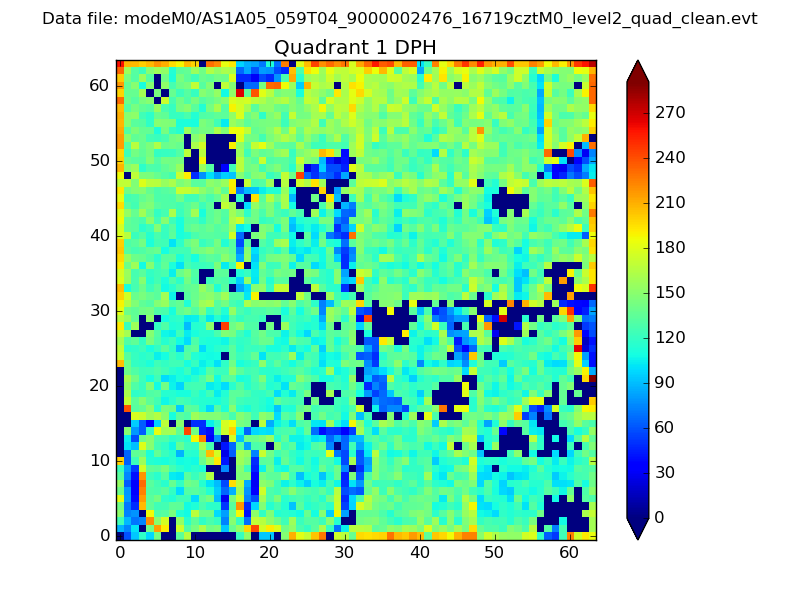 |
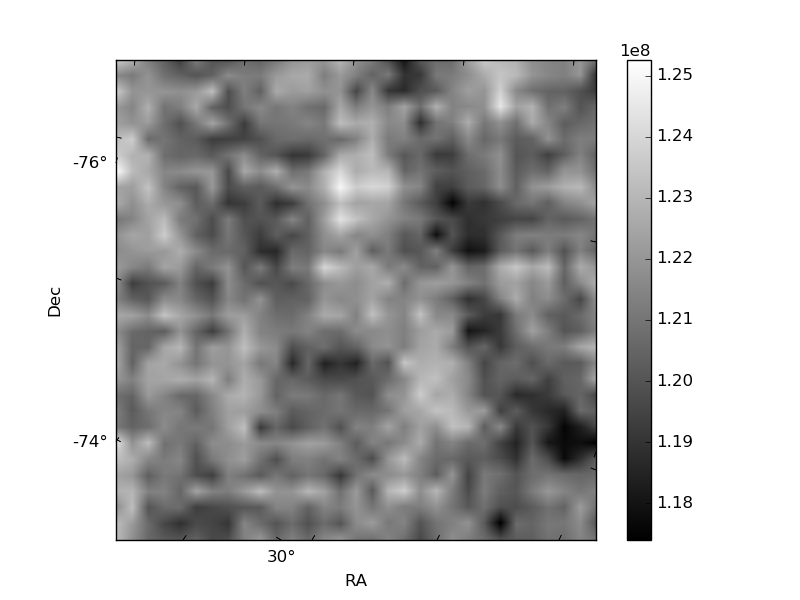
Quadrant B |
|---|---|---|---|
| Quadrant D | 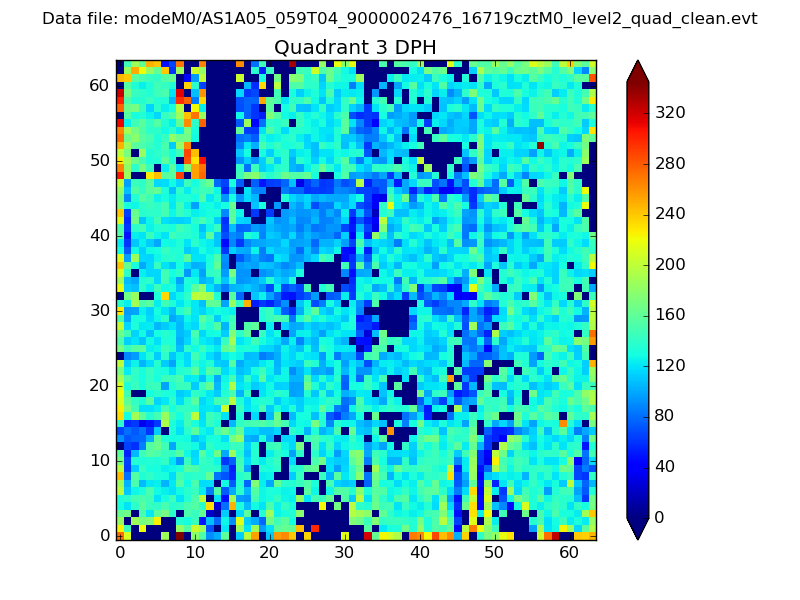 |
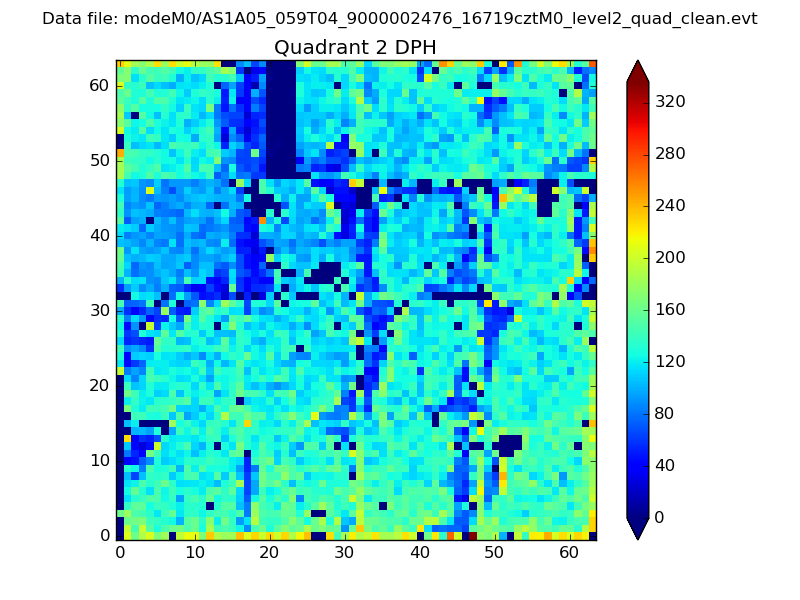 |
Quadrant C |
| Plot type | Count rate plots | Images |
|---|---|---|
| Comparison with Poisson distribution Blue bars denote a histogram of data divided into 1 sec bins. Red curve is a Poisson curve with rate = median count rate of data. |
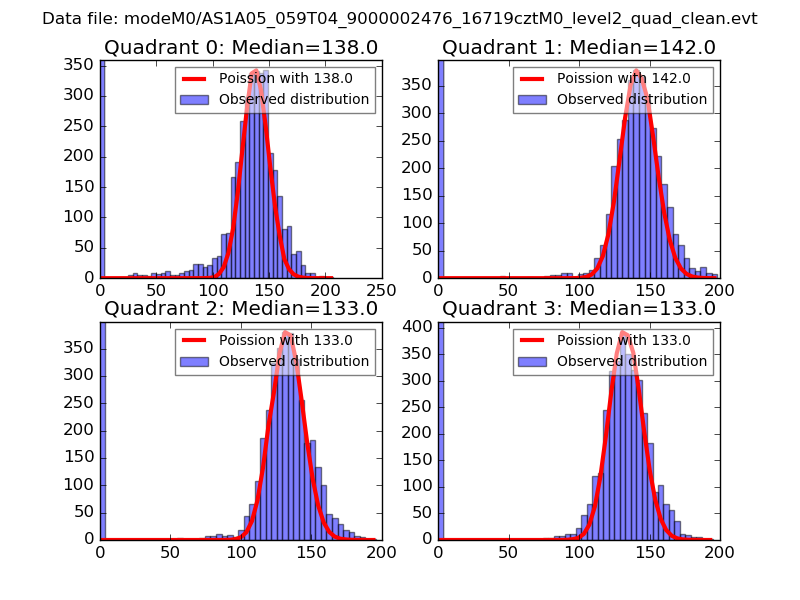 |
 |
| Quadrant-wise count rates Data is divided into 100 sec bins |
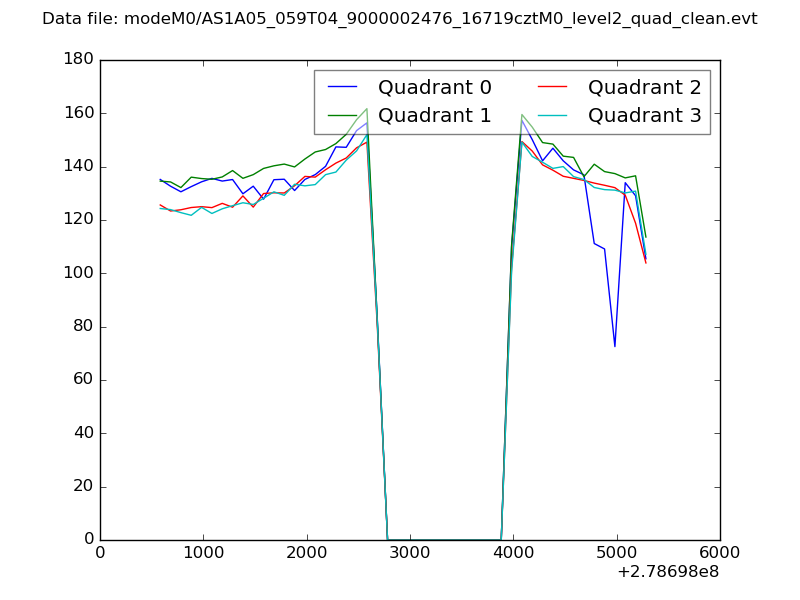 |
|
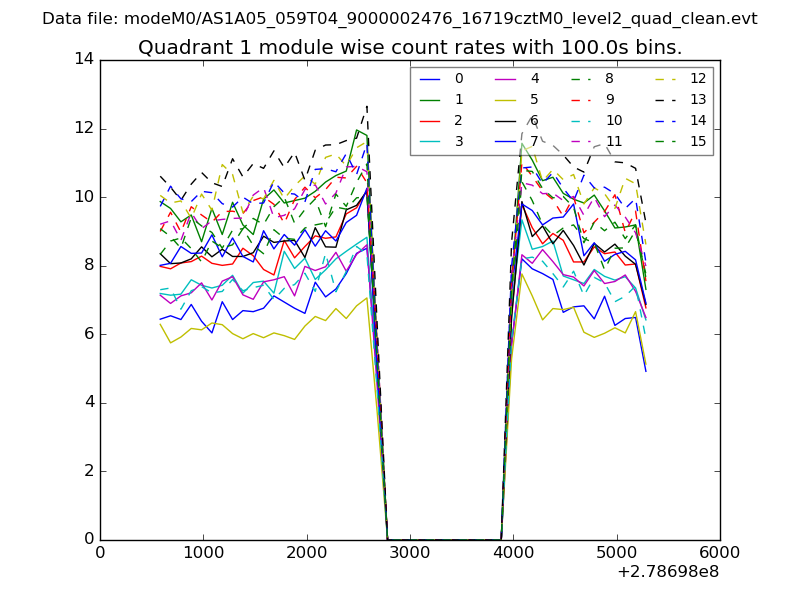
| Module-wise count rates for Quadrant A Data is divided into 100 sec bins |
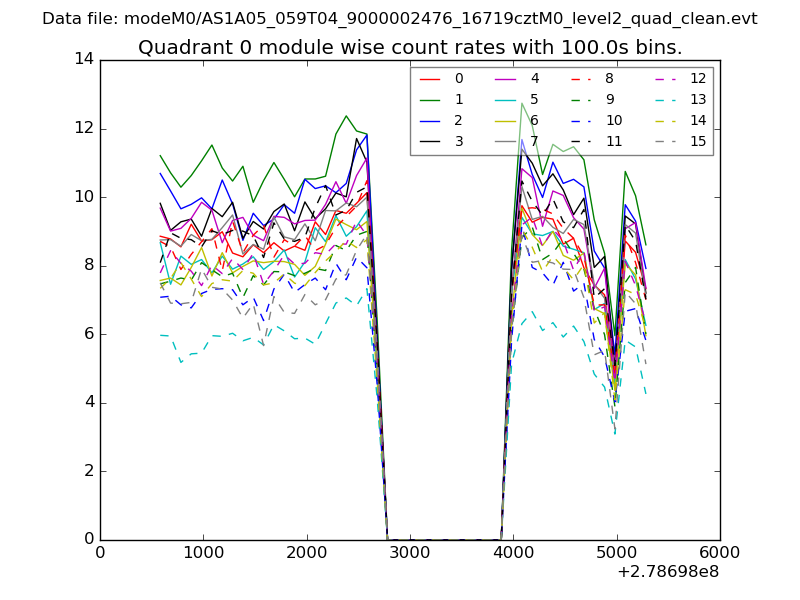 |
 |
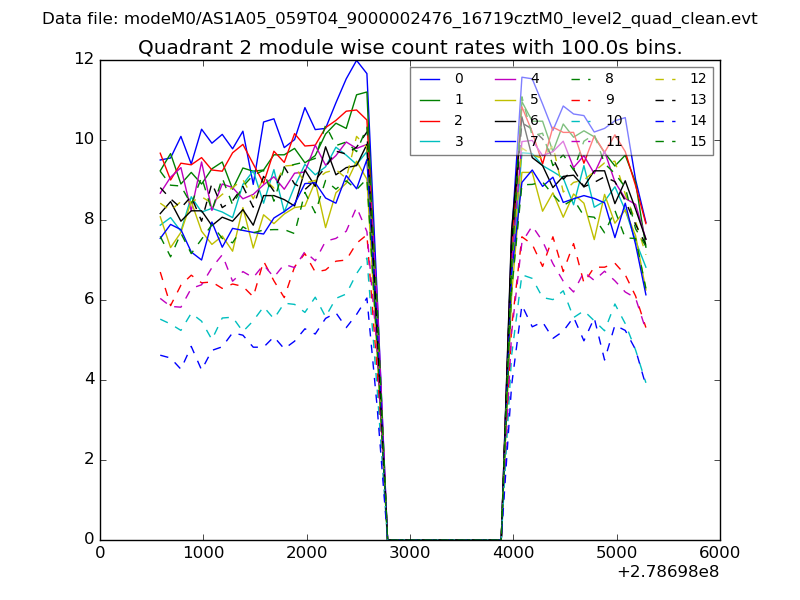
| Module-wise count rates for Quadrant B Data is divided into 100 sec bins |
 |
 |
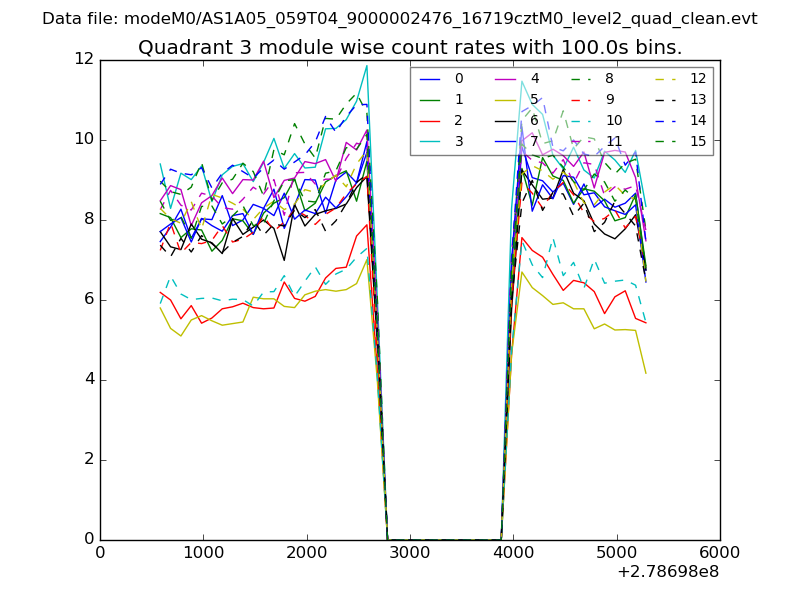
| Module-wise count rates for Quadrant C Data is divided into 100 sec bins |
 |
 |
| Module-wise count rates for Quadrant D Data is divided into 100 sec bins |
 |
 |
| Parameter | Plot |
|---|---|
| CZT HV Monitor | 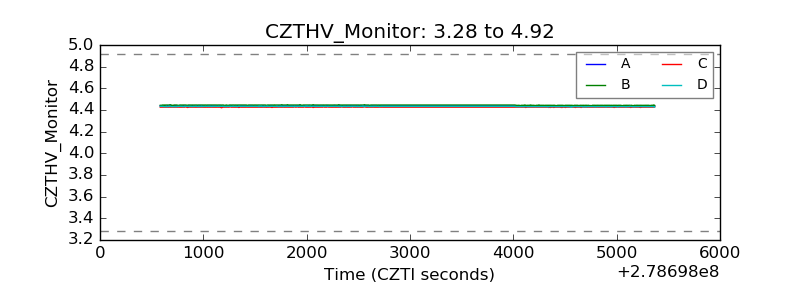 |
| D_VDD | 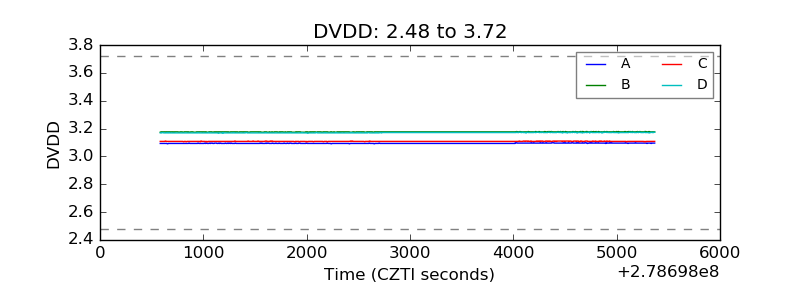 |
| Temperature 1 | 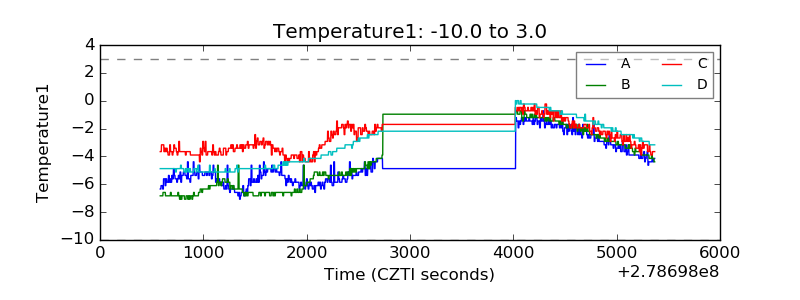 |
| Veto HV Monitor | 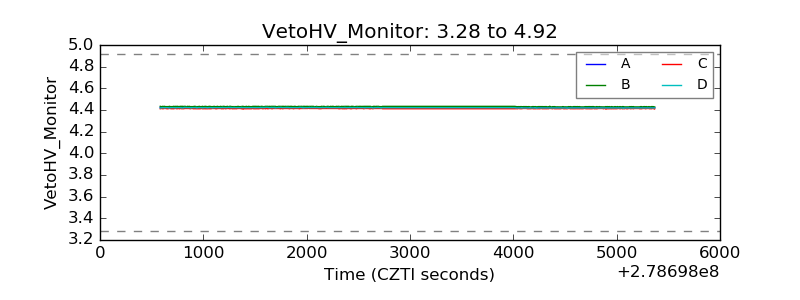 |
| Veto LLD |  |
| Alpha Counter | 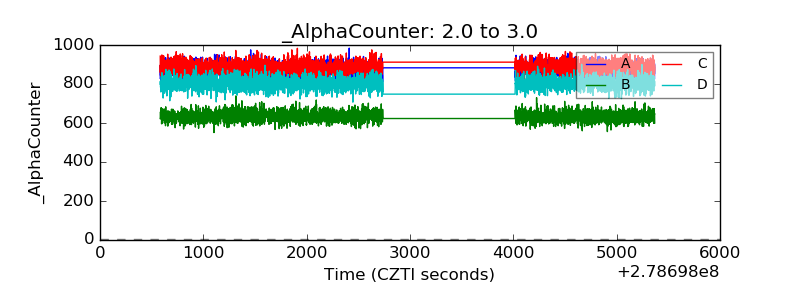 |
| _CPM_Rate | 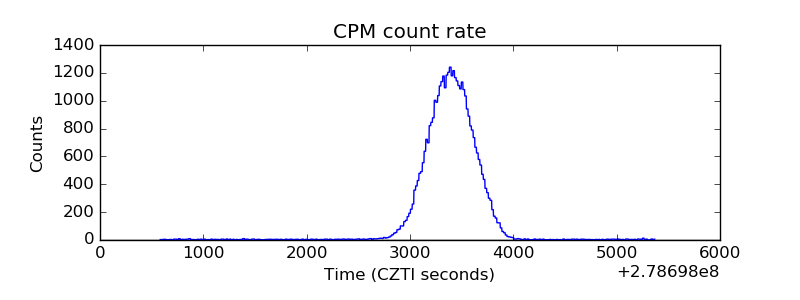 |
| CZT Counter | 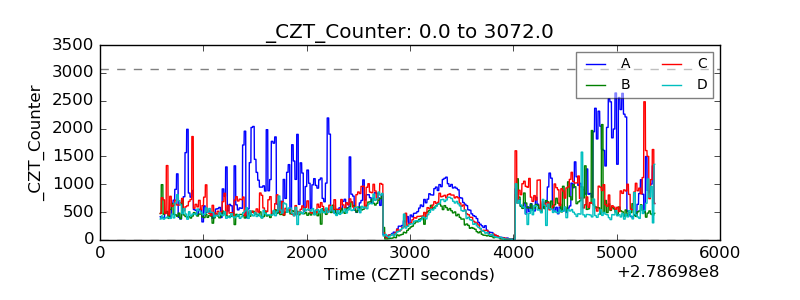 |
| +2.5 Volts monitor | 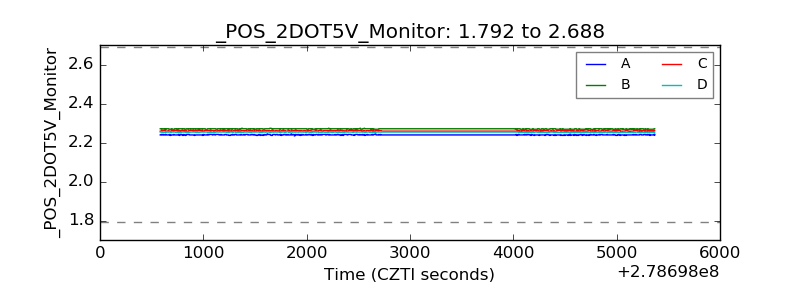 |
| +5 Volts monitor |  |
| _ROLL_ROT | 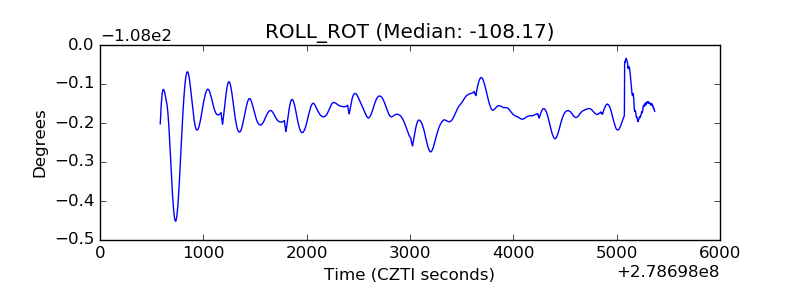 |
| _Roll_DEC | 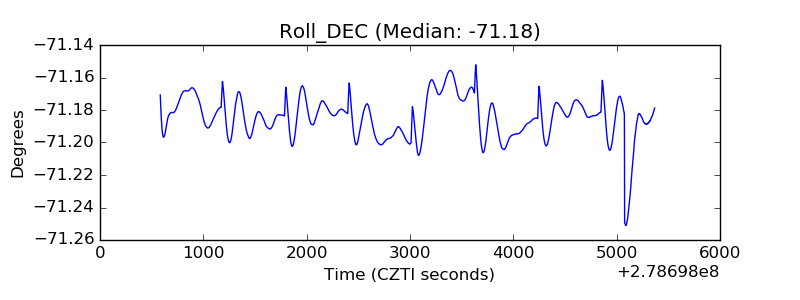 |
| _Roll_RA | 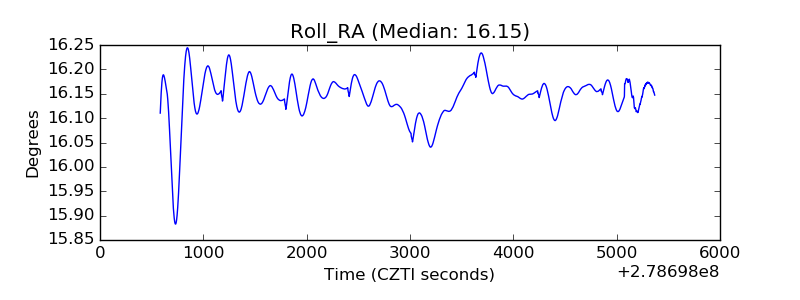 |
| Veto Counter | 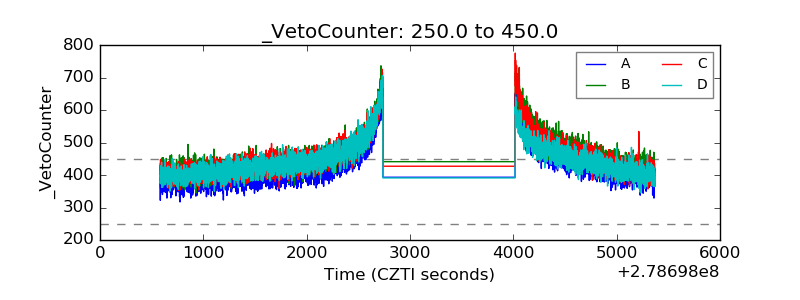 |