| Param | Original file | Final file |
|---|---|---|
| Filename | modeM0/AS1A05_059T04_9000002476_16720cztM0_level2.evt | modeM0/AS1A05_059T04_9000002476_16720cztM0_level2_quad_clean.evt |
| Size (bytes) | 554,731,200 | 129,591,360 |
| Size | 529.0 MB | 123.6 MB |
| Events in quadrant A | 4,253,603 | 868,379 |
| Events in quadrant B | 3,759,628 | 900,318 |
| Events in quadrant C | 4,504,777 | 849,536 |
| Events in quadrant D | 3,831,584 | 843,281 |
| Mode M0 | |||
|---|---|---|---|
| Quadrant | BADHDUFLAG | Total packets | Discarded packets |
| A | 0 | 17168 | 3 |
| B | 0 | 15465 | 2 |
| C | 0 | 17958 | 2 |
| D | 0 | 16038 | 2 |
| Mode SS | |||
|---|---|---|---|
| Quadrant | BADHDUFLAG | Total packets | Discarded packets |
| A | 0 | 134 | 0 |
| B | 0 | 134 | 0 |
| C | 0 | 134 | 0 |
| D | 0 | 134 | 0 |
| Mode M9 | |||
|---|---|---|---|
| Quadrant | BADHDUFLAG | Total packets | Discarded packets |
| A | 0 | 12 | 0 |
| B | 0 | 12 | 0 |
| C | 0 | 12 | 0 |
| D | 0 | 13 | 0 |
| Quadrant | Total seconds | Saturated seconds | Saturation percentage |
|---|---|---|---|
| A | 6649 | 373 | 5.609866% |
| B | 6649 | 101 | 1.519025% |
| C | 6649 | 159 | 2.391337% |
| D | 6649 | 108 | 1.624304% |
Noise dominated data is calculated using 1-second bins in cleaned event files. If a bin has >2000 counts, and if more than 50% of those come from <1% of pixels, then it is considered to be noise-dominated and hence unusable.
| Quadrant | # 1 sec bins | Bins with >0 counts | Bins with >2000 counts | High rate bins dominated by noise | Noise dominated (total time) | Noise dominated (detector-on time) | Marked lightcurve |
|---|---|---|---|---|---|---|---|
| A | 7660 | 6651 | 275 | 275 | 3.59% | 4.13% | 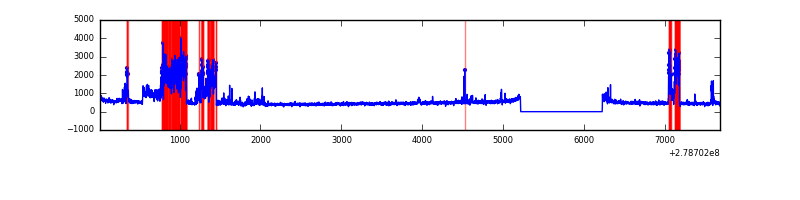 |
| B | 7660 | 6651 | 20 | 20 | 0.26% | 0.30% | 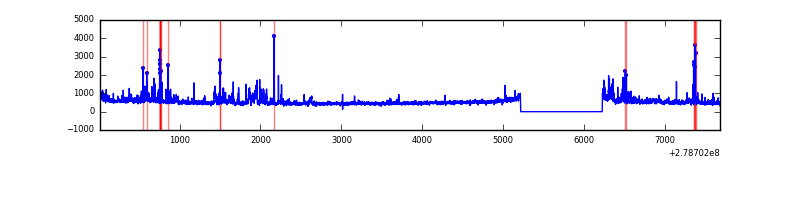 |
| C | 7660 | 6651 | 51 | 51 | 0.67% | 0.77% | 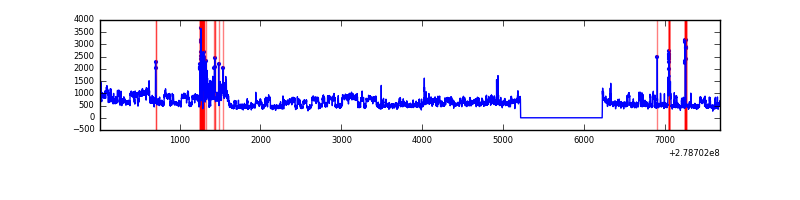 |
| D | 7660 | 6651 | 76 | 76 | 0.99% | 1.14% | 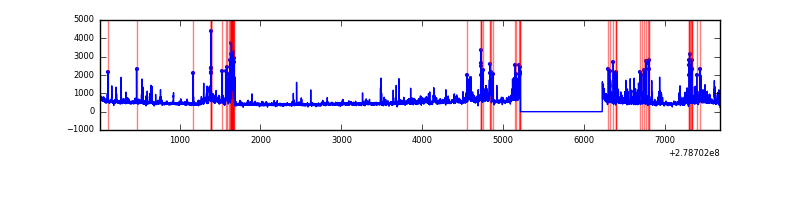 |
Top three noisy pixels from each quadrant. If the there are fewer than three noisy pixels in the level2.evt file, extra rows are filled as -1
| Pixel properties | Quadrant properties | ||||||
|---|---|---|---|---|---|---|---|
| Quadrant | DetID | PixID | Counts | Sigma | Mean | Median | Sigma |
| A | 15 | 174 | 1131780 | 7191.49 | 782 | 765 | 157.3 |
| A | 10 | 234 | 92406 | 582.69 | 782 | 765 | 157.3 |
| A | 9 | 143 | 15332 | 92.62 | 782 | 765 | 157.3 |
| B | 15 | 35 | 202409 | 1348.15 | 798 | 778 | 149.6 |
| B | 3 | 209 | 95075 | 630.49 | 798 | 778 | 149.6 |
| B | 7 | 220 | 94350 | 625.64 | 798 | 778 | 149.6 |
| C | 3 | 233 | 1142730 | 6582.13 | 754 | 759 | 173.5 |
| C | 0 | 207 | 258352 | 1484.72 | 754 | 759 | 173.5 |
| C | 14 | 238 | 118695 | 679.76 | 754 | 759 | 173.5 |
| D | 1 | 52 | 509635 | 2751.66 | 763 | 739 | 184.9 |
| D | 10 | 70 | 284505 | 1534.36 | 763 | 739 | 184.9 |
| D | 11 | 176 | 87663 | 470.01 | 763 | 739 | 184.9 |
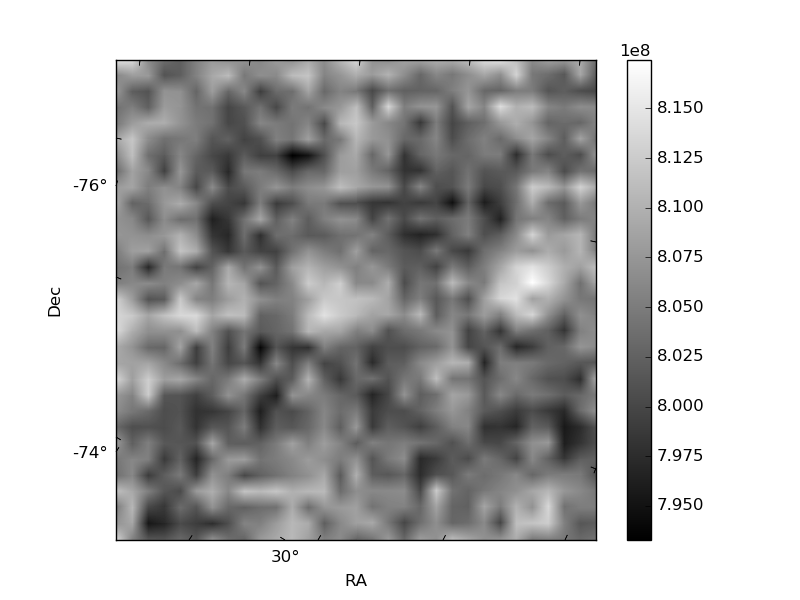
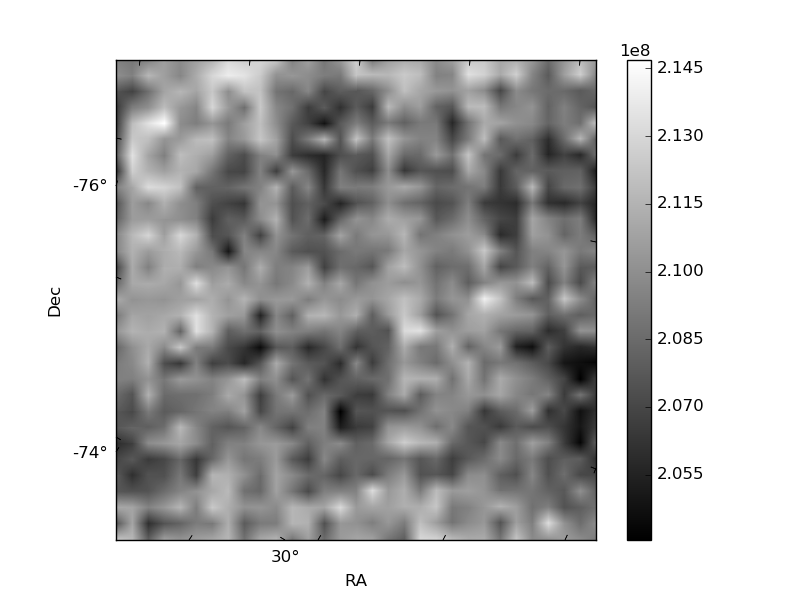
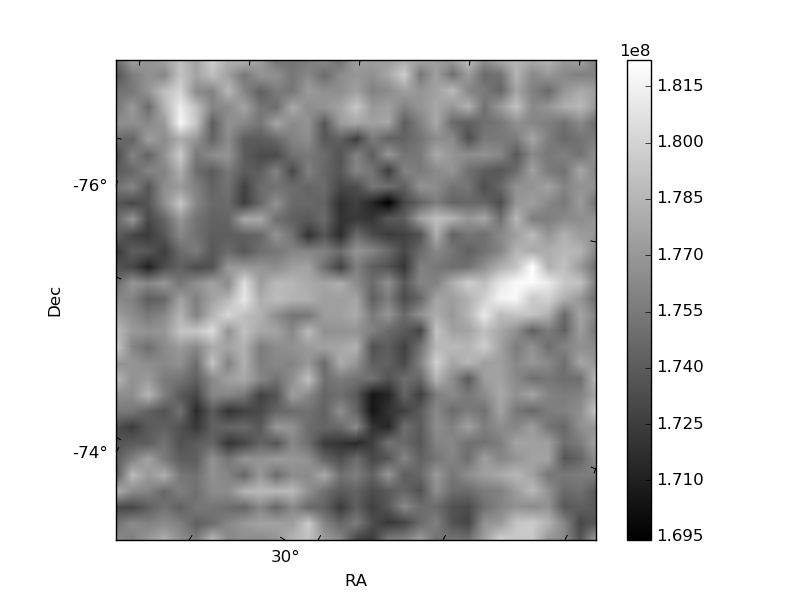
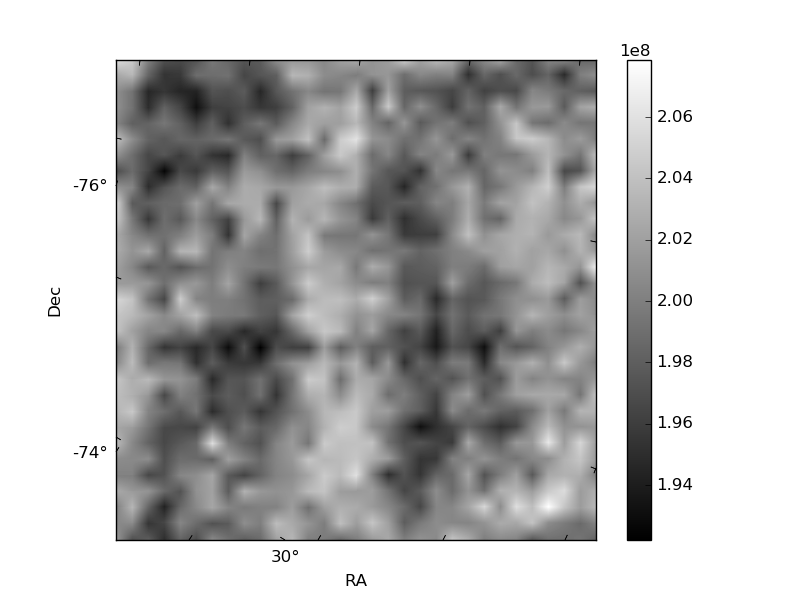
Histogram calculated using DETX and DETY for each event in the final _common_clean file
| Quadrant A | 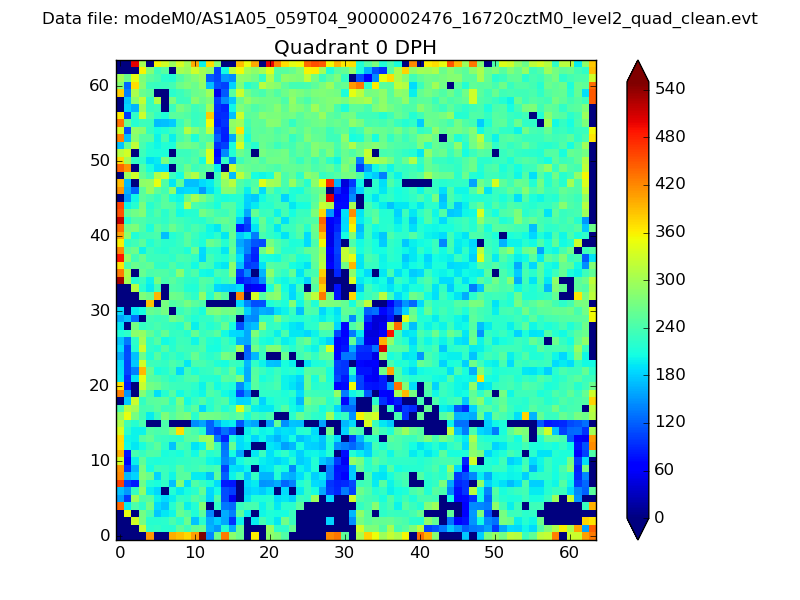 |
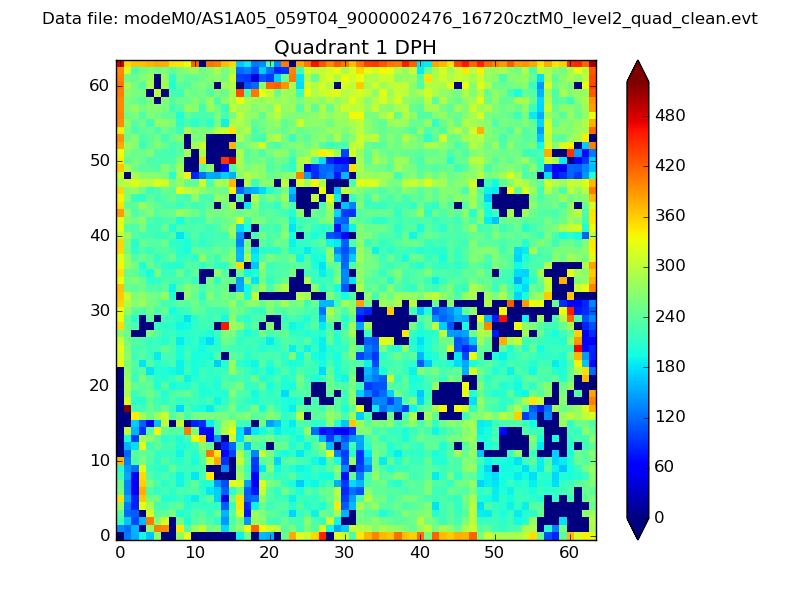 |
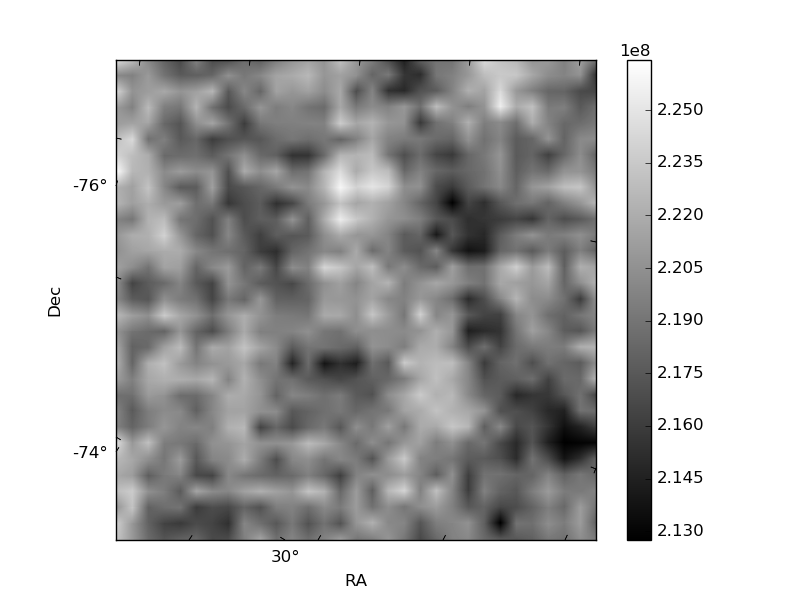
Quadrant B |
|---|---|---|---|
| Quadrant D | 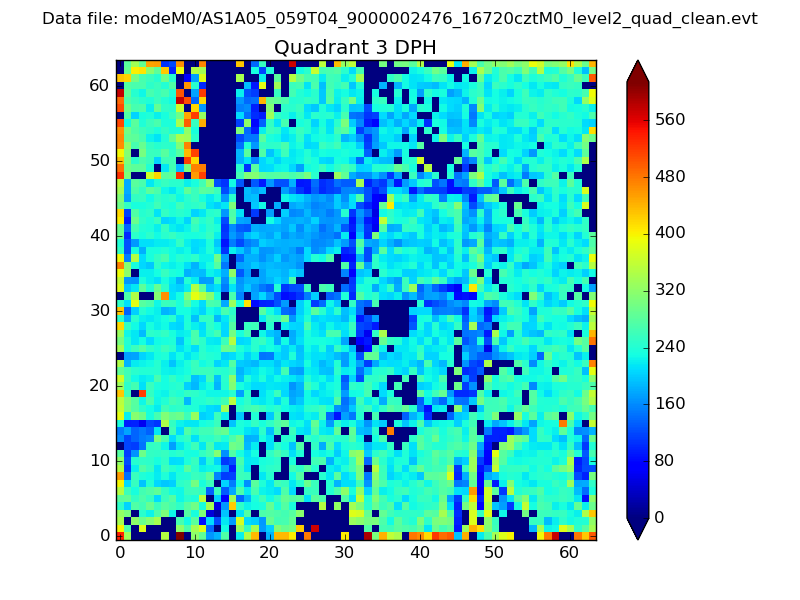 |
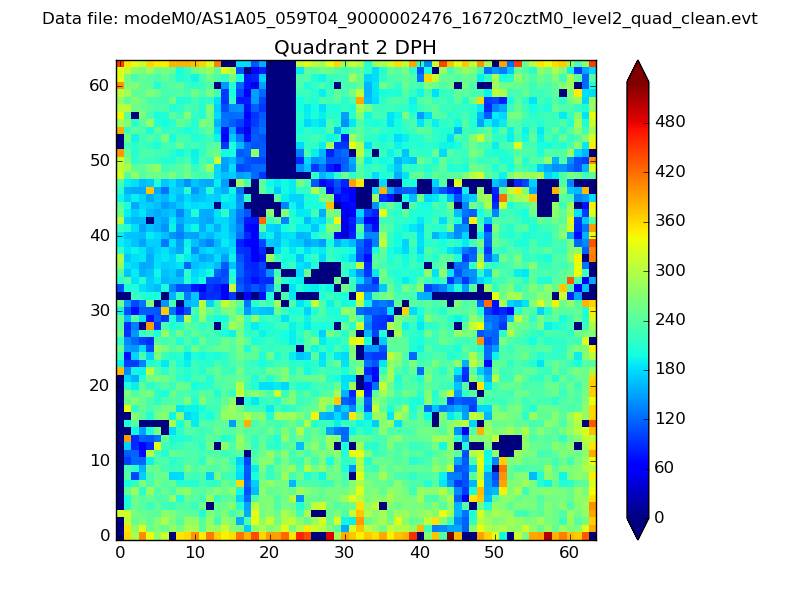 |
Quadrant C |
| Plot type | Count rate plots | Images |
|---|---|---|
| Comparison with Poisson distribution Blue bars denote a histogram of data divided into 1 sec bins. Red curve is a Poisson curve with rate = median count rate of data. |
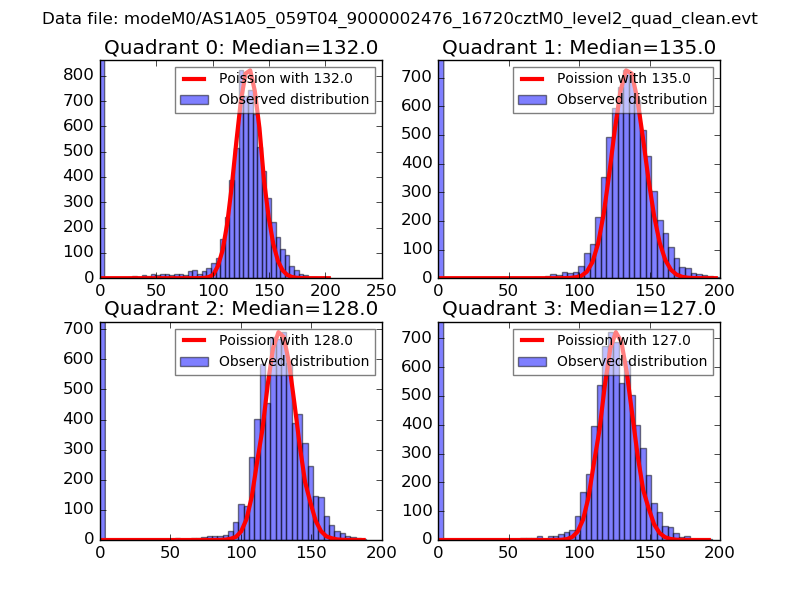 |
 |
| Quadrant-wise count rates Data is divided into 100 sec bins |
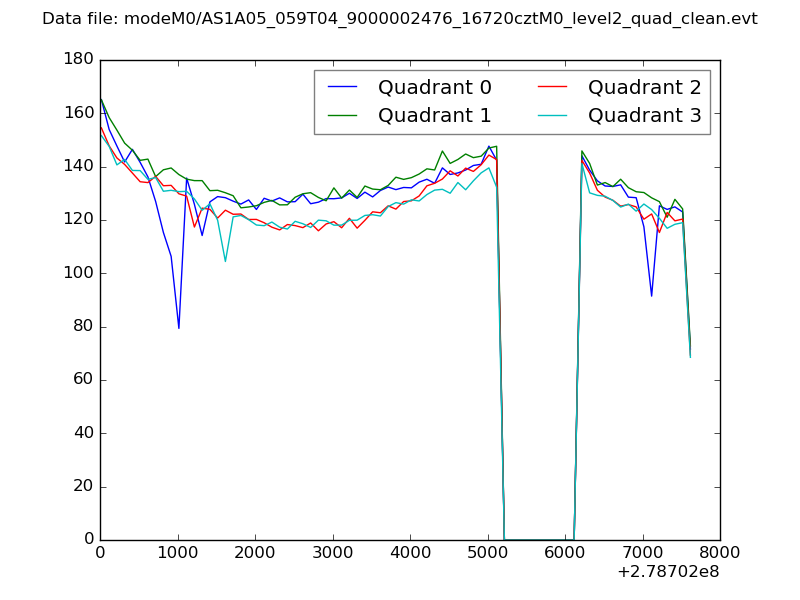 |
|
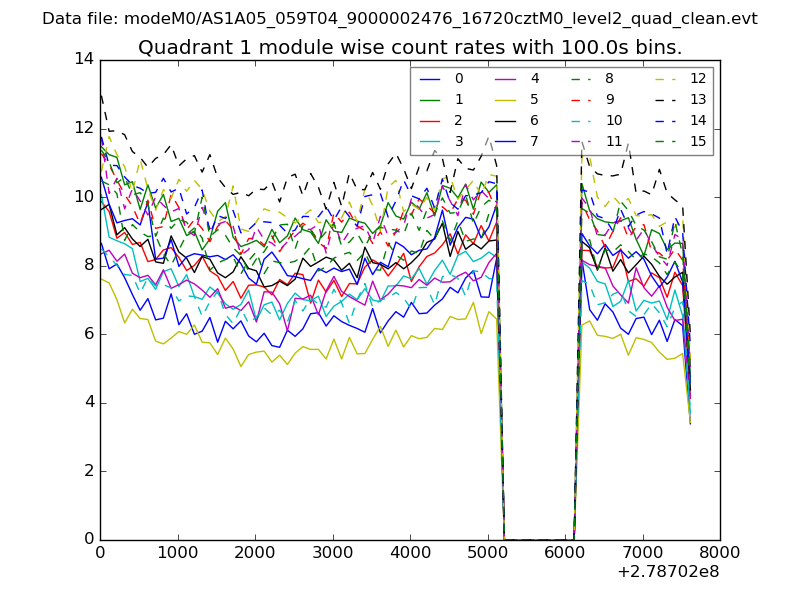
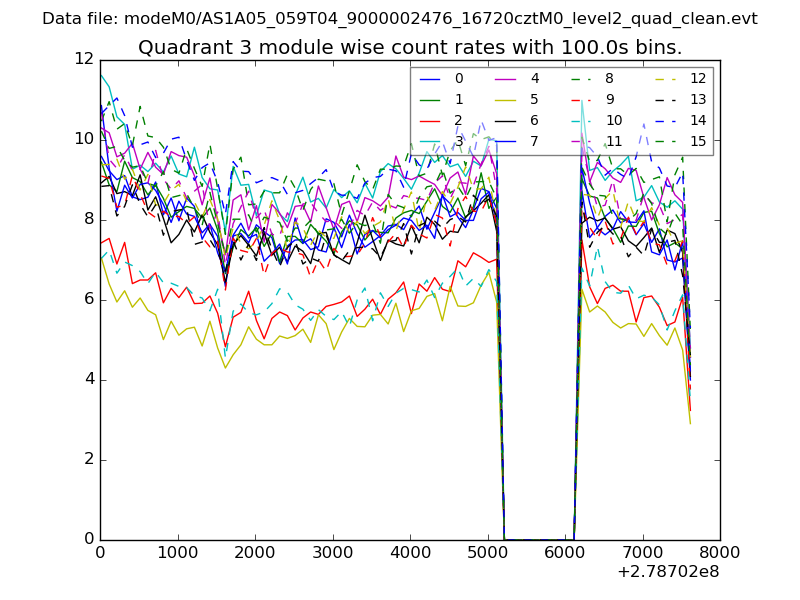
| Module-wise count rates for Quadrant A Data is divided into 100 sec bins |
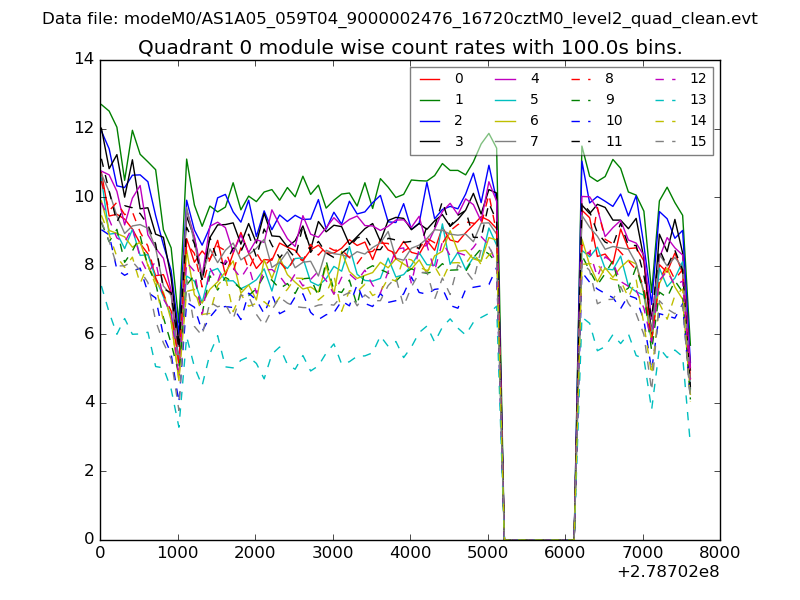 |
 |
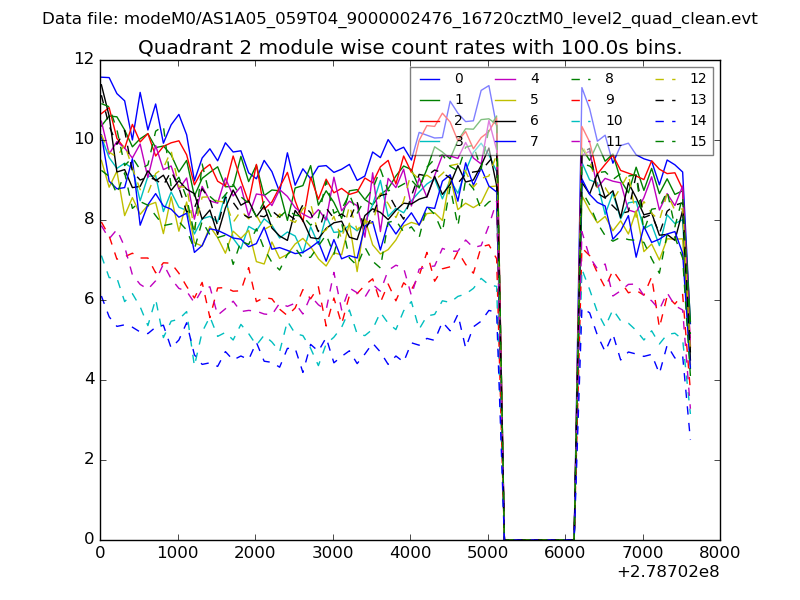
| Module-wise count rates for Quadrant B Data is divided into 100 sec bins |
 |
 |
| Module-wise count rates for Quadrant C Data is divided into 100 sec bins |
 |
 |
| Module-wise count rates for Quadrant D Data is divided into 100 sec bins |
 |
 |
| Parameter | Plot |
|---|---|
| CZT HV Monitor | 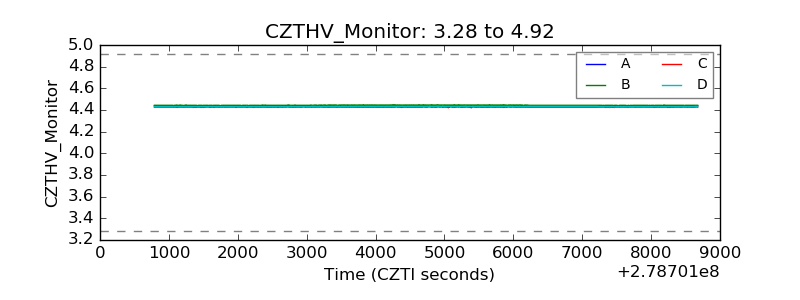 |
| D_VDD | 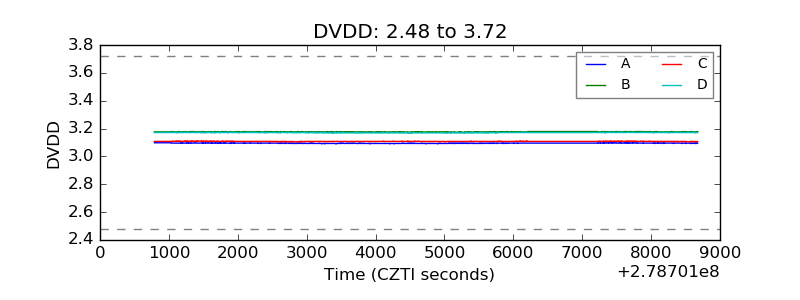 |
| Temperature 1 | 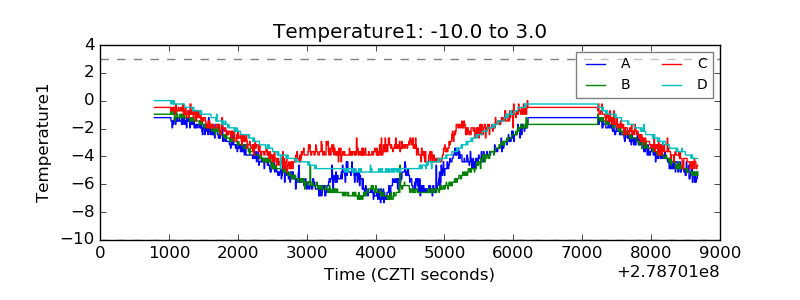 |
| Veto HV Monitor | 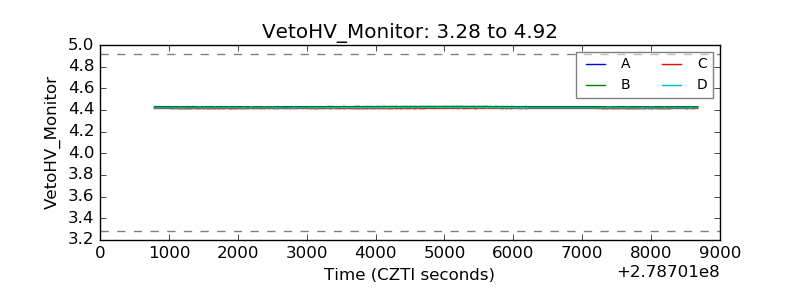 |
| Veto LLD | 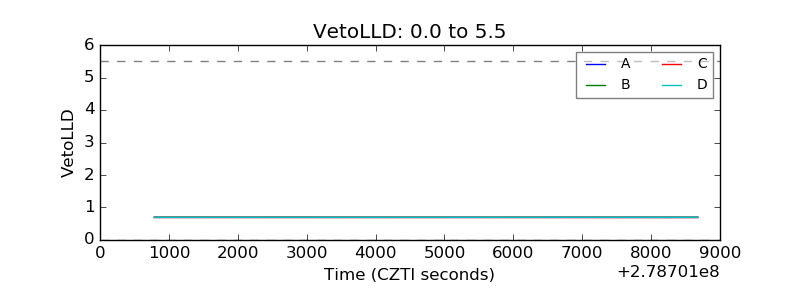 |
| Alpha Counter | 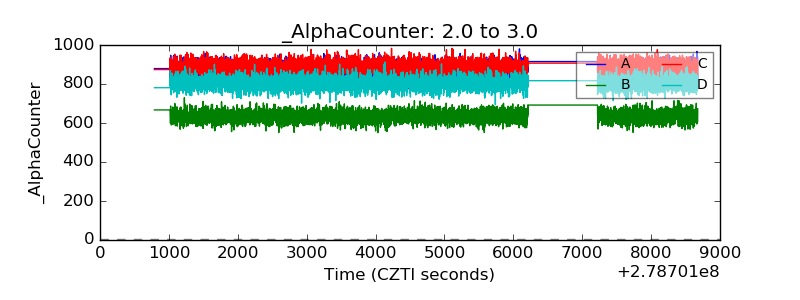 |
| _CPM_Rate | 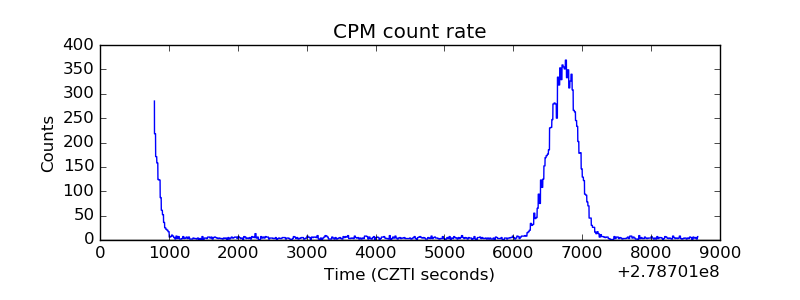 |
| CZT Counter | 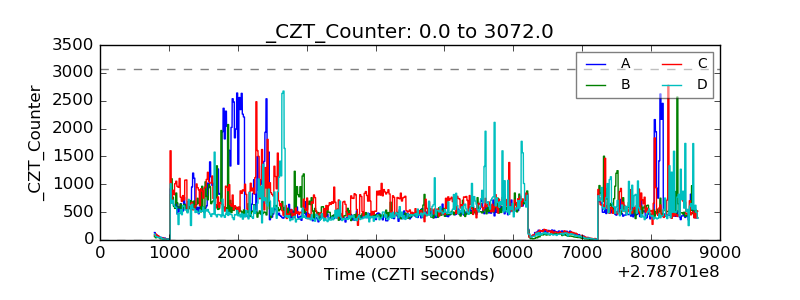 |
| +2.5 Volts monitor |  |
| +5 Volts monitor | 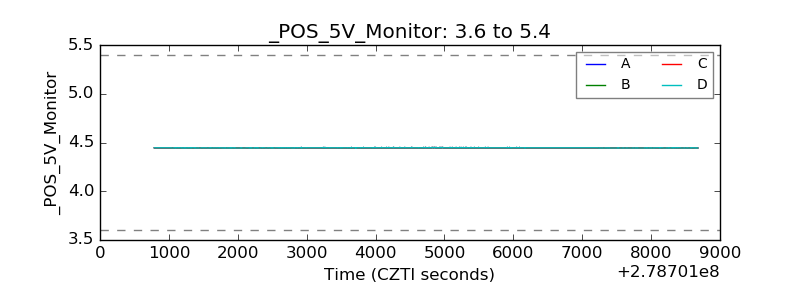 |
| _ROLL_ROT | 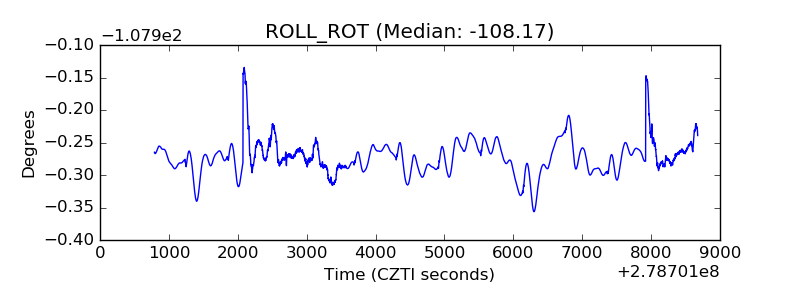 |
| _Roll_DEC | 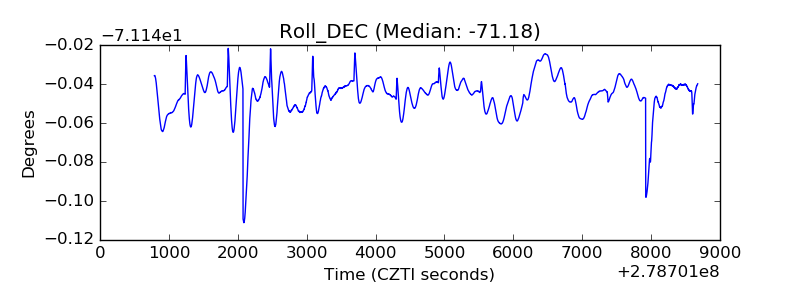 |
| _Roll_RA | 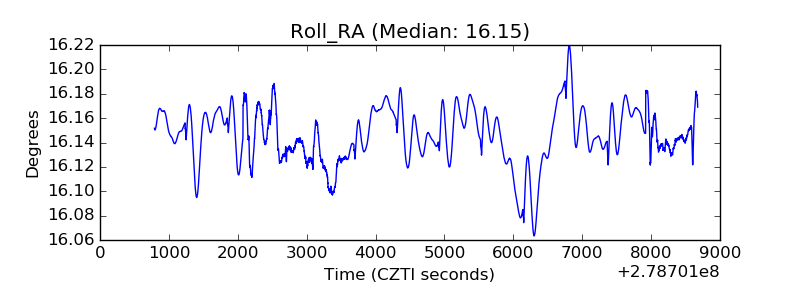 |
| Veto Counter | 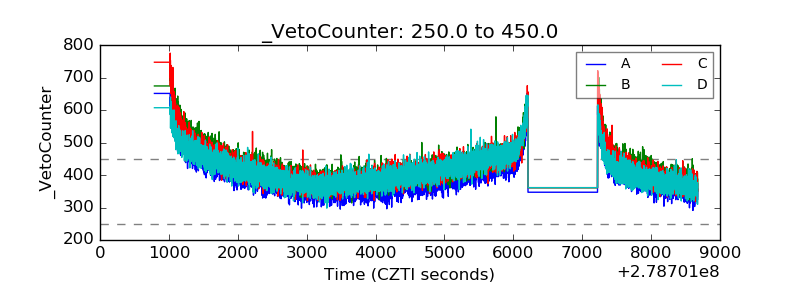 |