| Param | Original file | Final file |
|---|---|---|
| Filename | modeM0/AS1A05_059T04_9000002476_16721cztM0_level2.evt | modeM0/AS1A05_059T04_9000002476_16721cztM0_level2_quad_clean.evt |
| Size (bytes) | 144,218,880 | 33,229,440 |
| Size | 137.5 MB | 31.7 MB |
| Events in quadrant A | 1,059,767 | 219,758 |
| Events in quadrant B | 1,041,252 | 226,794 |
| Events in quadrant C | 1,028,697 | 216,523 |
| Events in quadrant D | 1,117,318 | 215,439 |
| Mode M0 | |||
|---|---|---|---|
| Quadrant | BADHDUFLAG | Total packets | Discarded packets |
| A | 0 | 4288 | 1 |
| B | 0 | 4192 | 1 |
| C | 0 | 4206 | 1 |
| D | 0 | 4508 | 1 |
| Mode SS | |||
|---|---|---|---|
| Quadrant | BADHDUFLAG | Total packets | Discarded packets |
| A | 0 | 34 | 0 |
| B | 0 | 34 | 0 |
| C | 0 | 34 | 0 |
| D | 0 | 34 | 0 |
| Mode M9 | |||
|---|---|---|---|
| Quadrant | BADHDUFLAG | Total packets | Discarded packets |
| A | 0 | 4 | 0 |
| B | 0 | 4 | 0 |
| C | 0 | 4 | 0 |
| D | 0 | 5 | 0 |
| Quadrant | Total seconds | Saturated seconds | Saturation percentage |
|---|---|---|---|
| A | 1740 | 90 | 5.172414% |
| B | 1740 | 41 | 2.356322% |
| C | 1740 | 36 | 2.068966% |
| D | 1740 | 28 | 1.609195% |
Noise dominated data is calculated using 1-second bins in cleaned event files. If a bin has >2000 counts, and if more than 50% of those come from <1% of pixels, then it is considered to be noise-dominated and hence unusable.
| Quadrant | # 1 sec bins | Bins with >0 counts | Bins with >2000 counts | High rate bins dominated by noise | Noise dominated (total time) | Noise dominated (detector-on time) | Marked lightcurve |
|---|---|---|---|---|---|---|---|
| A | 1741 | 1741 | 62 | 62 | 3.56% | 3.56% | 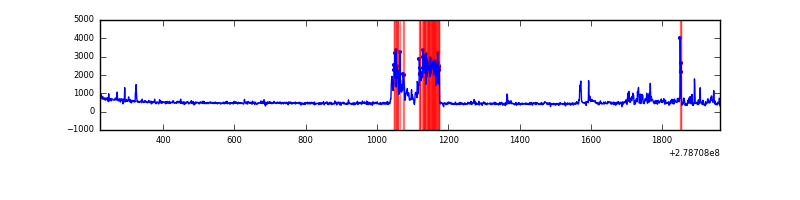 |
| B | 1741 | 1741 | 7 | 7 | 0.40% | 0.40% |  |
| C | 1741 | 1741 | 18 | 18 | 1.03% | 1.03% | 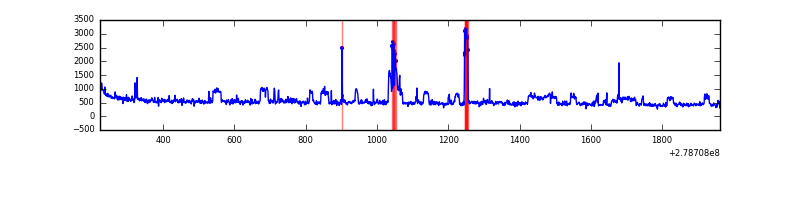 |
| D | 1741 | 1741 | 24 | 24 | 1.38% | 1.38% |  |
Top three noisy pixels from each quadrant. If the there are fewer than three noisy pixels in the level2.evt file, extra rows are filled as -1
| Pixel properties | Quadrant properties | ||||||
|---|---|---|---|---|---|---|---|
| Quadrant | DetID | PixID | Counts | Sigma | Mean | Median | Sigma |
| A | 15 | 174 | 260335 | 6176.52 | 200 | 196 | 42.1 |
| A | 10 | 234 | 22671 | 533.63 | 200 | 196 | 42.1 |
| A | 9 | 143 | 3901 | 87.97 | 200 | 196 | 42.1 |
| B | 15 | 35 | 89542 | 2195.33 | 205 | 200 | 40.7 |
| B | 3 | 209 | 49878 | 1220.7 | 205 | 200 | 40.7 |
| B | 0 | 229 | 41335 | 1010.78 | 205 | 200 | 40.7 |
| C | 3 | 233 | 187281 | 4122.75 | 188 | 189 | 45.4 |
| C | 0 | 207 | 71283 | 1566.62 | 188 | 189 | 45.4 |
| C | 14 | 238 | 30353 | 664.69 | 188 | 189 | 45.4 |
| D | 1 | 52 | 153240 | 3161.44 | 192 | 185 | 48.4 |
| D | 10 | 70 | 118220 | 2438.08 | 192 | 185 | 48.4 |
| D | 5 | 222 | 67787 | 1396.36 | 192 | 185 | 48.4 |
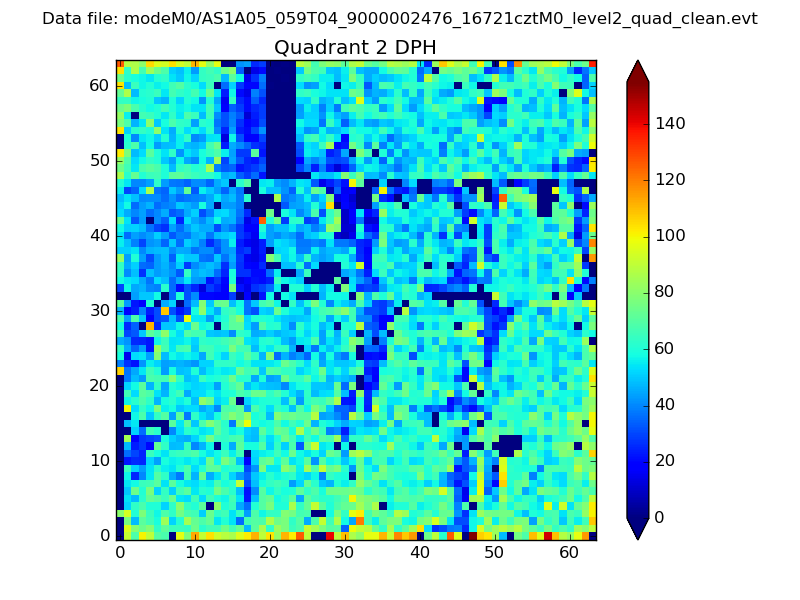
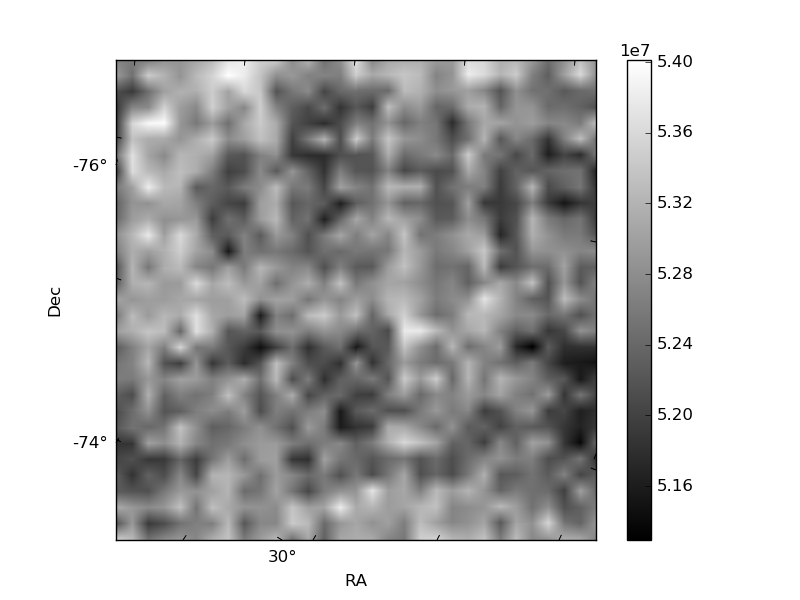
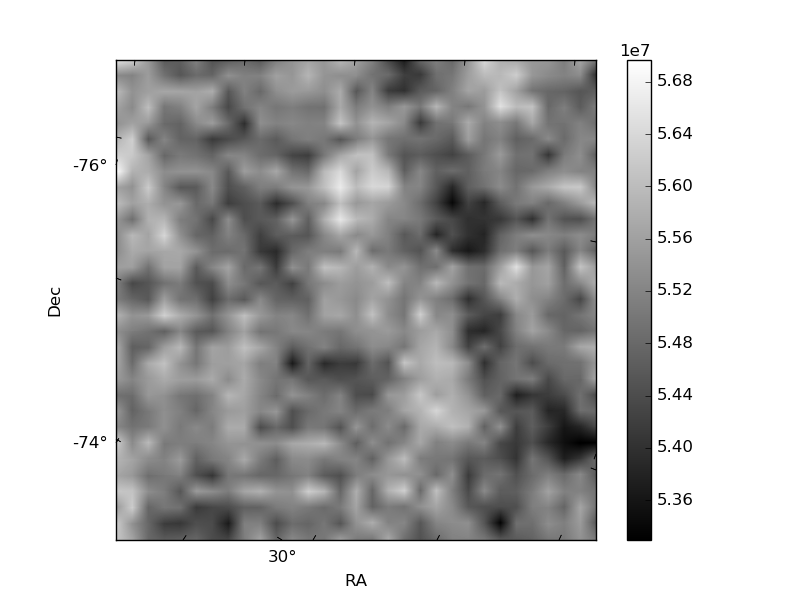
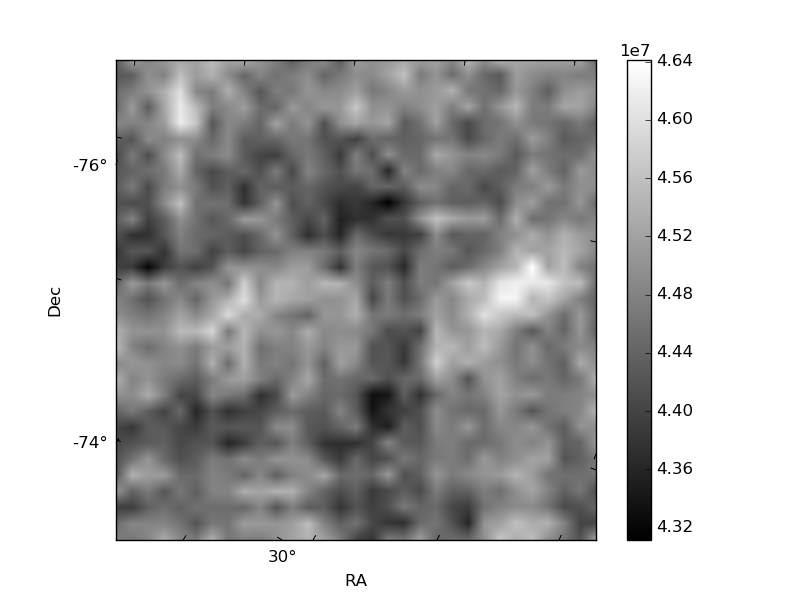
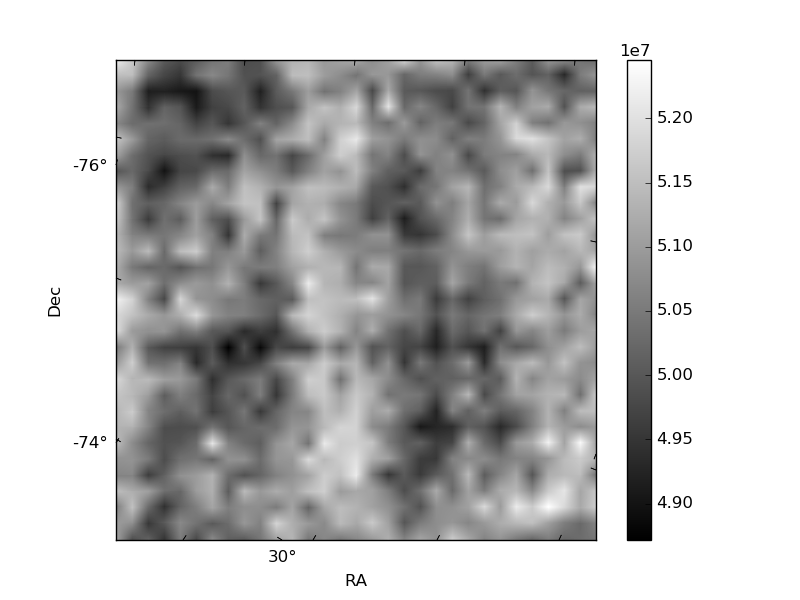
Histogram calculated using DETX and DETY for each event in the final _common_clean file
| Quadrant A | 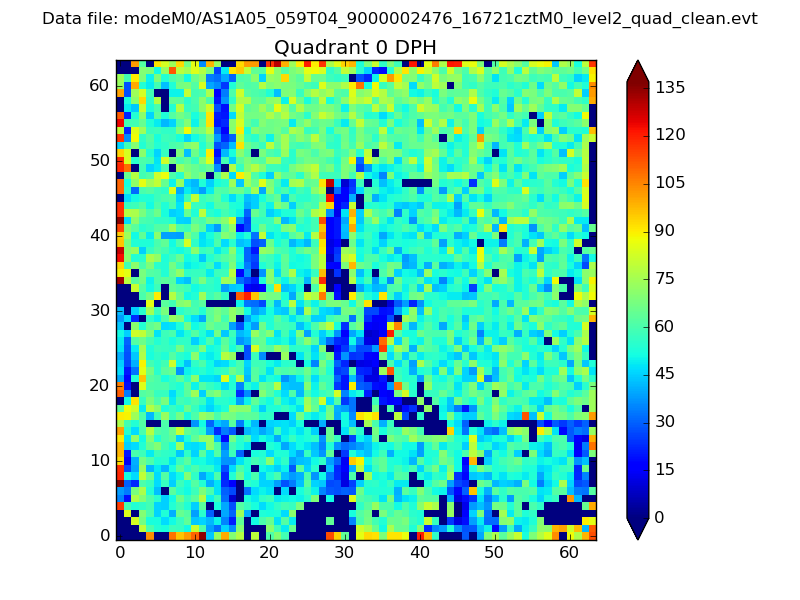 |
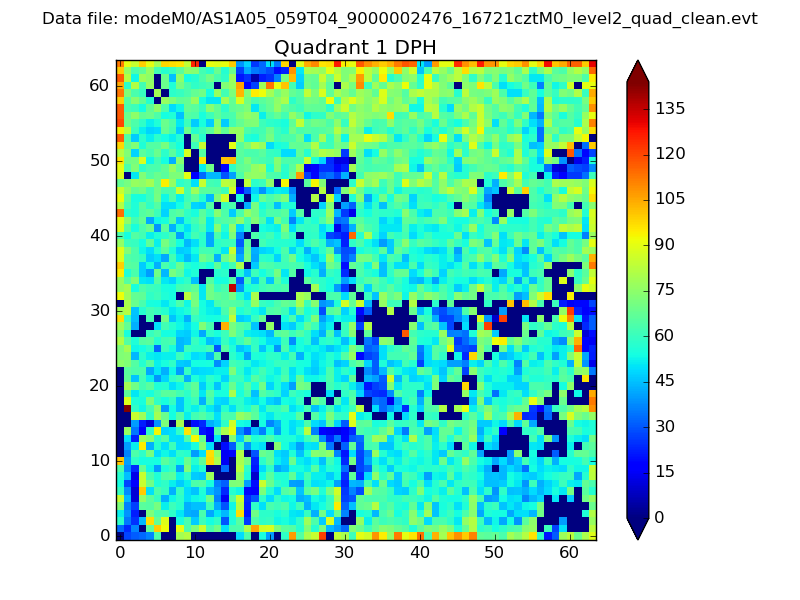 |
Quadrant B |
|---|---|---|---|
| Quadrant D | 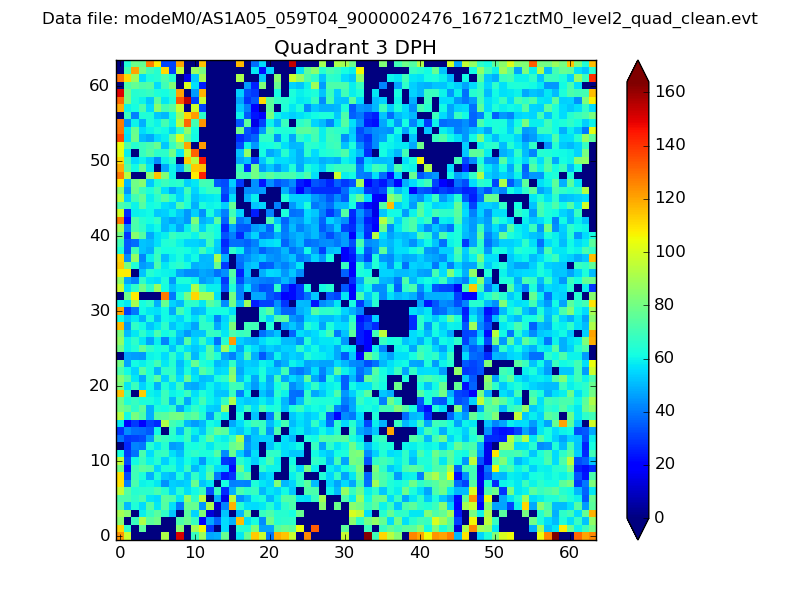 |
 |
Quadrant C |
| Plot type | Count rate plots | Images |
|---|---|---|
| Comparison with Poisson distribution Blue bars denote a histogram of data divided into 1 sec bins. Red curve is a Poisson curve with rate = median count rate of data. |
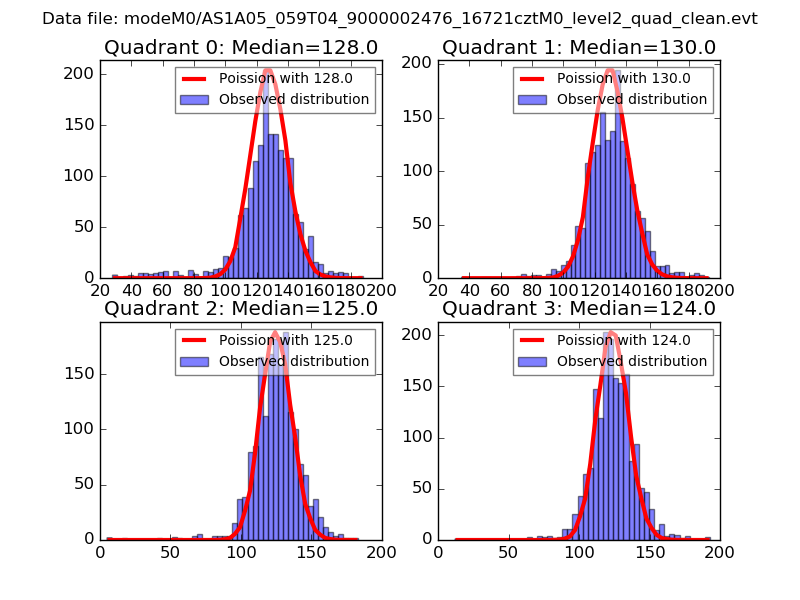 |
 |
| Quadrant-wise count rates Data is divided into 100 sec bins |
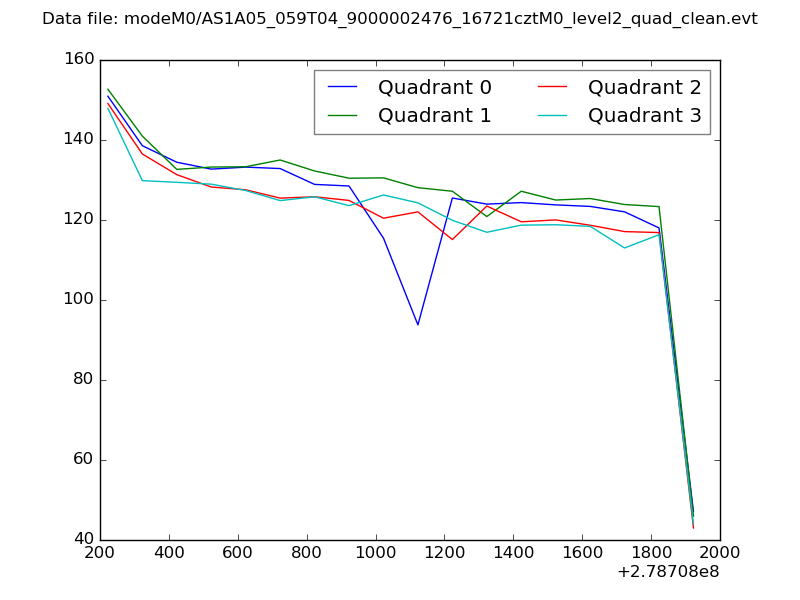 |
|
| Module-wise count rates for Quadrant A Data is divided into 100 sec bins |
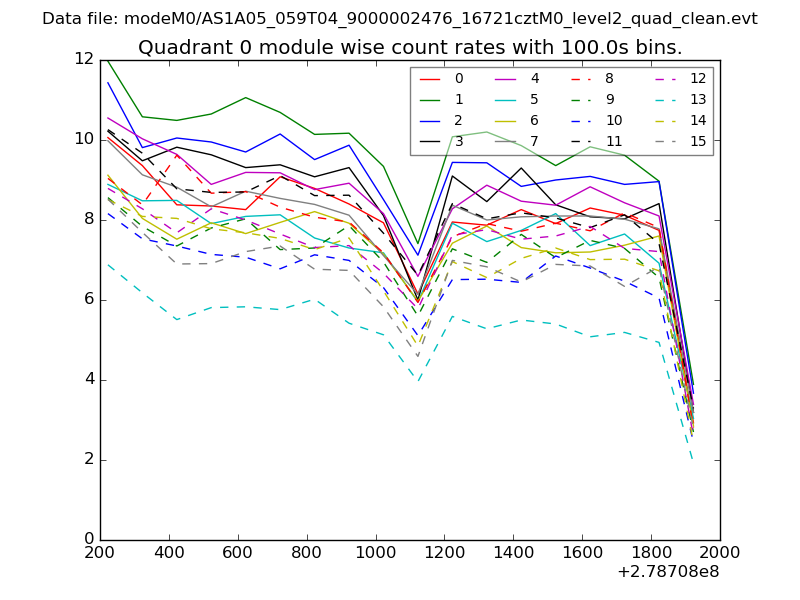 |
 |
| Module-wise count rates for Quadrant B Data is divided into 100 sec bins |
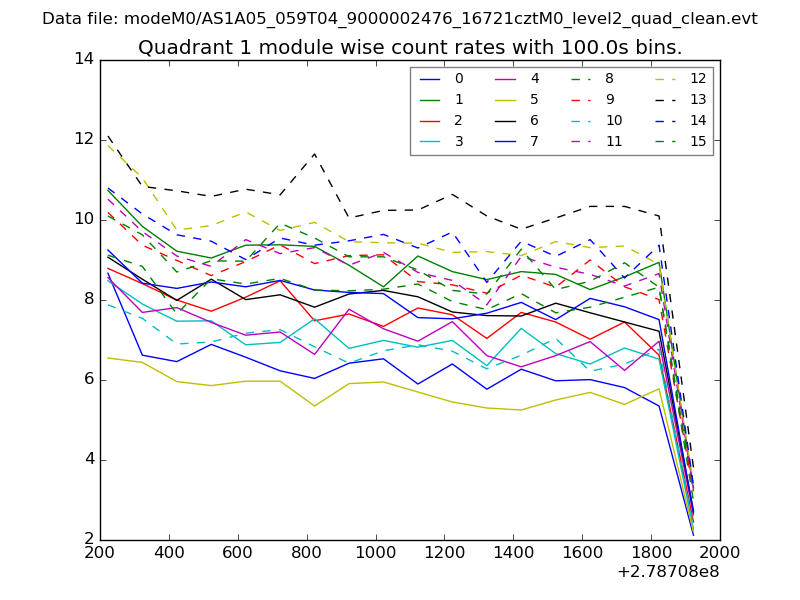 |
 |
| Module-wise count rates for Quadrant C Data is divided into 100 sec bins |
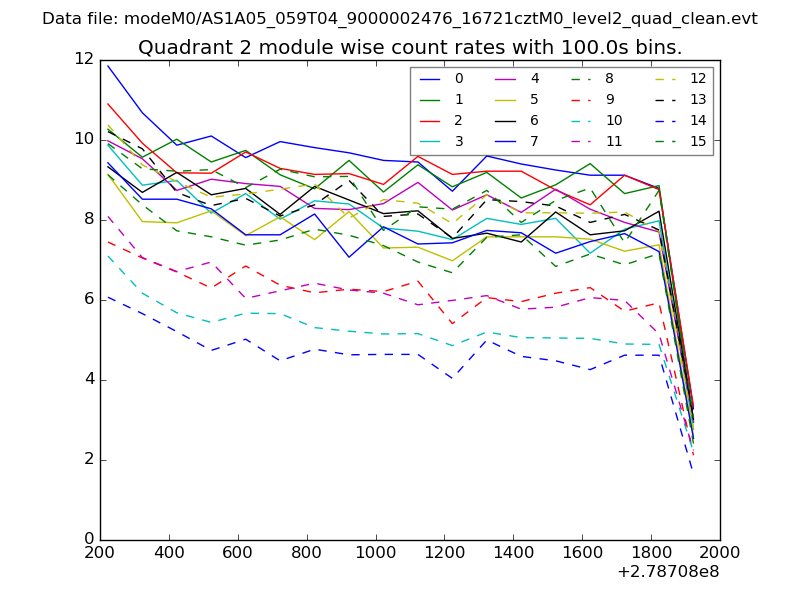 |
 |
| Module-wise count rates for Quadrant D Data is divided into 100 sec bins |
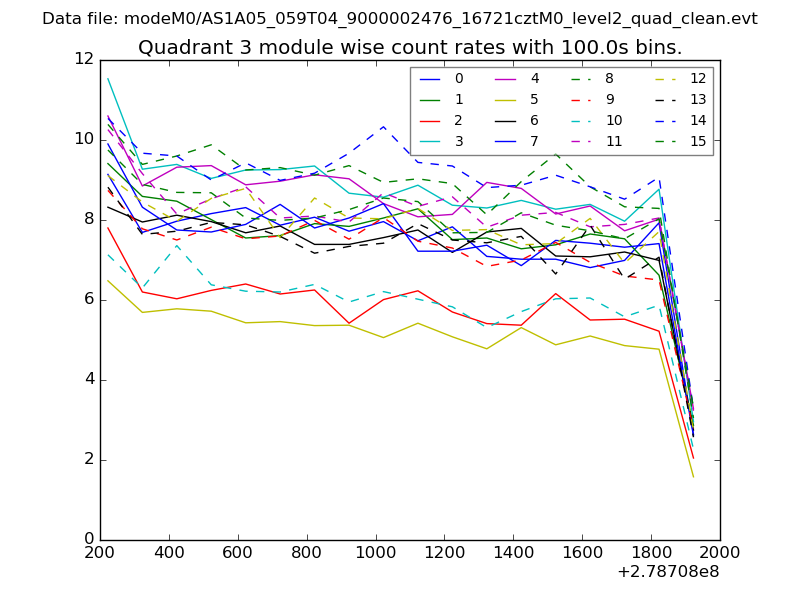 |
 |
| Parameter | Plot |
|---|---|
| CZT HV Monitor | 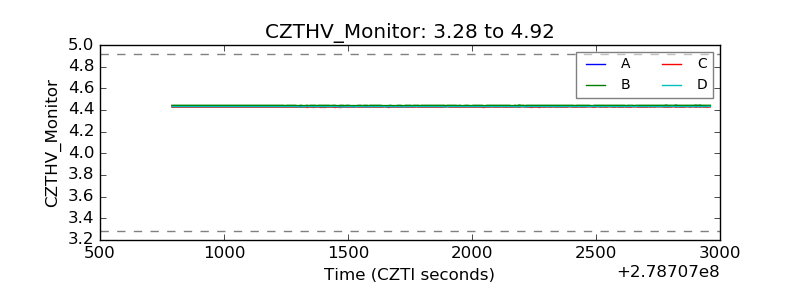 |
| D_VDD |  |
| Temperature 1 | 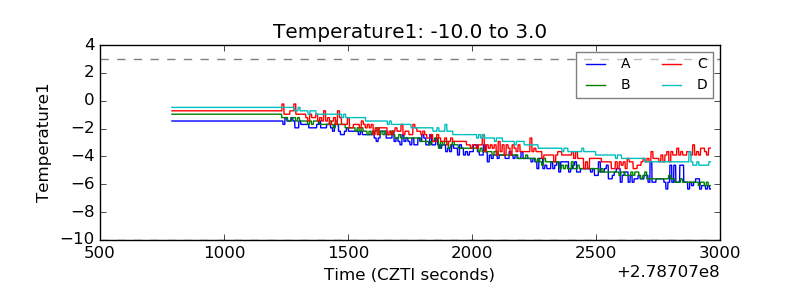 |
| Veto HV Monitor | 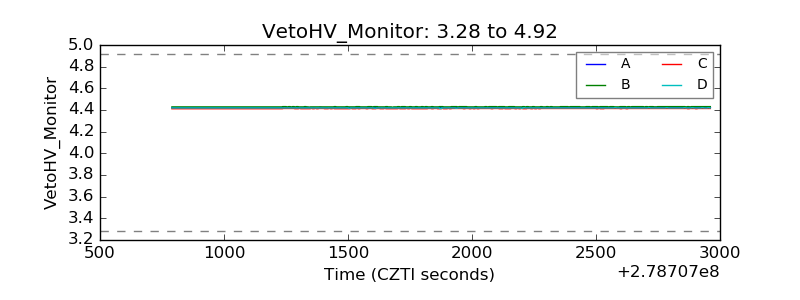 |
| Veto LLD | 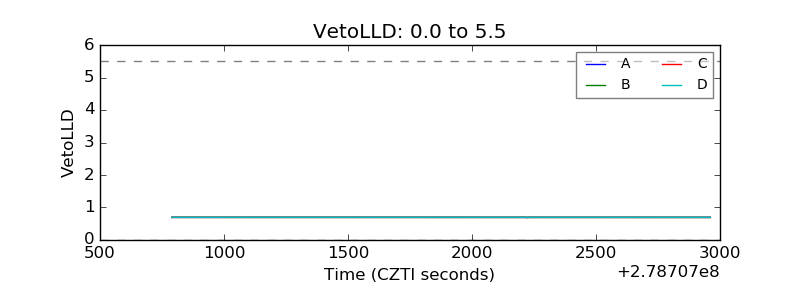 |
| Alpha Counter | 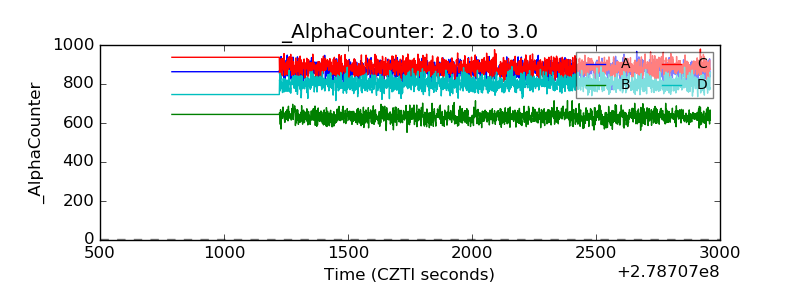 |
| _CPM_Rate | 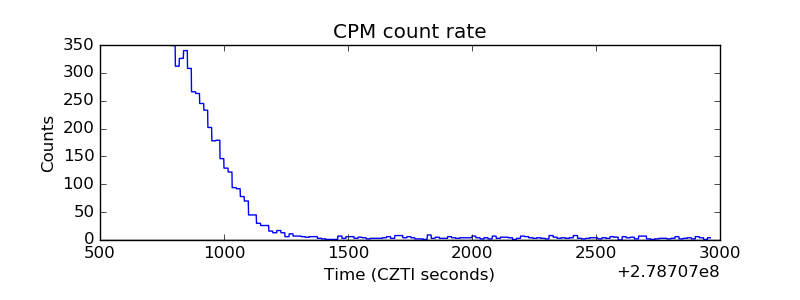 |
| CZT Counter | 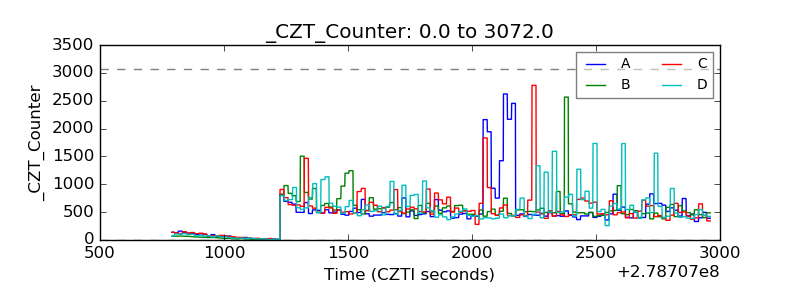 |
| +2.5 Volts monitor |  |
| +5 Volts monitor |  |
| _ROLL_ROT | 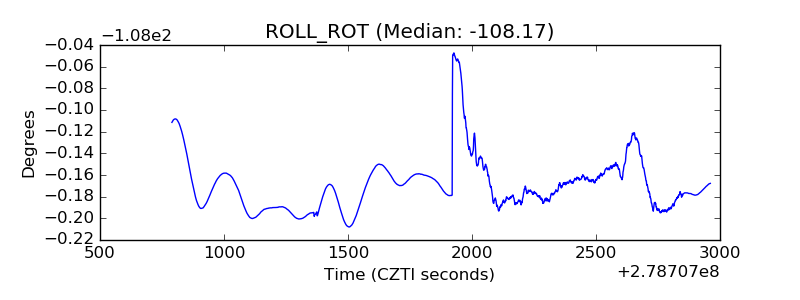 |
| _Roll_DEC | 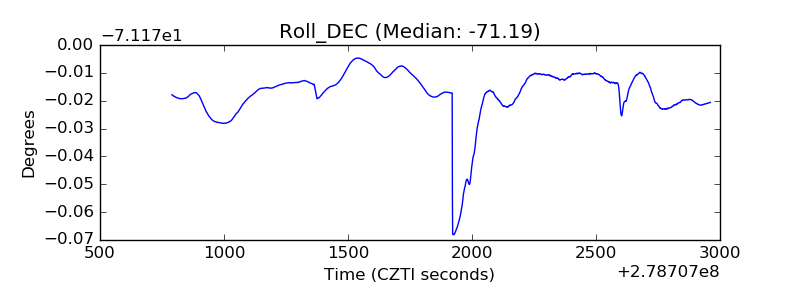 |
| _Roll_RA | 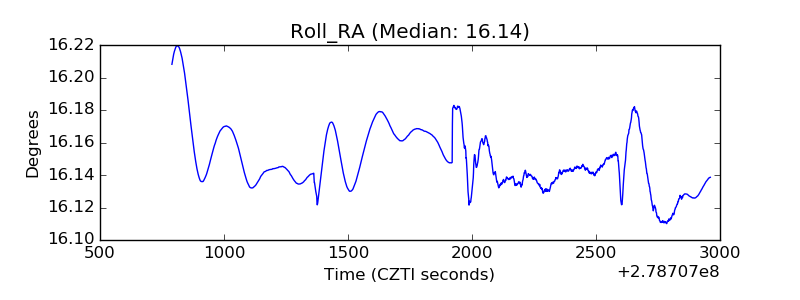 |
| Veto Counter | 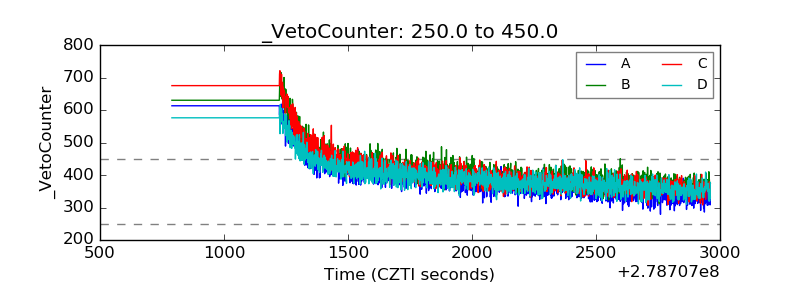 |