| Param | Original file | Final file |
|---|---|---|
| Filename | modeM0/AS1A05_059T05_9000002478cztM0_level2.fits | modeM0/AS1A05_059T05_9000002478cztM0_level2_quad_clean.evt |
| Size (bytes) | 168,065,280 | 261,524,160 |
| Size | 160.3 MB | 249.4 MB |
| Events in quadrant A | 994,906 | 1,691,619 |
| Events in quadrant B | 975,560 | 1,765,064 |
| Events in quadrant C | 989,330 | 1,665,572 |
| Events in quadrant D | 873,034 | 1,541,958 |
| Mode M0 | |||
|---|---|---|---|
| Quadrant | BADHDUFLAG | Total packets | Discarded packets |
| A | 0 | 45178 | 0 |
| B | 0 | 38946 | 0 |
| C | 0 | 41273 | 0 |
| D | 0 | 42129 | 0 |
| Mode SS | |||
|---|---|---|---|
| Quadrant | BADHDUFLAG | Total packets | Discarded packets |
| A | 0 | 374 | 0 |
| B | 0 | 374 | 0 |
| C | 0 | 374 | 0 |
| D | 0 | 374 | 0 |
| Mode M9 | |||
|---|---|---|---|
| Quadrant | BADHDUFLAG | Total packets | Discarded packets |
| A | 0 | 11 | 0 |
| B | 0 | 11 | 0 |
| C | 0 | 11 | 0 |
| D | 0 | 11 | 0 |
| Quadrant | Total seconds | Saturated seconds | Saturation percentage |
|---|---|---|---|
| A | 18226 | 879 | 4.822781% |
| B | 18226 | 167 | 0.916273% |
| C | 18226 | 245 | 1.344234% |
| D | 18226 | 223 | 1.223527% |
Noise dominated data is calculated using 1-second bins in cleaned event files. If a bin has >2000 counts, and if more than 50% of those come from <1% of pixels, then it is considered to be noise-dominated and hence unusable.
| Quadrant | # 1 sec bins | Bins with >0 counts | Bins with >2000 counts | High rate bins dominated by noise | Noise dominated (total time) | Noise dominated (detector-on time) | Marked lightcurve |
|---|---|---|---|---|---|---|---|
| A | 19416 | 18225 | 0 | 0 | 0.00% | 0.00% |  |
| B | 19416 | 18226 | 0 | 0 | 0.00% | 0.00% |  |
| C | 19416 | 18226 | 0 | 0 | 0.00% | 0.00% | 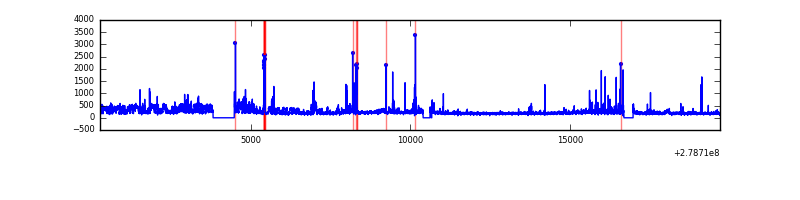 |
| D | 19416 | 18226 | 0 | 0 | 0.00% | 0.00% |  |
Top three noisy pixels from each quadrant. If the there are fewer than three noisy pixels in the level2.evt file, extra rows are filled as -1
| Pixel properties | Quadrant properties | ||||||
|---|---|---|---|---|---|---|---|
| Quadrant | DetID | PixID | Counts | Sigma | Mean | Median | Sigma |
| A | 0 | 29 | 924 | 10.3 | 258 | 243 | 66.1 |
| A | 7 | 110 | 809 | 8.56 | 258 | 243 | 66.1 |
| A | 0 | 30 | 752 | 7.7 | 258 | 243 | 66.1 |
| B | 2 | 9 | 736 | 9.32 | 258 | 247 | 52.5 |
| B | 5 | 128 | 653 | 7.74 | 258 | 247 | 52.5 |
| B | 2 | 8 | 641 | 7.51 | 258 | 247 | 52.5 |
| C | 12 | 241 | 729 | 7.12 | 261 | 244 | 68.1 |
| C | 9 | 242 | 682 | 6.43 | 261 | 244 | 68.1 |
| C | 3 | 126 | 655 | 6.04 | 261 | 244 | 68.1 |
| D | 6 | 231 | 657 | 6.26 | 248 | 226 | 68.8 |
| D | 6 | 38 | 651 | 6.18 | 248 | 226 | 68.8 |
| D | 4 | 246 | 651 | 6.18 | 248 | 226 | 68.8 |
Histogram calculated using DETX and DETY for each event in the final _common_clean file
| Quadrant A |  |
 |
Quadrant B |
|---|---|---|---|
| Quadrant D | 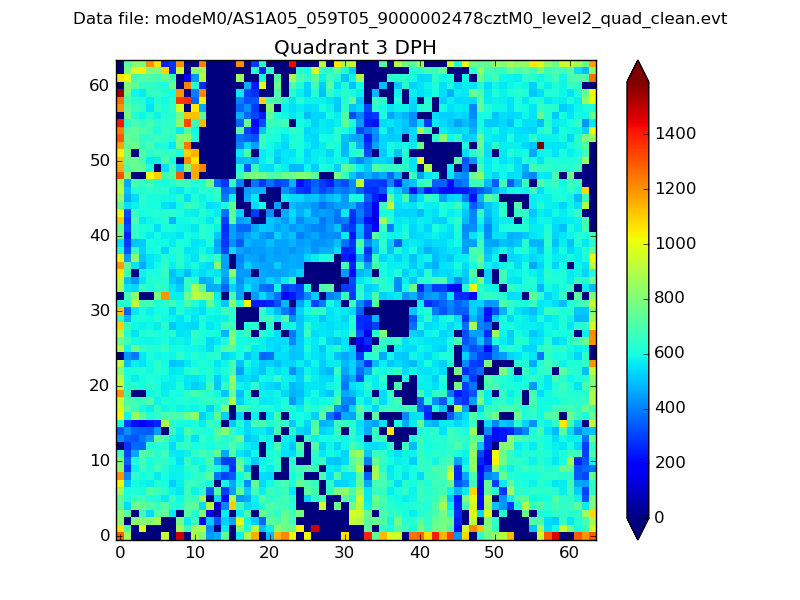 |
 |
Quadrant C |
| Plot type | Count rate plots | Images |
|---|---|---|
| Comparison with Poisson distribution Blue bars denote a histogram of data divided into 1 sec bins. Red curve is a Poisson curve with rate = median count rate of data. |
 |
 |
| Quadrant-wise count rates Data is divided into 100 sec bins |
 |
|
| Module-wise count rates for Quadrant A Data is divided into 100 sec bins |
 |
 |
| Module-wise count rates for Quadrant B Data is divided into 100 sec bins |
 |
 |
| Module-wise count rates for Quadrant C Data is divided into 100 sec bins |
 |
 |
| Module-wise count rates for Quadrant D Data is divided into 100 sec bins |
 |
 |
| Parameter | Plot |
|---|---|
| CZT HV Monitor |  |
| D_VDD |  |
| Temperature 1 |  |
| Veto HV Monitor |  |
| Veto LLD | 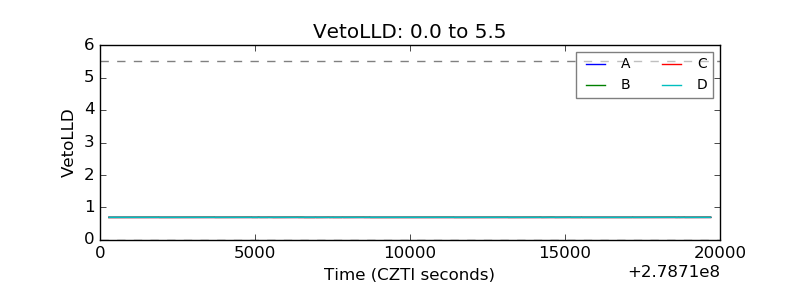 |
| Alpha Counter |  |
| _CPM_Rate |  |
| CZT Counter |  |
| +2.5 Volts monitor |  |
| +5 Volts monitor |  |
| _ROLL_ROT |  |
| _Roll_DEC |  |
| _Roll_RA |  |
| Veto Counter |  |