| Param | Original file | Final file |
|---|---|---|
| Filename | modeM0/AS1A05_059T05_9000002478_16722cztM0_level2.evt | modeM0/AS1A05_059T05_9000002478_16722cztM0_level2_quad_clean.evt |
| Size (bytes) | 569,056,320 | 144,411,840 |
| Size | 542.7 MB | 137.7 MB |
| Events in quadrant A | 4,171,982 | 969,347 |
| Events in quadrant B | 4,045,568 | 985,643 |
| Events in quadrant C | 4,220,472 | 944,308 |
| Events in quadrant D | 4,262,670 | 928,119 |
| Mode M0 | |||
|---|---|---|---|
| Quadrant | BADHDUFLAG | Total packets | Discarded packets |
| A | 0 | 17917 | 3 |
| B | 0 | 17196 | 2 |
| C | 0 | 17905 | 2 |
| D | 0 | 18252 | 2 |
| Mode SS | |||
|---|---|---|---|
| Quadrant | BADHDUFLAG | Total packets | Discarded packets |
| A | 0 | 164 | 0 |
| B | 0 | 164 | 0 |
| C | 0 | 164 | 0 |
| D | 0 | 164 | 0 |
| Mode M9 | |||
|---|---|---|---|
| Quadrant | BADHDUFLAG | Total packets | Discarded packets |
| A | 0 | 8 | 0 |
| B | 0 | 8 | 0 |
| C | 0 | 8 | 0 |
| D | 0 | 8 | 0 |
| Quadrant | Total seconds | Saturated seconds | Saturation percentage |
|---|---|---|---|
| A | 7850 | 206 | 2.624204% |
| B | 7850 | 105 | 1.337580% |
| C | 7850 | 128 | 1.630573% |
| D | 7850 | 115 | 1.464968% |
Noise dominated data is calculated using 1-second bins in cleaned event files. If a bin has >2000 counts, and if more than 50% of those come from <1% of pixels, then it is considered to be noise-dominated and hence unusable.
| Quadrant | # 1 sec bins | Bins with >0 counts | Bins with >2000 counts | High rate bins dominated by noise | Noise dominated (total time) | Noise dominated (detector-on time) | Marked lightcurve |
|---|---|---|---|---|---|---|---|
| A | 8751 | 7854 | 93 | 93 | 1.06% | 1.18% | 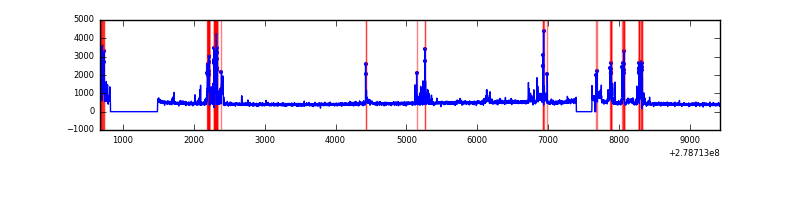 |
| B | 8751 | 7854 | 19 | 19 | 0.22% | 0.24% | 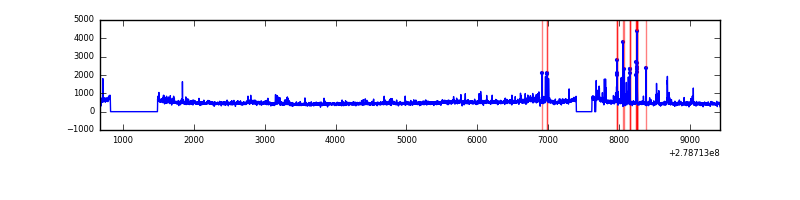 |
| C | 8751 | 7854 | 30 | 30 | 0.34% | 0.38% | 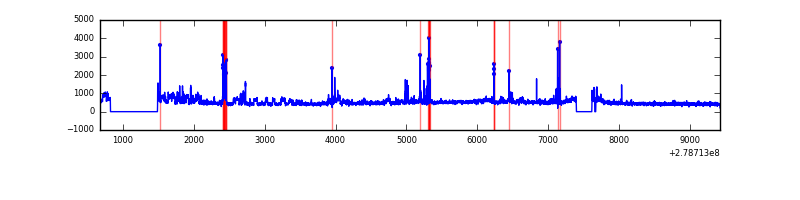 |
| D | 8751 | 7854 | 51 | 51 | 0.58% | 0.65% | 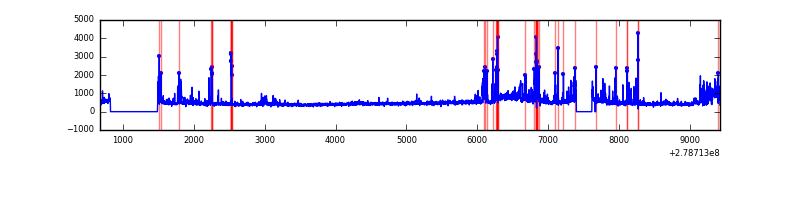 |
Top three noisy pixels from each quadrant. If the there are fewer than three noisy pixels in the level2.evt file, extra rows are filled as -1
| Pixel properties | Quadrant properties | ||||||
|---|---|---|---|---|---|---|---|
| Quadrant | DetID | PixID | Counts | Sigma | Mean | Median | Sigma |
| A | 15 | 174 | 593375 | 3277.08 | 903 | 884 | 180.8 |
| A | 9 | 143 | 74351 | 406.35 | 903 | 884 | 180.8 |
| A | 10 | 234 | 17730 | 93.18 | 903 | 884 | 180.8 |
| B | 15 | 35 | 191664 | 1094.64 | 916 | 891 | 174.3 |
| B | 0 | 229 | 78036 | 442.65 | 916 | 891 | 174.3 |
| B | 3 | 209 | 42687 | 239.82 | 916 | 891 | 174.3 |
| C | 3 | 233 | 451968 | 2232.54 | 871 | 878 | 202.1 |
| C | 0 | 207 | 217263 | 1070.94 | 871 | 878 | 202.1 |
| C | 14 | 238 | 134756 | 662.59 | 871 | 878 | 202.1 |
| D | 1 | 52 | 381752 | 1788.19 | 878 | 852 | 213.0 |
| D | 10 | 70 | 176947 | 826.7 | 878 | 852 | 213.0 |
| D | 2 | 16 | 163430 | 763.24 | 878 | 852 | 213.0 |
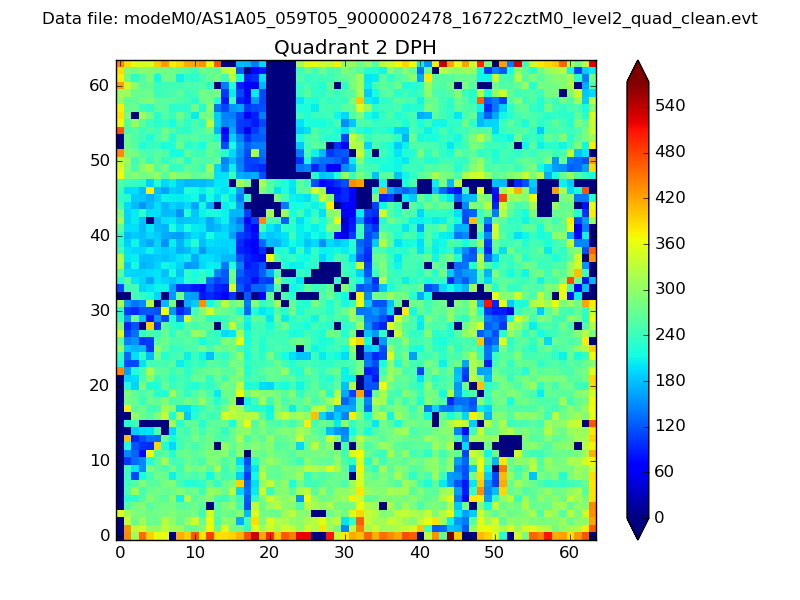
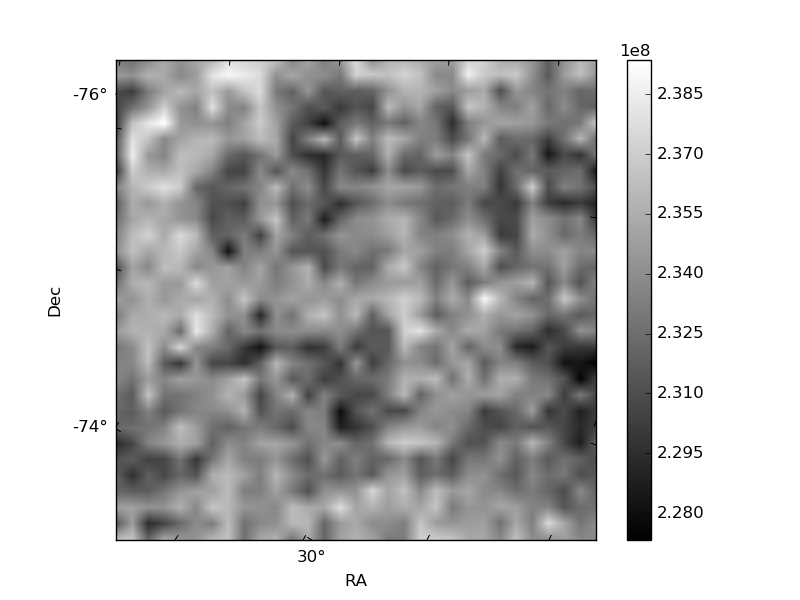
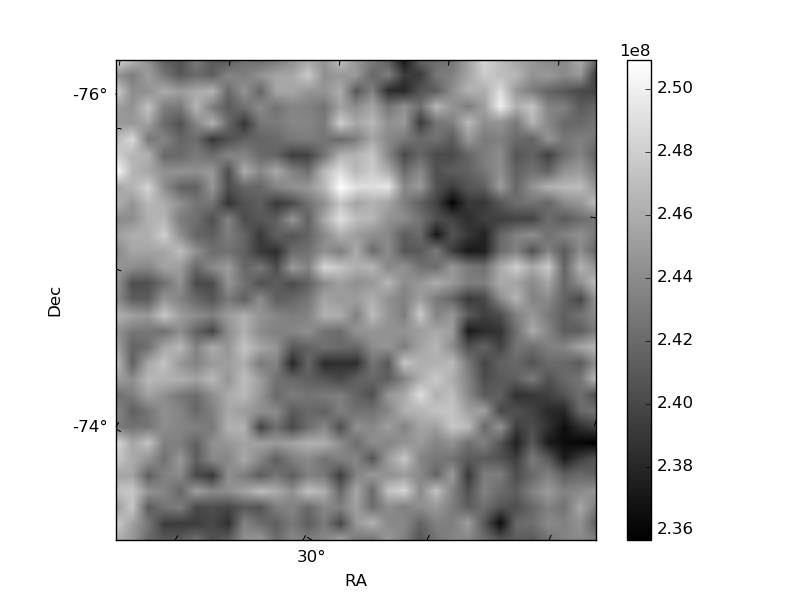
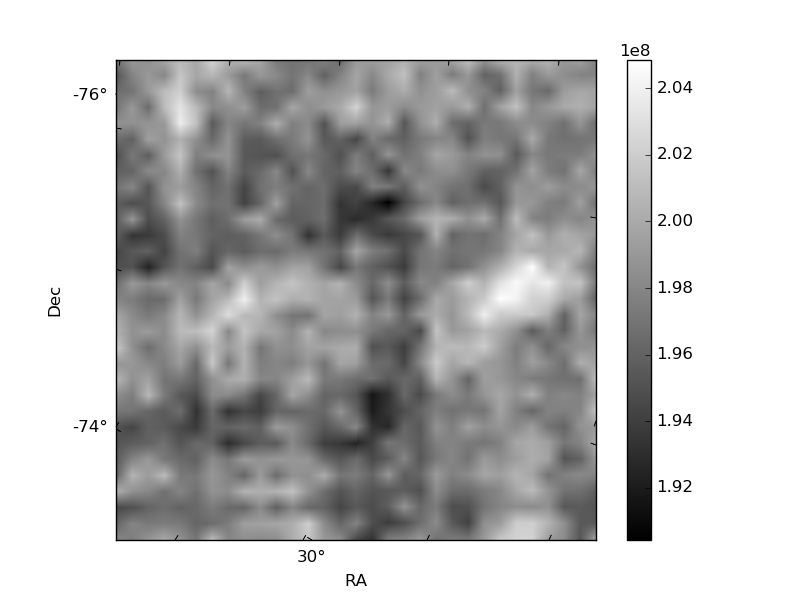
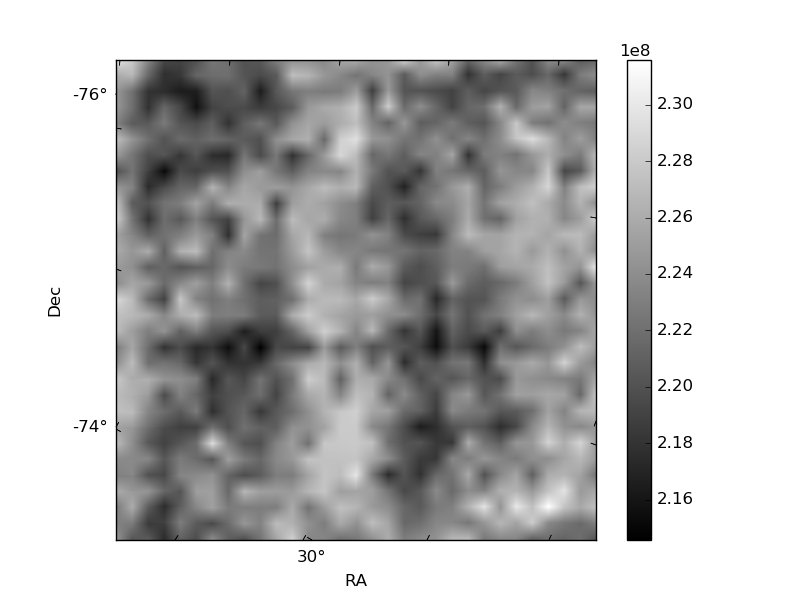
Histogram calculated using DETX and DETY for each event in the final _common_clean file
| Quadrant A | 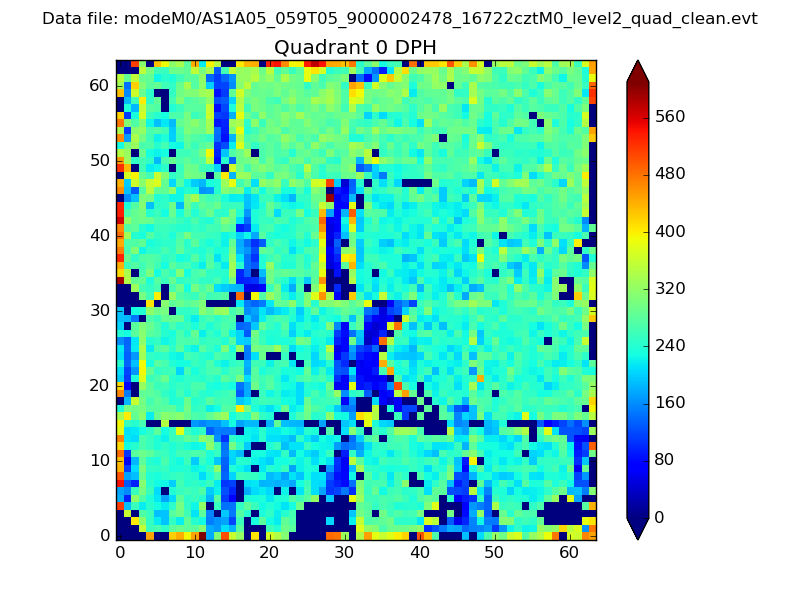 |
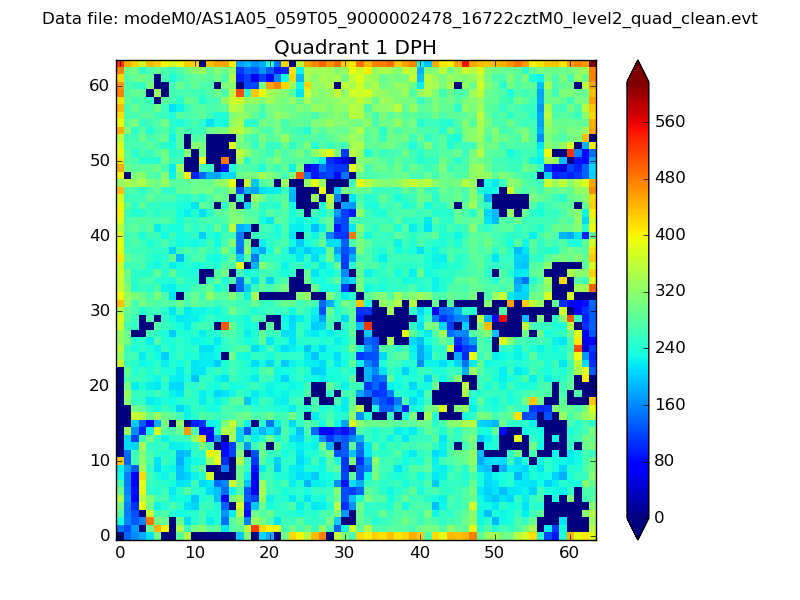 |
Quadrant B |
|---|---|---|---|
| Quadrant D | 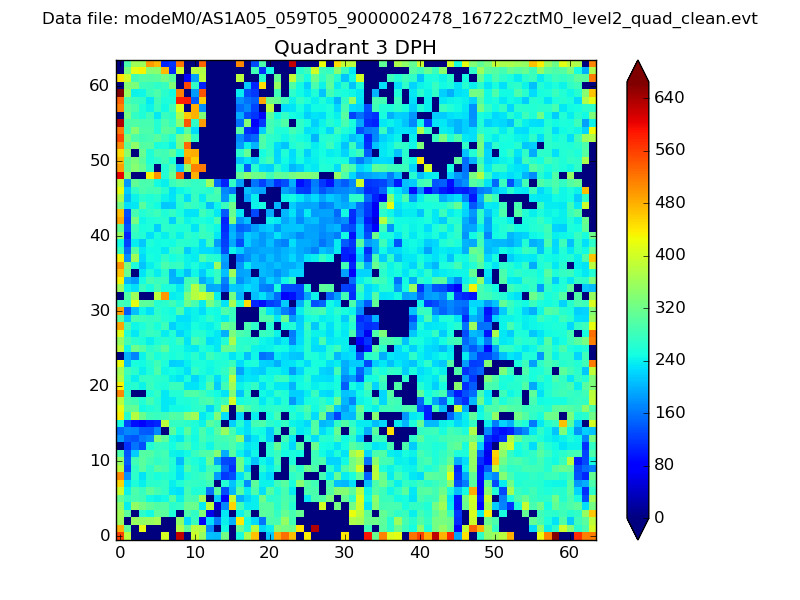 |
 |
Quadrant C |
| Plot type | Count rate plots | Images |
|---|---|---|
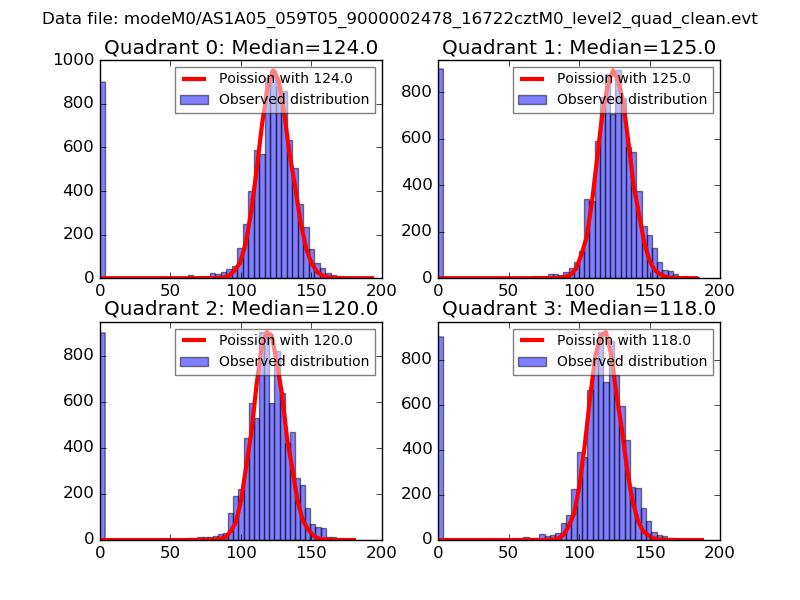
| Comparison with Poisson distribution Blue bars denote a histogram of data divided into 1 sec bins. Red curve is a Poisson curve with rate = median count rate of data. |
 |
 |
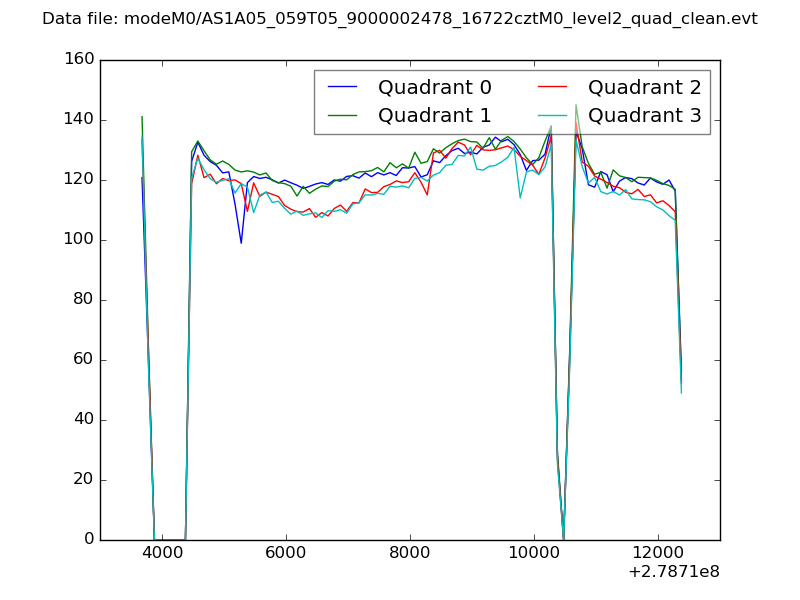
| Quadrant-wise count rates Data is divided into 100 sec bins |
 |
|
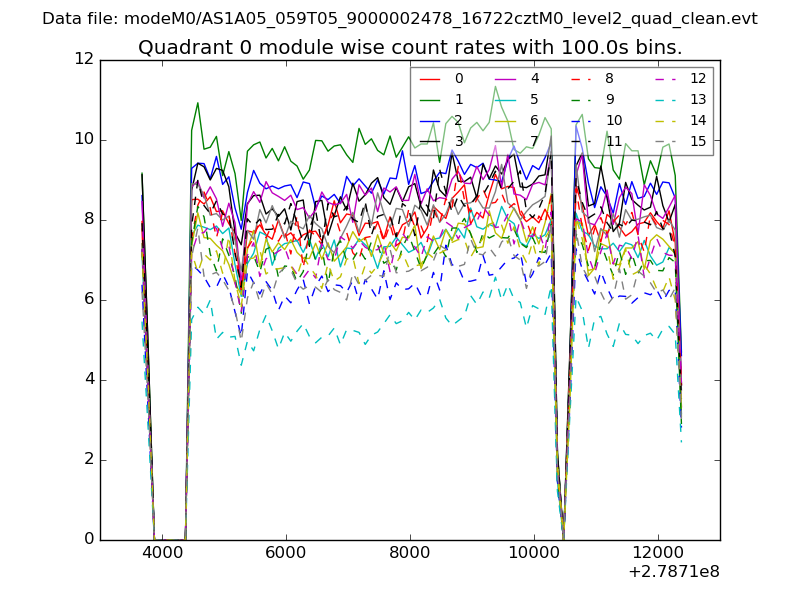
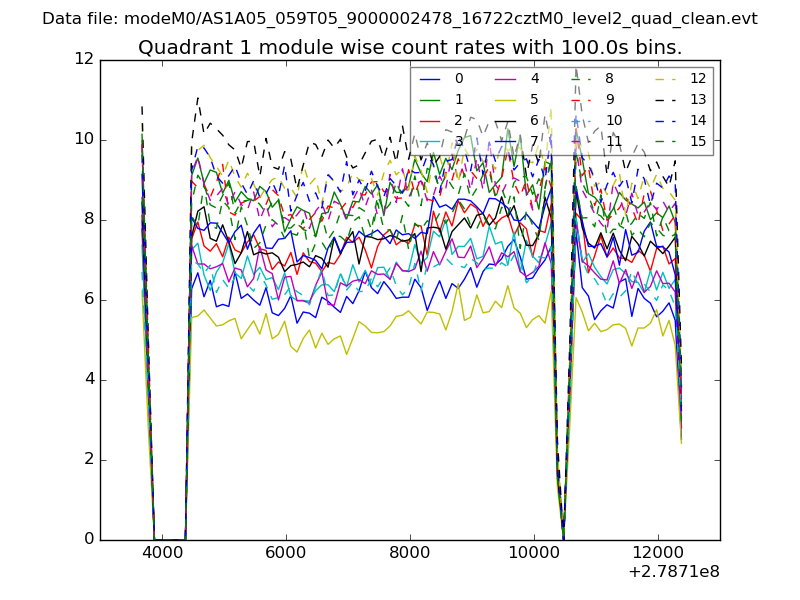
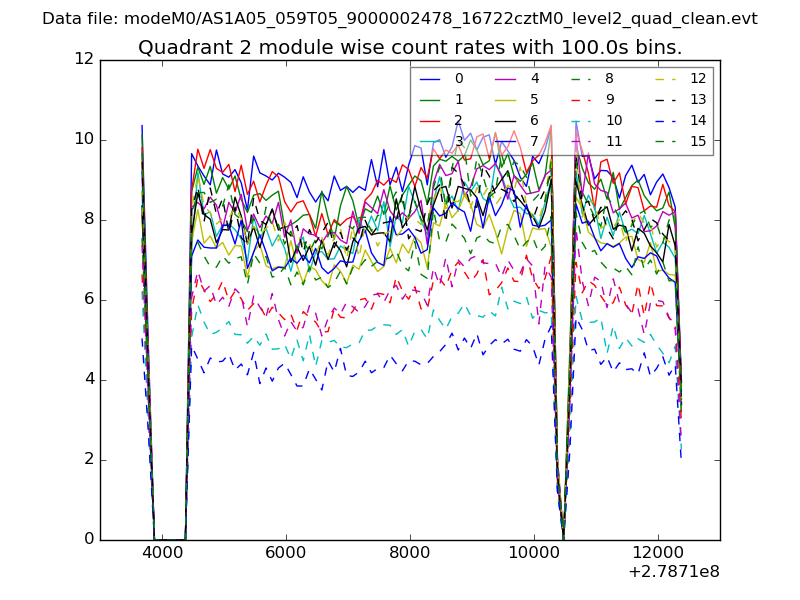
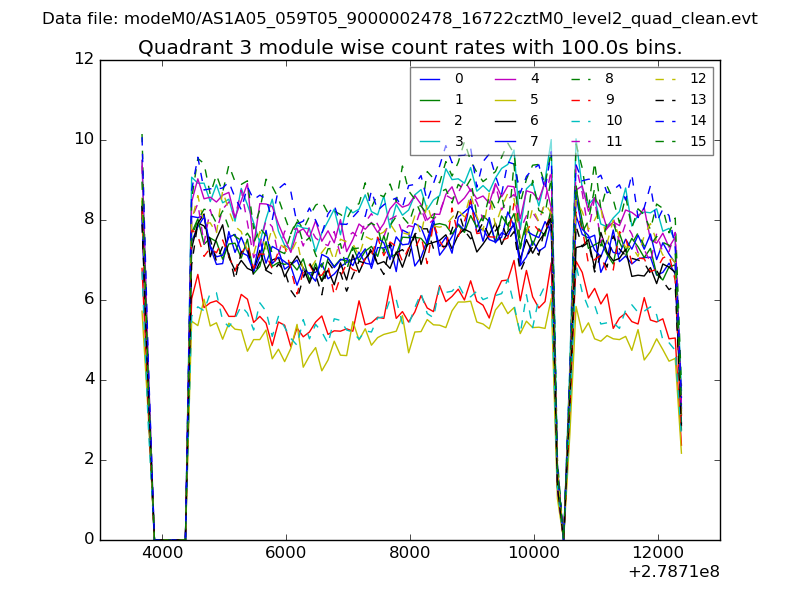
| Module-wise count rates for Quadrant A Data is divided into 100 sec bins |
 |
 |
| Module-wise count rates for Quadrant B Data is divided into 100 sec bins |
 |
 |
| Module-wise count rates for Quadrant C Data is divided into 100 sec bins |
 |
 |
| Module-wise count rates for Quadrant D Data is divided into 100 sec bins |
 |
 |
| Parameter | Plot |
|---|---|
| CZT HV Monitor | 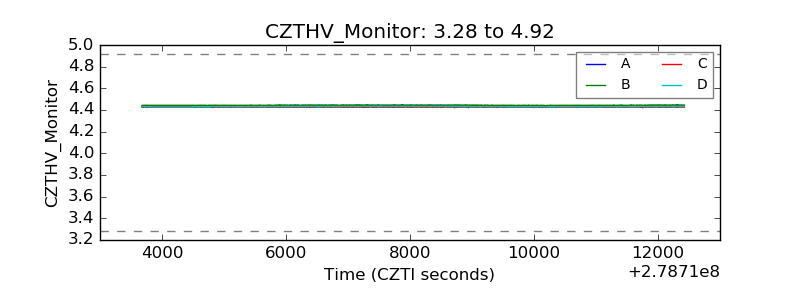 |
| D_VDD | 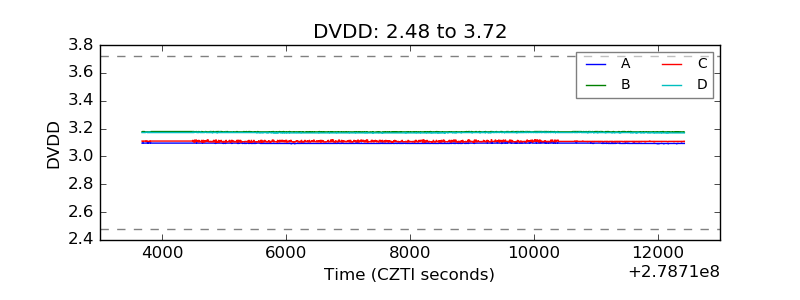 |
| Temperature 1 | 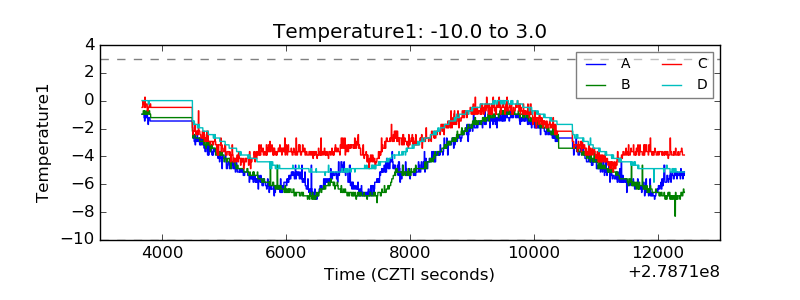 |
| Veto HV Monitor | 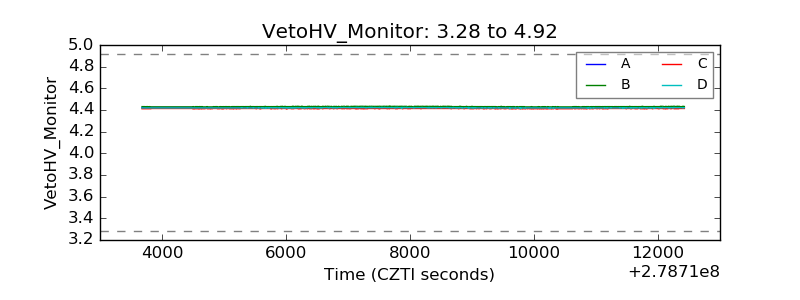 |
| Veto LLD | 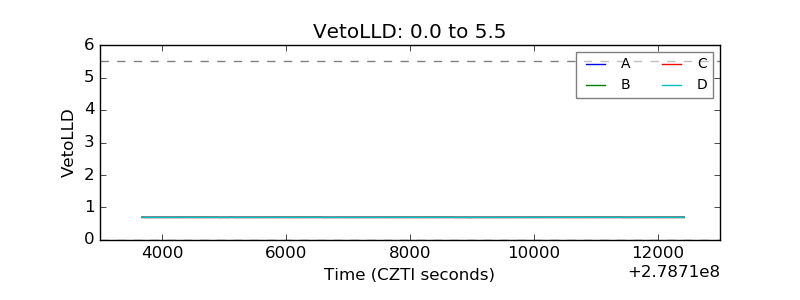 |
| Alpha Counter | 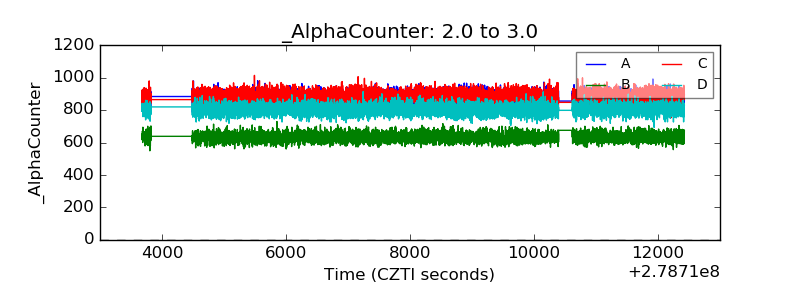 |
| _CPM_Rate | 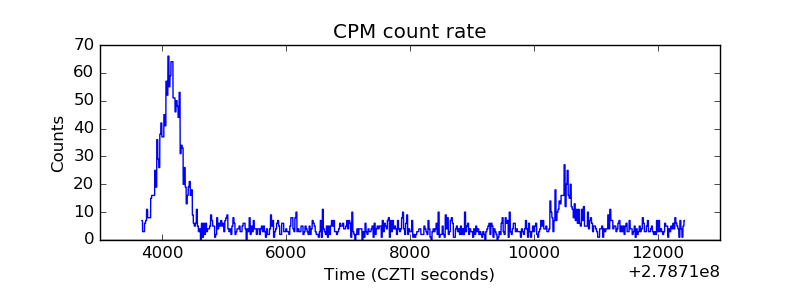 |
| CZT Counter | 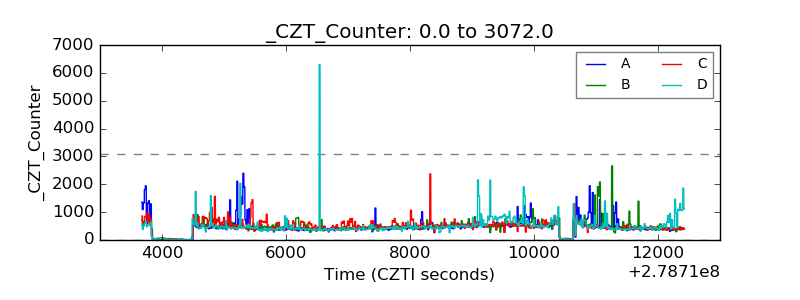 |
| +2.5 Volts monitor |  |
| +5 Volts monitor |  |
| _ROLL_ROT | 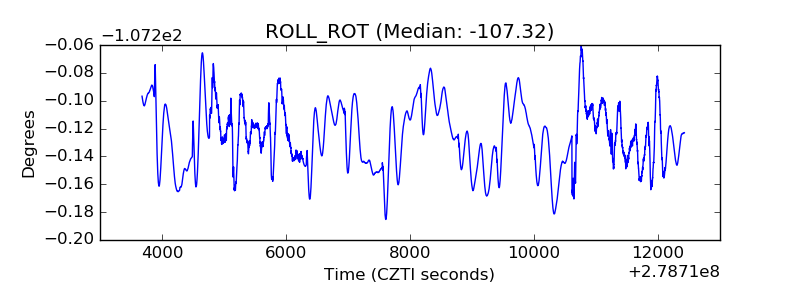 |
| _Roll_DEC | 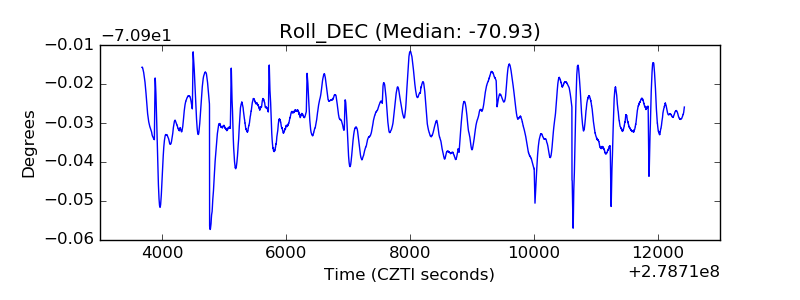 |
| _Roll_RA | 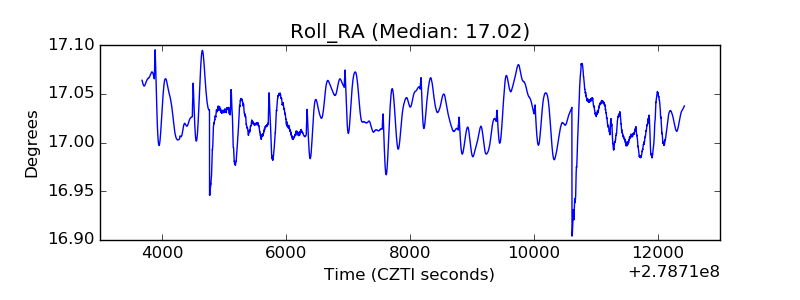 |
| Veto Counter | 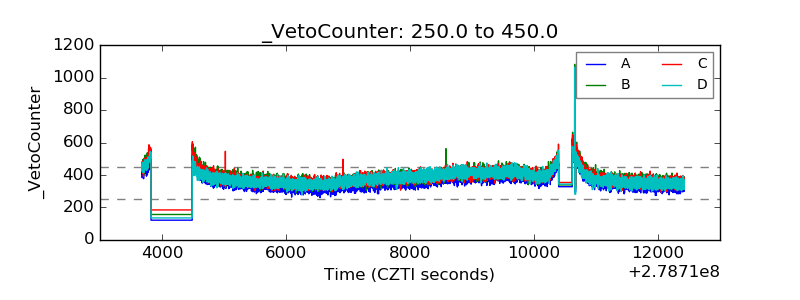 |