| Param | Original file | Final file |
|---|---|---|
| Filename | modeM0/AS1A05_059T05_9000002478_16723cztM0_level2.evt | modeM0/AS1A05_059T05_9000002478_16723cztM0_level2_quad_clean.evt |
| Size (bytes) | 648,342,720 | 151,064,640 |
| Size | 618.3 MB | 144.1 MB |
| Events in quadrant A | 5,798,668 | 987,890 |
| Events in quadrant B | 4,293,140 | 1,039,185 |
| Events in quadrant C | 4,003,399 | 996,056 |
| Events in quadrant D | 4,975,365 | 973,454 |
| Mode M0 | |||
|---|---|---|---|
| Quadrant | BADHDUFLAG | Total packets | Discarded packets |
| A | 0 | 23171 | 3 |
| B | 0 | 18217 | 2 |
| C | 0 | 17438 | 2 |
| D | 0 | 20509 | 2 |
| Mode SS | |||
|---|---|---|---|
| Quadrant | BADHDUFLAG | Total packets | Discarded packets |
| A | 0 | 172 | 0 |
| B | 0 | 172 | 0 |
| C | 0 | 172 | 0 |
| D | 0 | 172 | 0 |
| Mode M9 | |||
|---|---|---|---|
| Quadrant | BADHDUFLAG | Total packets | Discarded packets |
| A | 0 | 5 | 0 |
| B | 0 | 5 | 0 |
| C | 0 | 5 | 0 |
| D | 0 | 5 | 0 |
| Quadrant | Total seconds | Saturated seconds | Saturation percentage |
|---|---|---|---|
| A | 8322 | 704 | 8.459505% |
| B | 8322 | 138 | 1.658255% |
| C | 8322 | 140 | 1.682288% |
| D | 8322 | 169 | 2.030762% |
Noise dominated data is calculated using 1-second bins in cleaned event files. If a bin has >2000 counts, and if more than 50% of those come from <1% of pixels, then it is considered to be noise-dominated and hence unusable.
| Quadrant | # 1 sec bins | Bins with >0 counts | Bins with >2000 counts | High rate bins dominated by noise | Noise dominated (total time) | Noise dominated (detector-on time) | Marked lightcurve |
|---|---|---|---|---|---|---|---|
| A | 8848 | 8326 | 456 | 456 | 5.15% | 5.48% | 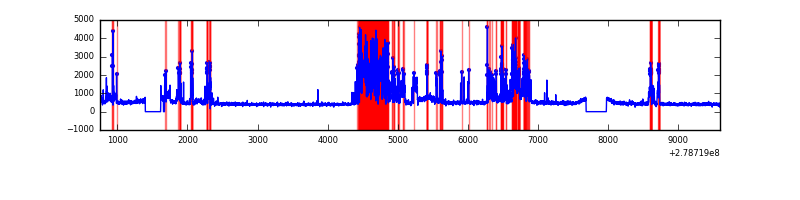 |
| B | 8848 | 8326 | 21 | 21 | 0.24% | 0.25% | 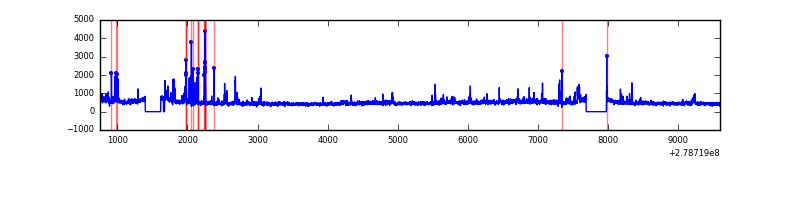 |
| C | 8848 | 8326 | 9 | 9 | 0.10% | 0.11% | 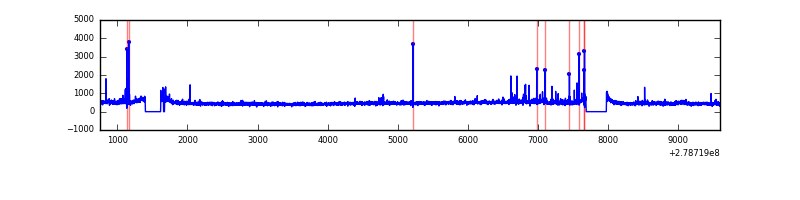 |
| D | 8848 | 8326 | 85 | 85 | 0.96% | 1.02% | 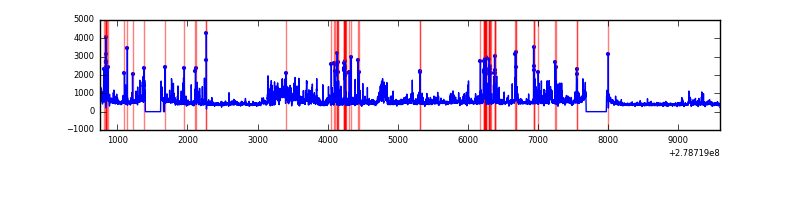 |
Top three noisy pixels from each quadrant. If the there are fewer than three noisy pixels in the level2.evt file, extra rows are filled as -1
| Pixel properties | Quadrant properties | ||||||
|---|---|---|---|---|---|---|---|
| Quadrant | DetID | PixID | Counts | Sigma | Mean | Median | Sigma |
| A | 15 | 174 | 2145134 | 11221.02 | 943 | 921 | 191.1 |
| A | 10 | 234 | 17963 | 89.18 | 943 | 921 | 191.1 |
| A | 3 | 1 | 11229 | 53.94 | 943 | 921 | 191.1 |
| B | 15 | 35 | 199866 | 1072.35 | 977 | 950 | 185.5 |
| B | 4 | 216 | 43863 | 231.34 | 977 | 950 | 185.5 |
| B | 5 | 236 | 39707 | 208.94 | 977 | 950 | 185.5 |
| C | 14 | 238 | 144511 | 660.46 | 933 | 936 | 217.4 |
| C | 0 | 207 | 118066 | 538.81 | 933 | 936 | 217.4 |
| C | 3 | 233 | 86733 | 394.68 | 933 | 936 | 217.4 |
| D | 2 | 16 | 664885 | 2903.88 | 939 | 910 | 228.7 |
| D | 11 | 176 | 192111 | 836.21 | 939 | 910 | 228.7 |
| D | 1 | 52 | 158870 | 690.83 | 939 | 910 | 228.7 |
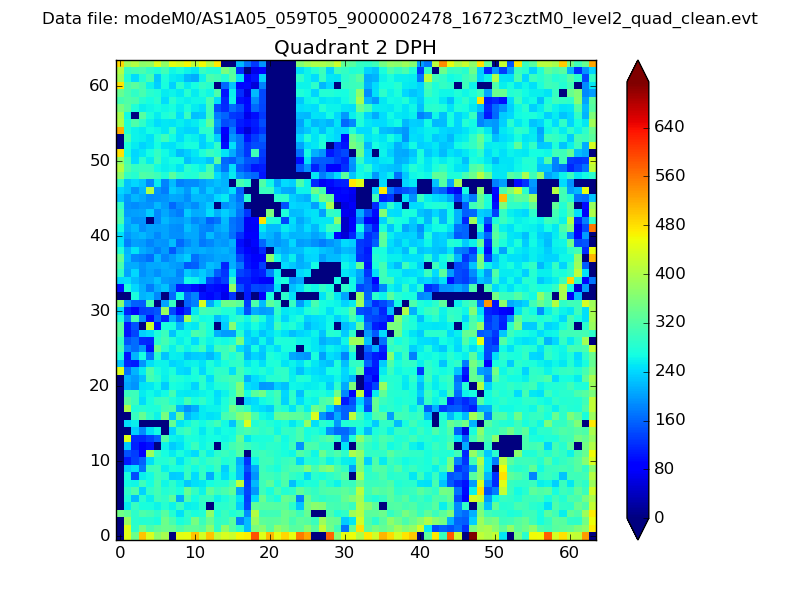
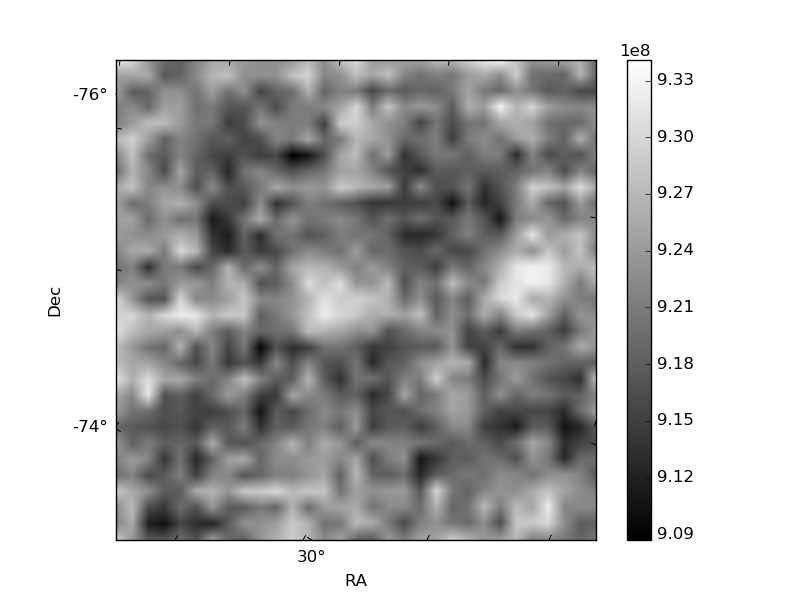
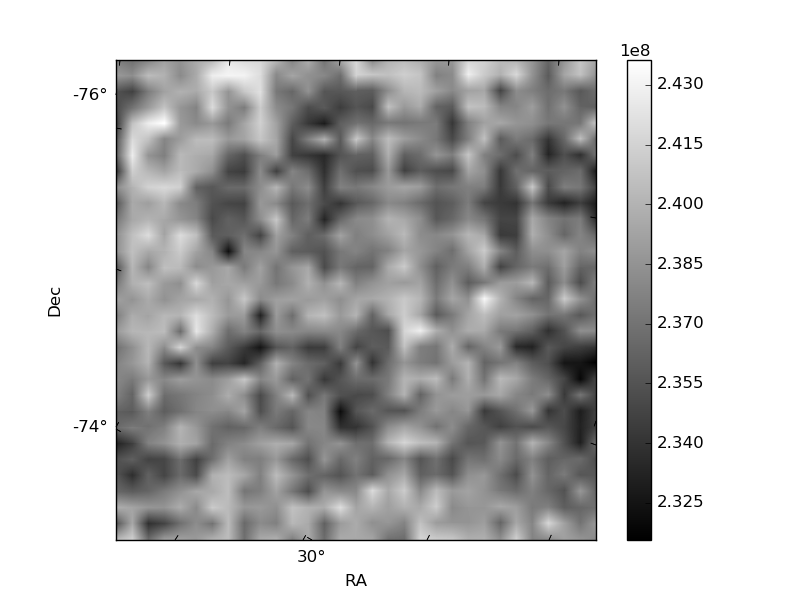
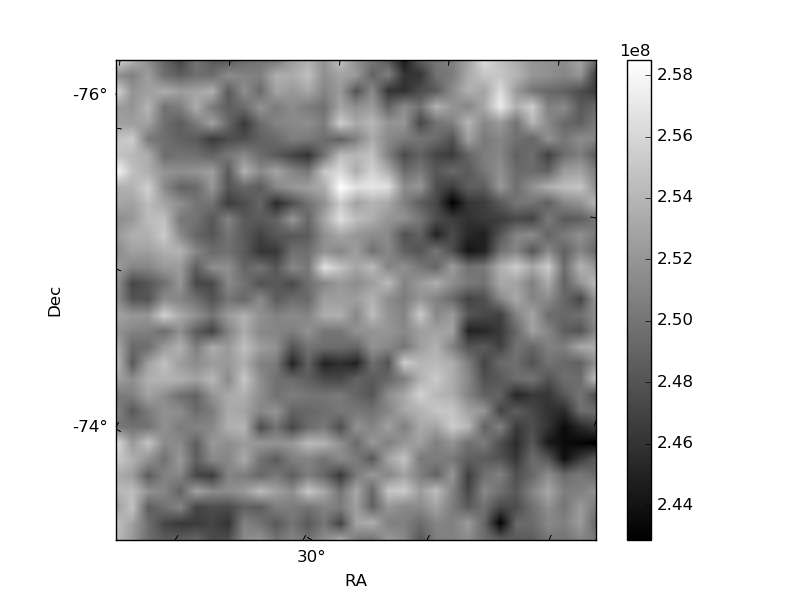
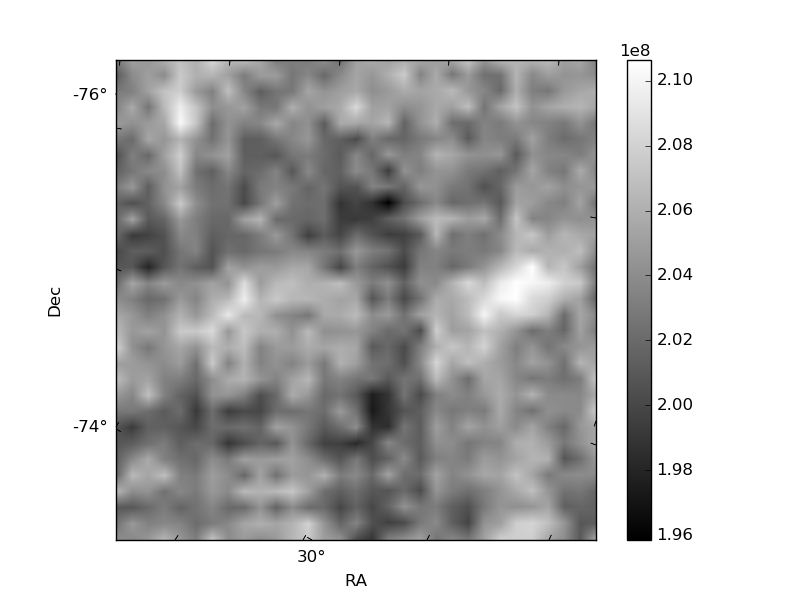
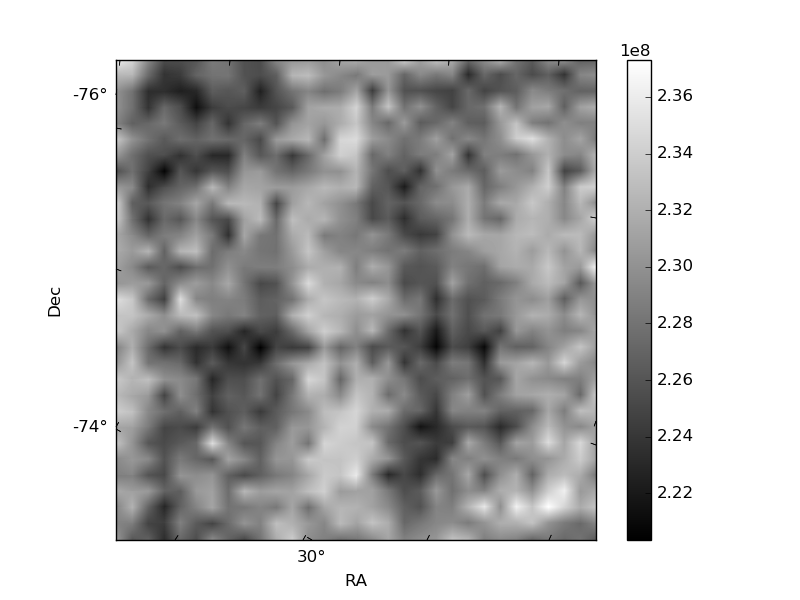
Histogram calculated using DETX and DETY for each event in the final _common_clean file
| Quadrant A | 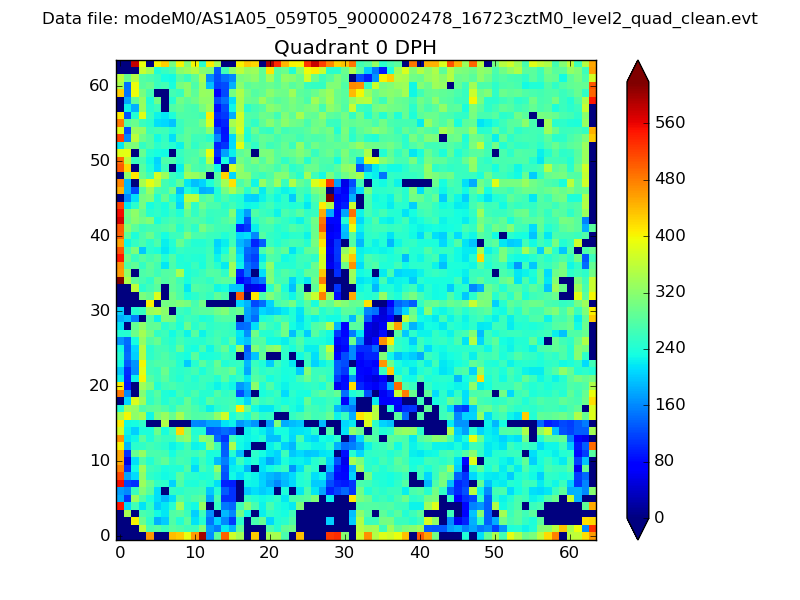 |
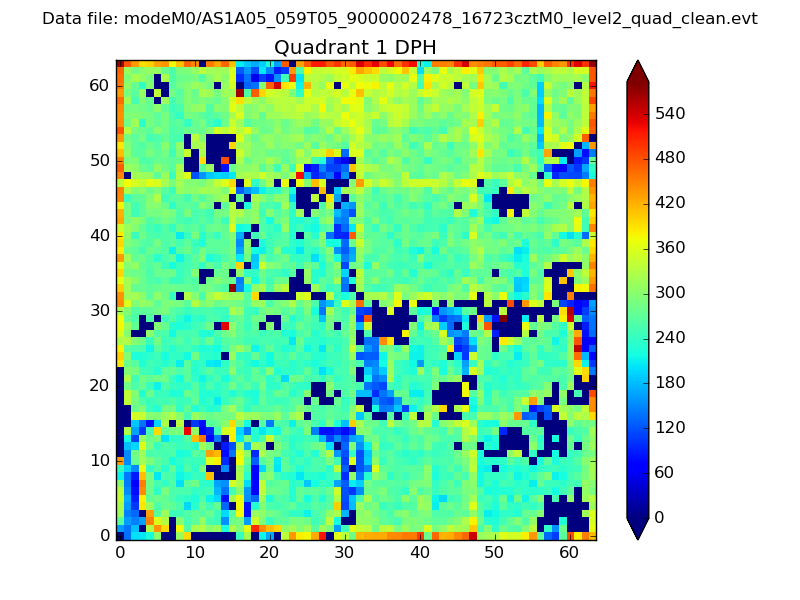 |
Quadrant B |
|---|---|---|---|
| Quadrant D | 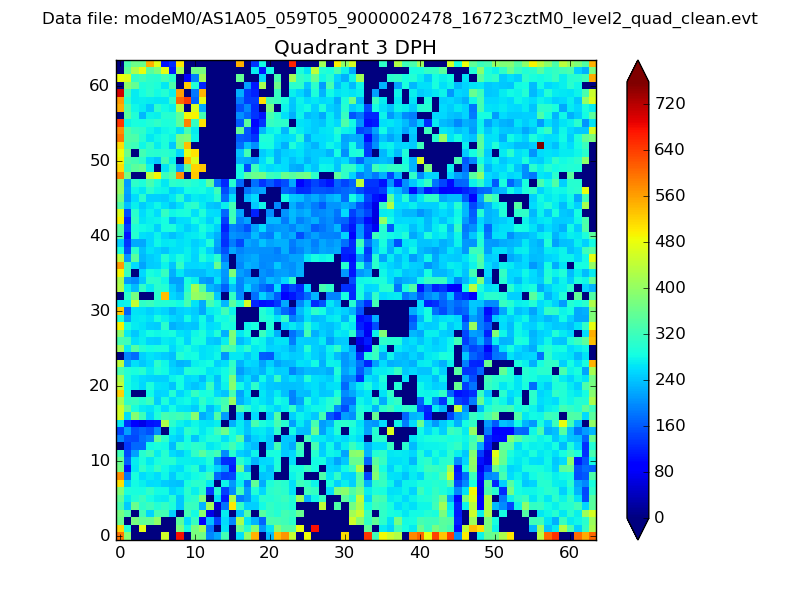 |
 |
Quadrant C |
| Plot type | Count rate plots | Images |
|---|---|---|
| Comparison with Poisson distribution Blue bars denote a histogram of data divided into 1 sec bins. Red curve is a Poisson curve with rate = median count rate of data. |
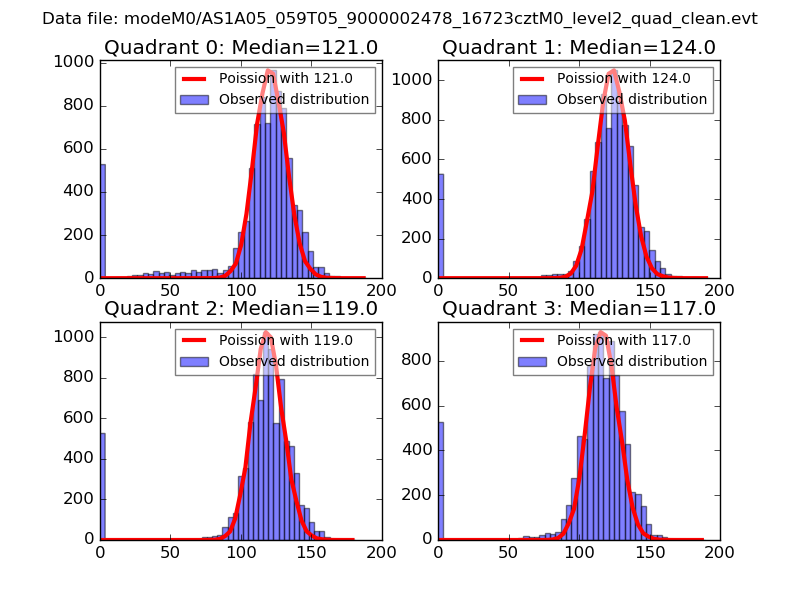 |
 |
| Quadrant-wise count rates Data is divided into 100 sec bins |
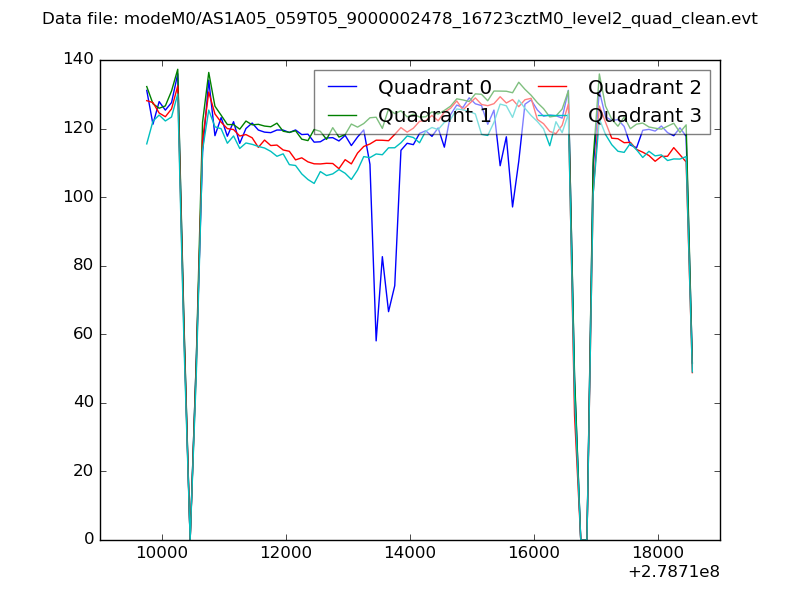 |
|
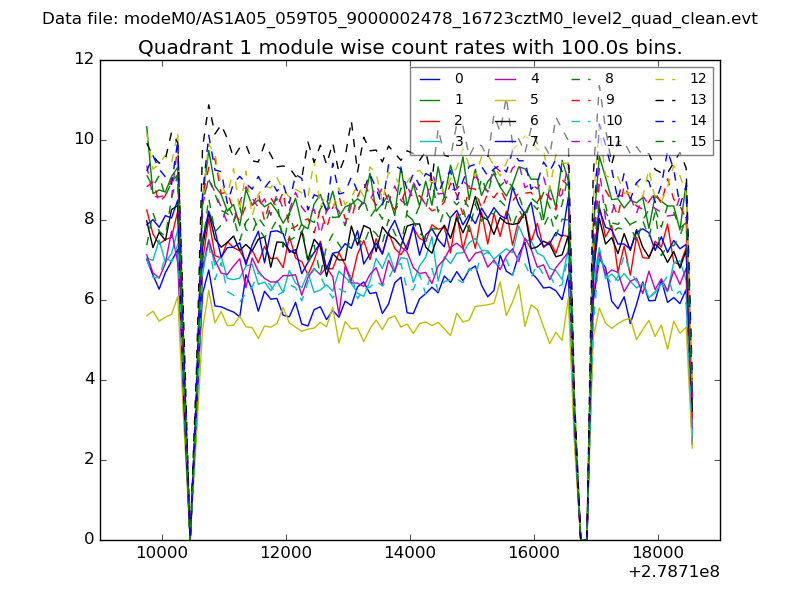
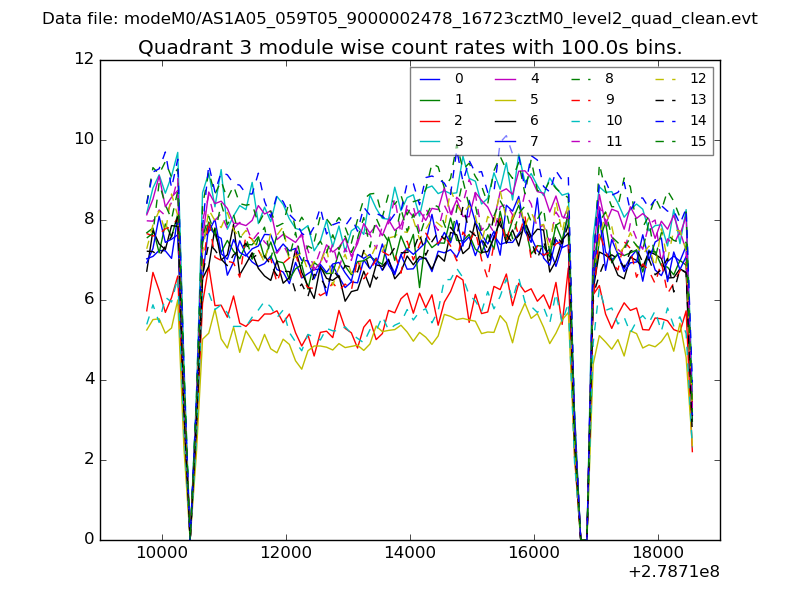
| Module-wise count rates for Quadrant A Data is divided into 100 sec bins |
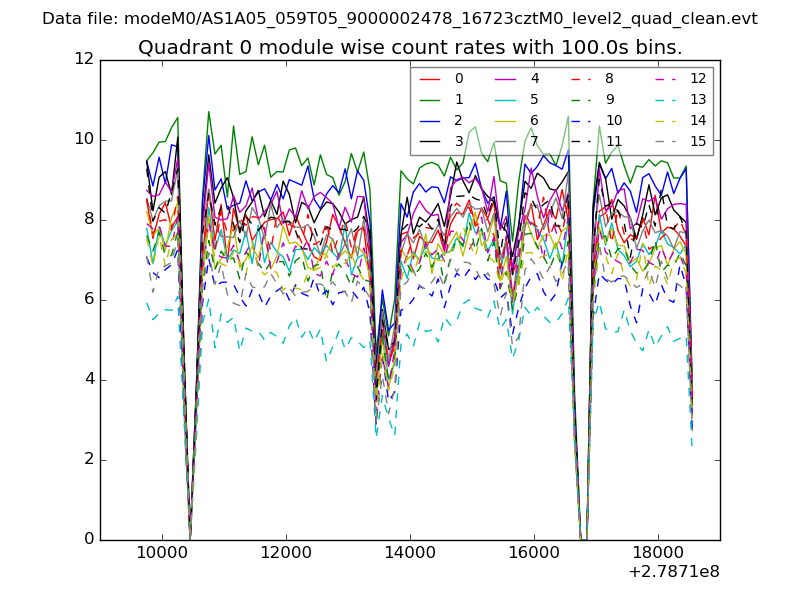 |
 |
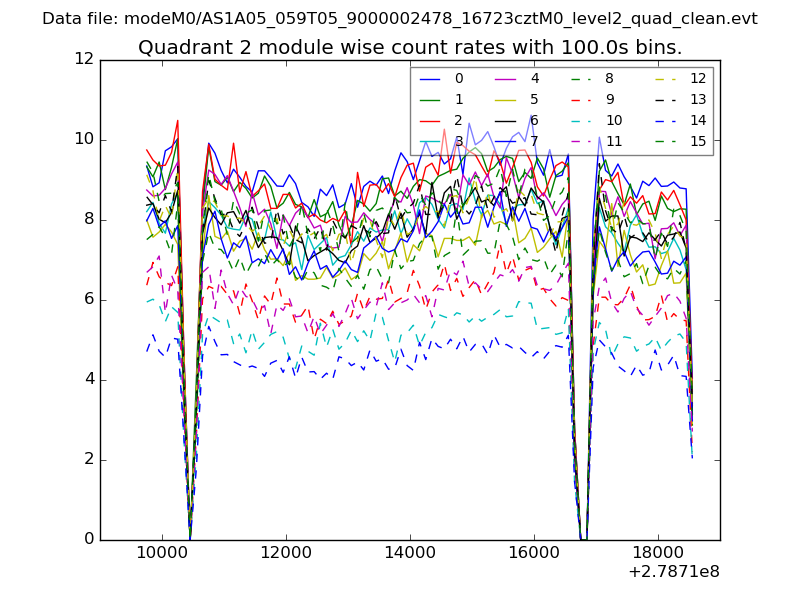
| Module-wise count rates for Quadrant B Data is divided into 100 sec bins |
 |
 |
| Module-wise count rates for Quadrant C Data is divided into 100 sec bins |
 |
 |
| Module-wise count rates for Quadrant D Data is divided into 100 sec bins |
 |
 |
| Parameter | Plot |
|---|---|
| CZT HV Monitor | 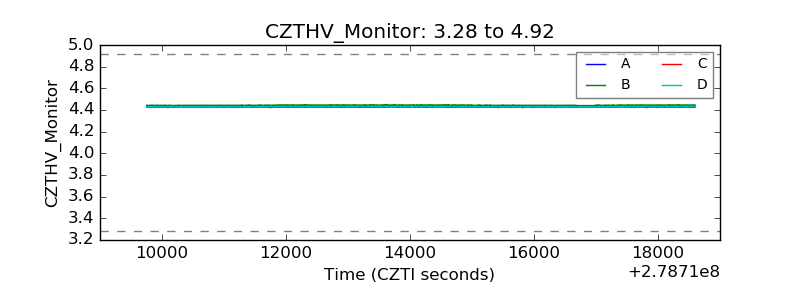 |
| D_VDD |  |
| Temperature 1 | 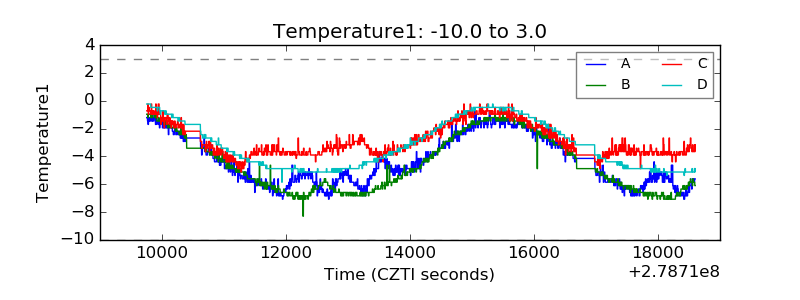 |
| Veto HV Monitor | 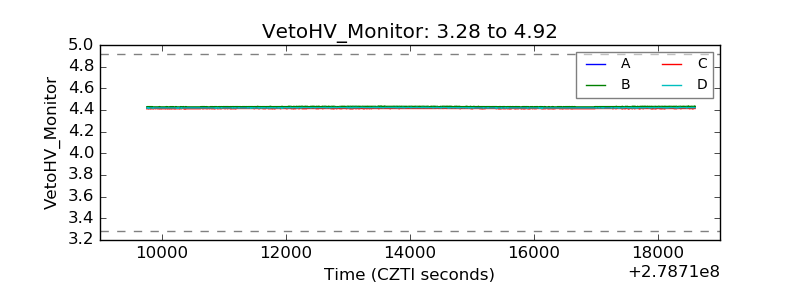 |
| Veto LLD | 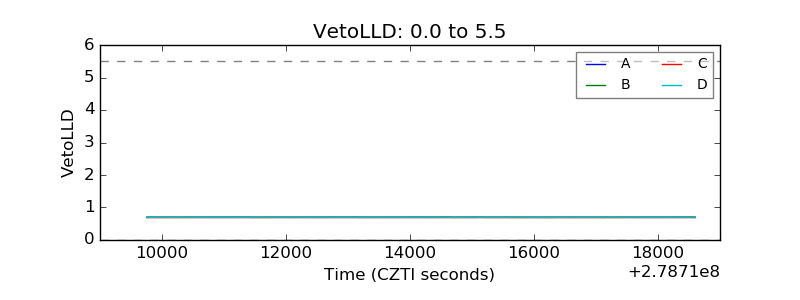 |
| Alpha Counter | 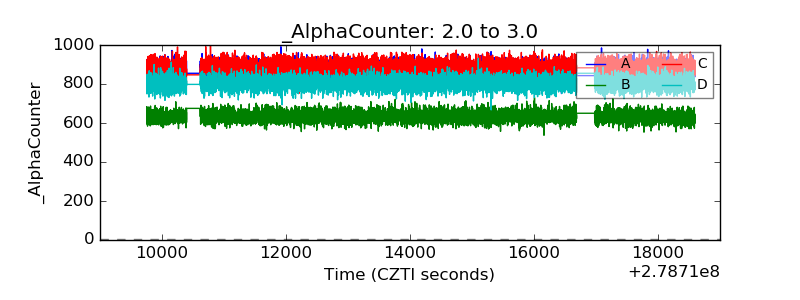 |
| _CPM_Rate | 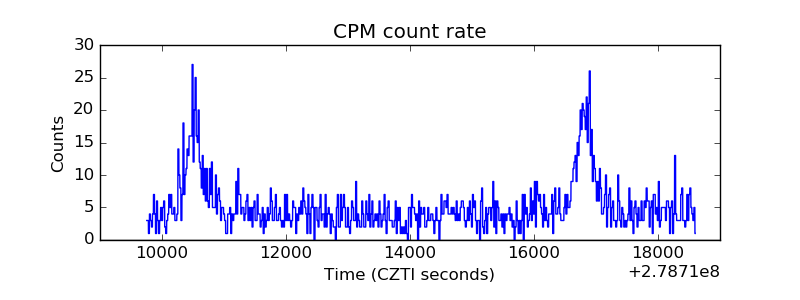 |
| CZT Counter | 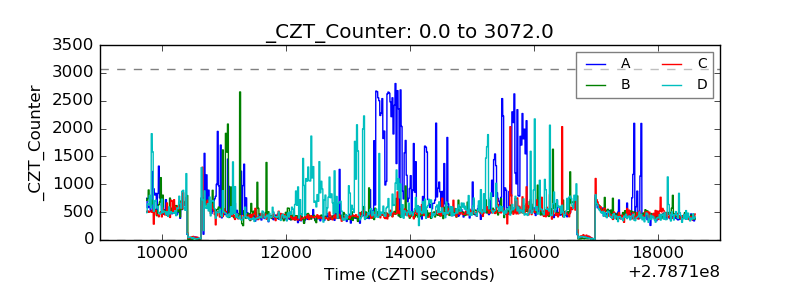 |
| +2.5 Volts monitor |  |
| +5 Volts monitor |  |
| _ROLL_ROT | 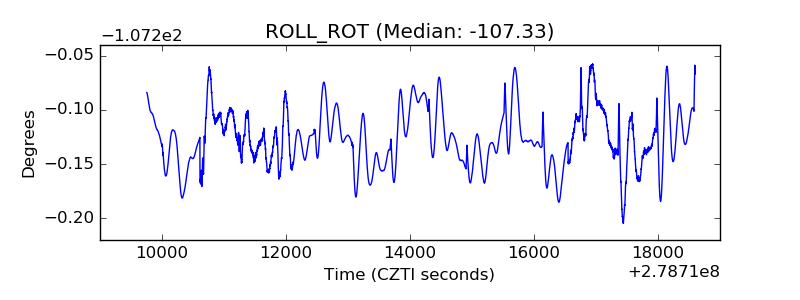 |
| _Roll_DEC | 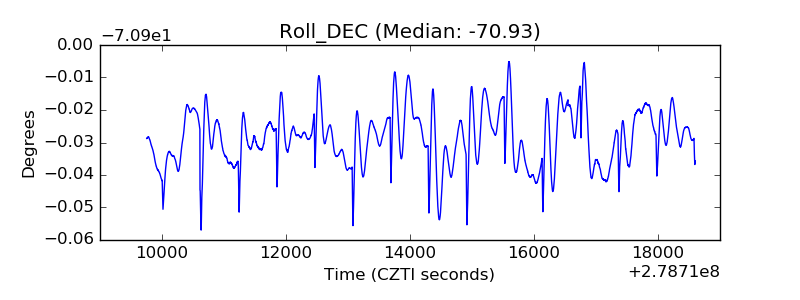 |
| _Roll_RA | 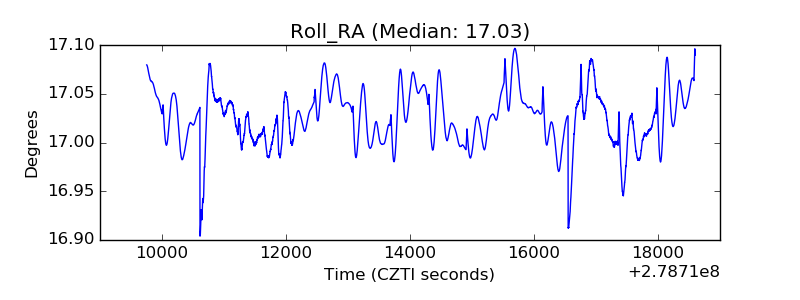 |
| Veto Counter | 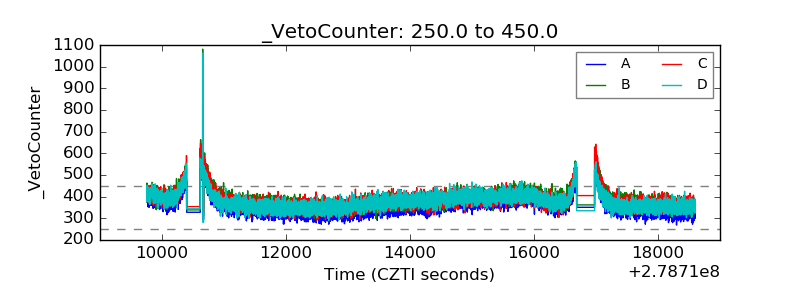 |