| Param | Original file | Final file |
|---|---|---|
| Filename | modeM0/AS1A05_059T07_9000002480cztM0_level2.fits | modeM0/AS1A05_059T07_9000002480cztM0_level2_quad_clean.evt |
| Size (bytes) | 170,392,320 | 232,456,320 |
| Size | 162.5 MB | 221.7 MB |
| Events in quadrant A | 995,512 | 1,432,268 |
| Events in quadrant B | 987,008 | 1,519,018 |
| Events in quadrant C | 1,014,978 | 1,463,469 |
| Events in quadrant D | 877,386 | 1,340,611 |
| Mode M0 | |||
|---|---|---|---|
| Quadrant | BADHDUFLAG | Total packets | Discarded packets |
| A | 0 | 52416 | 0 |
| B | 0 | 41260 | 0 |
| C | 0 | 39139 | 0 |
| D | 0 | 43488 | 0 |
| Mode M9 | |||
|---|---|---|---|
| Quadrant | BADHDUFLAG | Total packets | Discarded packets |
| A | 0 | 19 | 0 |
| B | 0 | 19 | 0 |
| C | 0 | 19 | 0 |
| D | 0 | 19 | 0 |
| Mode SS | |||
|---|---|---|---|
| Quadrant | BADHDUFLAG | Total packets | Discarded packets |
| A | 0 | 376 | 0 |
| B | 0 | 376 | 0 |
| C | 0 | 376 | 0 |
| D | 0 | 376 | 0 |
| Quadrant | Total seconds | Saturated seconds | Saturation percentage |
|---|---|---|---|
| A | 18657 | 1395 | 7.477086% |
| B | 18657 | 365 | 1.956370% |
| C | 18657 | 275 | 1.473978% |
| D | 18657 | 493 | 2.642440% |
Noise dominated data is calculated using 1-second bins in cleaned event files. If a bin has >2000 counts, and if more than 50% of those come from <1% of pixels, then it is considered to be noise-dominated and hence unusable.
| Quadrant | # 1 sec bins | Bins with >0 counts | Bins with >2000 counts | High rate bins dominated by noise | Noise dominated (total time) | Noise dominated (detector-on time) | Marked lightcurve |
|---|---|---|---|---|---|---|---|
| A | 20447 | 18649 | 0 | 0 | 0.00% | 0.00% |  |
| B | 20447 | 18656 | 0 | 0 | 0.00% | 0.00% |  |
| C | 20447 | 18656 | 0 | 0 | 0.00% | 0.00% |  |
| D | 20447 | 18655 | 0 | 0 | 0.00% | 0.00% |  |
Top three noisy pixels from each quadrant. If the there are fewer than three noisy pixels in the level2.evt file, extra rows are filled as -1
| Pixel properties | Quadrant properties | ||||||
|---|---|---|---|---|---|---|---|
| Quadrant | DetID | PixID | Counts | Sigma | Mean | Median | Sigma |
| A | 0 | 29 | 929 | 10.21 | 259 | 242 | 67.3 |
| A | 7 | 110 | 766 | 7.79 | 259 | 242 | 67.3 |
| A | 0 | 30 | 751 | 7.57 | 259 | 242 | 67.3 |
| B | 2 | 9 | 824 | 10.8 | 261 | 249 | 53.3 |
| B | 2 | 8 | 694 | 8.36 | 261 | 249 | 53.3 |
| B | 3 | 17 | 690 | 8.28 | 261 | 249 | 53.3 |
| C | 1 | 80 | 774 | 7.48 | 267 | 249 | 70.1 |
| C | 1 | 81 | 752 | 7.17 | 267 | 249 | 70.1 |
| C | 12 | 241 | 704 | 6.48 | 267 | 249 | 70.1 |
| D | 3 | 14 | 723 | 7.28 | 249 | 227 | 68.1 |
| D | 6 | 231 | 630 | 5.92 | 249 | 227 | 68.1 |
| D | 3 | 30 | 616 | 5.71 | 249 | 227 | 68.1 |
Histogram calculated using DETX and DETY for each event in the final _common_clean file
| Quadrant A | 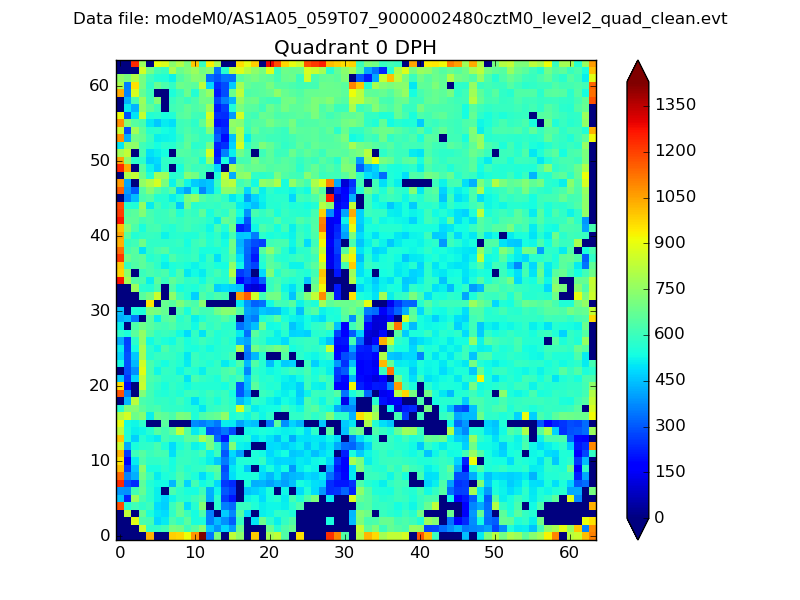 |
 |
Quadrant B |
|---|---|---|---|
| Quadrant D | 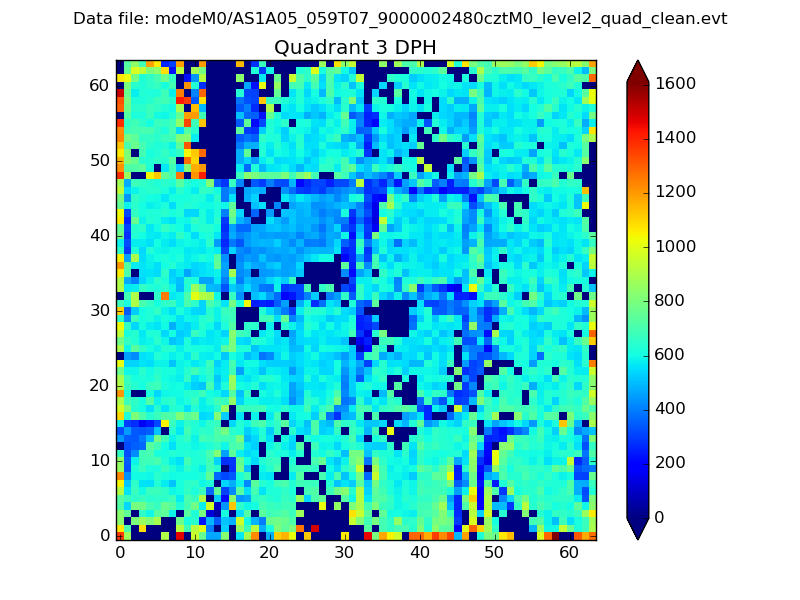 |
 |
Quadrant C |
| Plot type | Count rate plots | Images |
|---|---|---|
| Comparison with Poisson distribution Blue bars denote a histogram of data divided into 1 sec bins. Red curve is a Poisson curve with rate = median count rate of data. |
 |
 |
| Quadrant-wise count rates Data is divided into 100 sec bins |
 |
|
| Module-wise count rates for Quadrant A Data is divided into 100 sec bins |
 |
 |
| Module-wise count rates for Quadrant B Data is divided into 100 sec bins |
 |
 |
| Module-wise count rates for Quadrant C Data is divided into 100 sec bins |
 |
 |
| Module-wise count rates for Quadrant D Data is divided into 100 sec bins |
 |
 |
| Parameter | Plot |
|---|---|
| CZT HV Monitor | 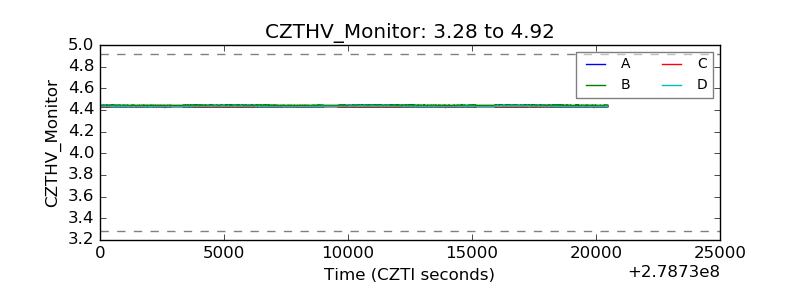 |
| D_VDD |  |
| Temperature 1 |  |
| Veto HV Monitor | 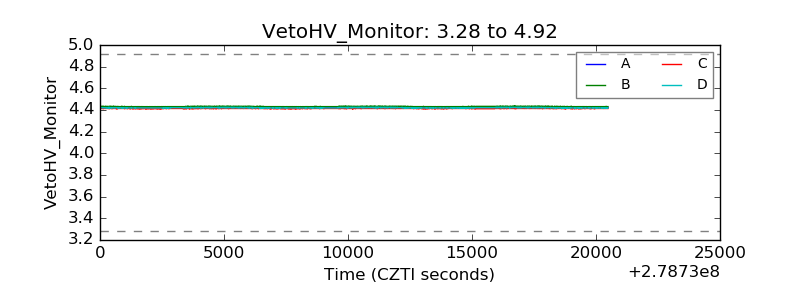 |
| Veto LLD |  |
| Alpha Counter |  |
| _CPM_Rate |  |
| CZT Counter |  |
| +2.5 Volts monitor |  |
| +5 Volts monitor |  |
| _ROLL_ROT | 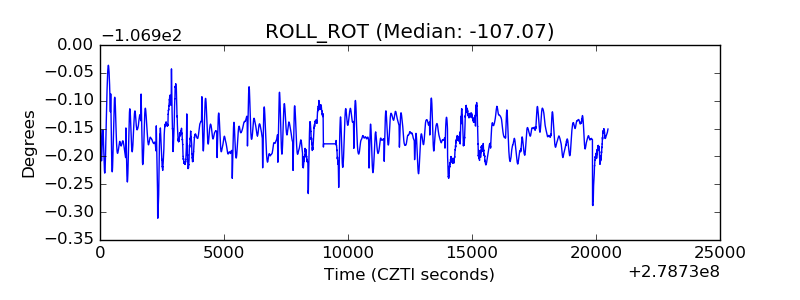 |
| _Roll_DEC | 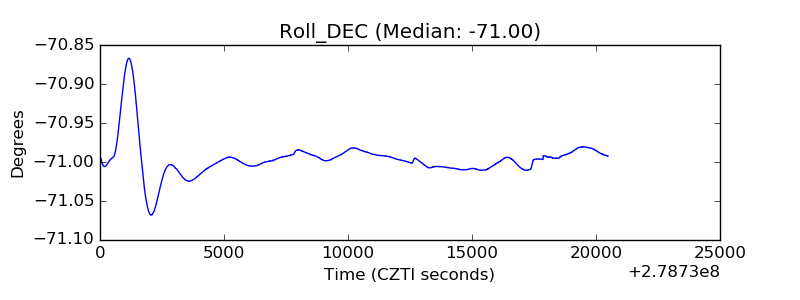 |
| _Roll_RA |  |
| Veto Counter |  |