| Param | Original file | Final file |
|---|---|---|
| Filename | modeM0/AS1A05_059T07_9000002480_16726cztM0_level2.evt | modeM0/AS1A05_059T07_9000002480_16726cztM0_level2_quad_clean.evt |
| Size (bytes) | 1,135,886,400 | 262,082,880 |
| Size | 1.1 GB | 249.9 MB |
| Events in quadrant A | 10,488,108 | 1,712,006 |
| Events in quadrant B | 7,660,807 | 1,791,137 |
| Events in quadrant C | 7,144,875 | 1,738,979 |
| Events in quadrant D | 8,127,247 | 1,695,607 |
| Mode M0 | |||
|---|---|---|---|
| Quadrant | BADHDUFLAG | Total packets | Discarded packets |
| A | 0 | 40898 | 4 |
| B | 0 | 32179 | 3 |
| C | 0 | 30488 | 3 |
| D | 0 | 33869 | 3 |
| Mode M9 | |||
|---|---|---|---|
| Quadrant | BADHDUFLAG | Total packets | Discarded packets |
| A | 0 | 19 | 0 |
| B | 0 | 19 | 0 |
| C | 0 | 19 | 0 |
| D | 0 | 19 | 0 |
| Mode SS | |||
|---|---|---|---|
| Quadrant | BADHDUFLAG | Total packets | Discarded packets |
| A | 0 | 294 | 0 |
| B | 0 | 294 | 0 |
| C | 0 | 294 | 0 |
| D | 0 | 294 | 0 |
| Quadrant | Total seconds | Saturated seconds | Saturation percentage |
|---|---|---|---|
| A | 14494 | 1201 | 8.286187% |
| B | 14494 | 325 | 2.242307% |
| C | 14494 | 259 | 1.786946% |
| D | 14494 | 485 | 3.346212% |
Noise dominated data is calculated using 1-second bins in cleaned event files. If a bin has >2000 counts, and if more than 50% of those come from <1% of pixels, then it is considered to be noise-dominated and hence unusable.
| Quadrant | # 1 sec bins | Bins with >0 counts | Bins with >2000 counts | High rate bins dominated by noise | Noise dominated (total time) | Noise dominated (detector-on time) | Marked lightcurve |
|---|---|---|---|---|---|---|---|
| A | 16285 | 14498 | 741 | 741 | 4.55% | 5.11% | 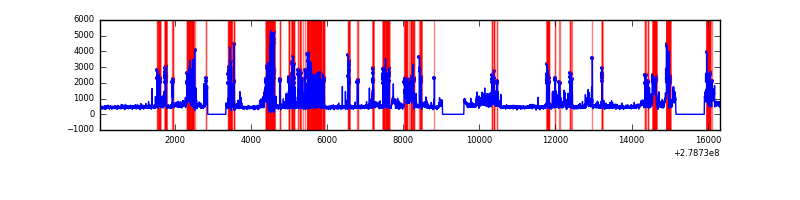 |
| B | 16285 | 14498 | 61 | 61 | 0.37% | 0.42% | 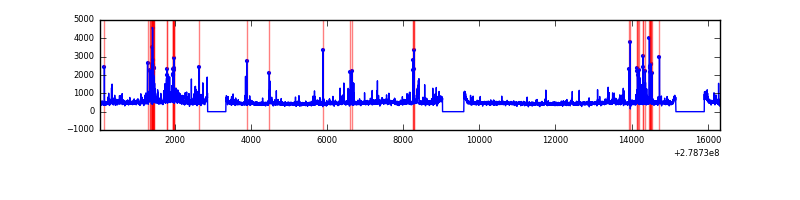 |
| C | 16285 | 14498 | 13 | 13 | 0.08% | 0.09% | 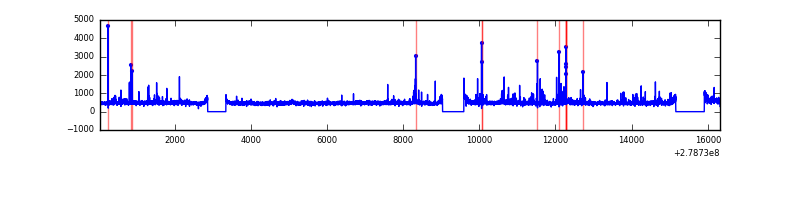 |
| D | 16285 | 14498 | 250 | 250 | 1.54% | 1.72% | 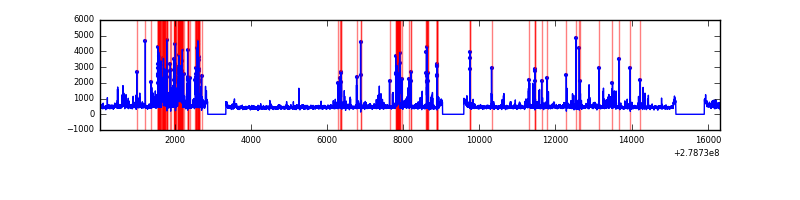 |
Top three noisy pixels from each quadrant. If the there are fewer than three noisy pixels in the level2.evt file, extra rows are filled as -1
| Pixel properties | Quadrant properties | ||||||
|---|---|---|---|---|---|---|---|
| Quadrant | DetID | PixID | Counts | Sigma | Mean | Median | Sigma |
| A | 15 | 174 | 3866345 | 11576.1 | 1662 | 1623 | 333.9 |
| A | 10 | 234 | 132507 | 392.04 | 1662 | 1623 | 333.9 |
| A | 15 | 190 | 58126 | 169.24 | 1662 | 1623 | 333.9 |
| B | 15 | 35 | 474644 | 1467.75 | 1700 | 1655 | 322.3 |
| B | 10 | 16 | 174962 | 537.8 | 1700 | 1655 | 322.3 |
| B | 15 | 36 | 96485 | 294.27 | 1700 | 1655 | 322.3 |
| C | 0 | 207 | 303331 | 796.61 | 1635 | 1645 | 378.7 |
| C | 14 | 238 | 249391 | 654.18 | 1635 | 1645 | 378.7 |
| C | 3 | 233 | 204563 | 535.81 | 1635 | 1645 | 378.7 |
| D | 10 | 70 | 757898 | 1887.51 | 1650 | 1594 | 400.7 |
| D | 2 | 16 | 274434 | 680.93 | 1650 | 1594 | 400.7 |
| D | 13 | 248 | 198703 | 491.92 | 1650 | 1594 | 400.7 |
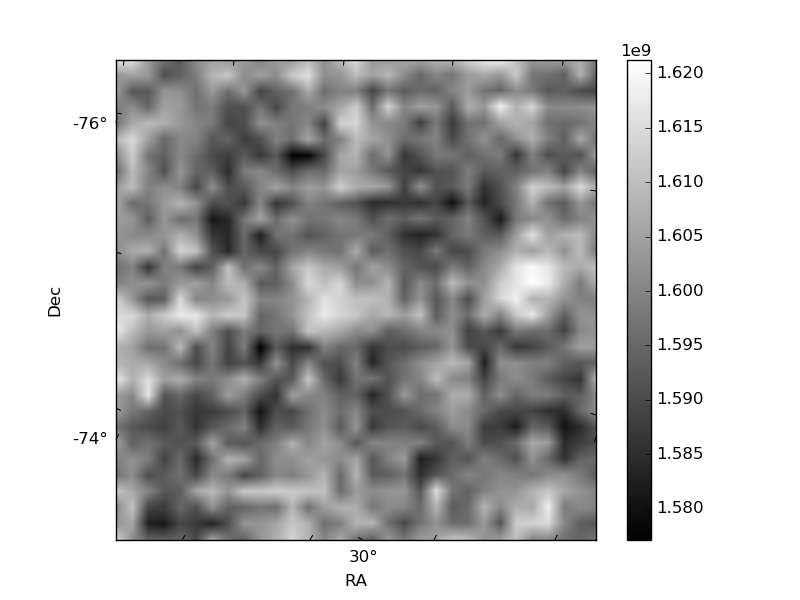
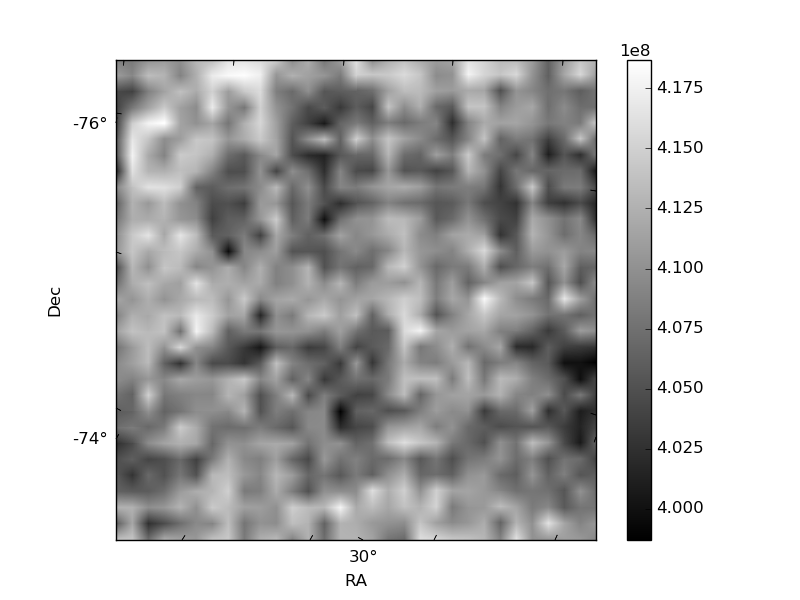
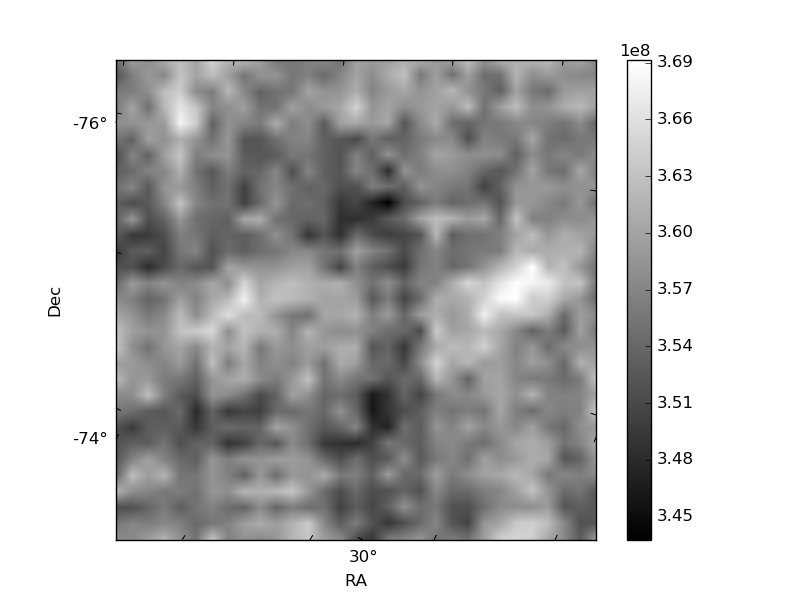
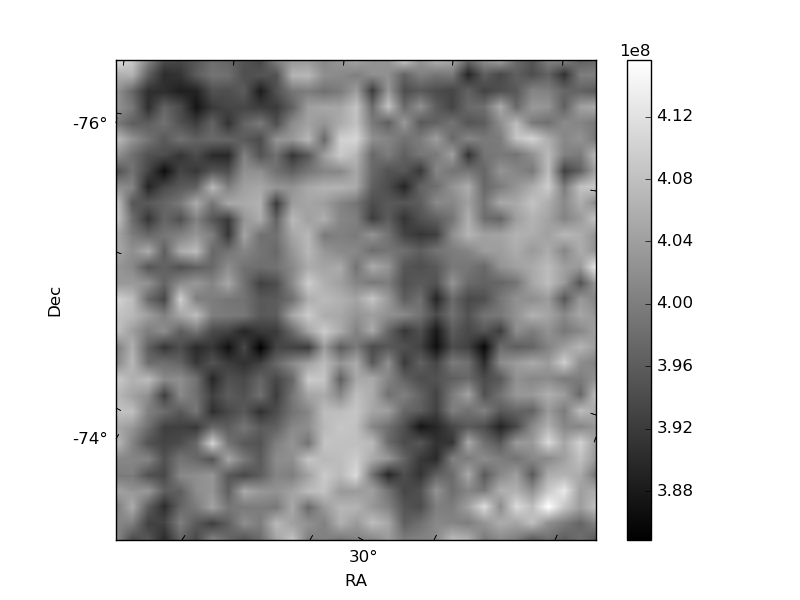
Histogram calculated using DETX and DETY for each event in the final _common_clean file
| Quadrant A | 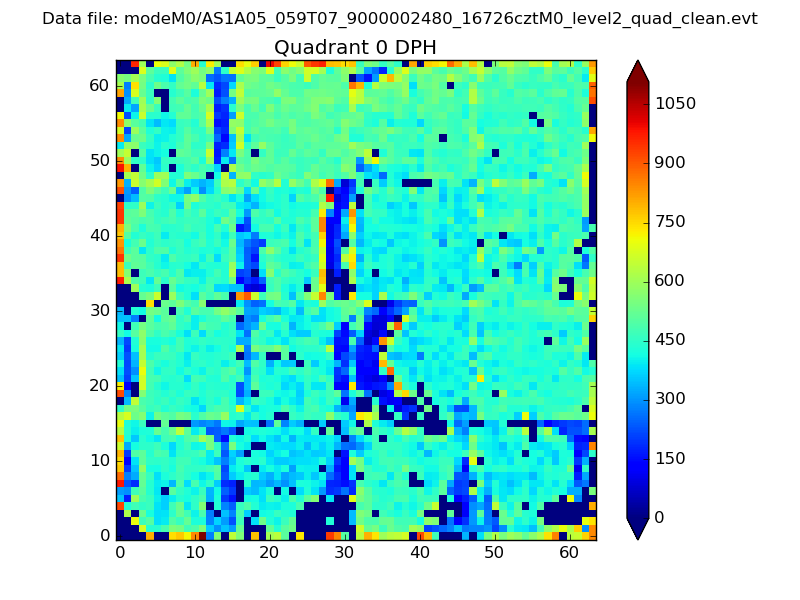 |
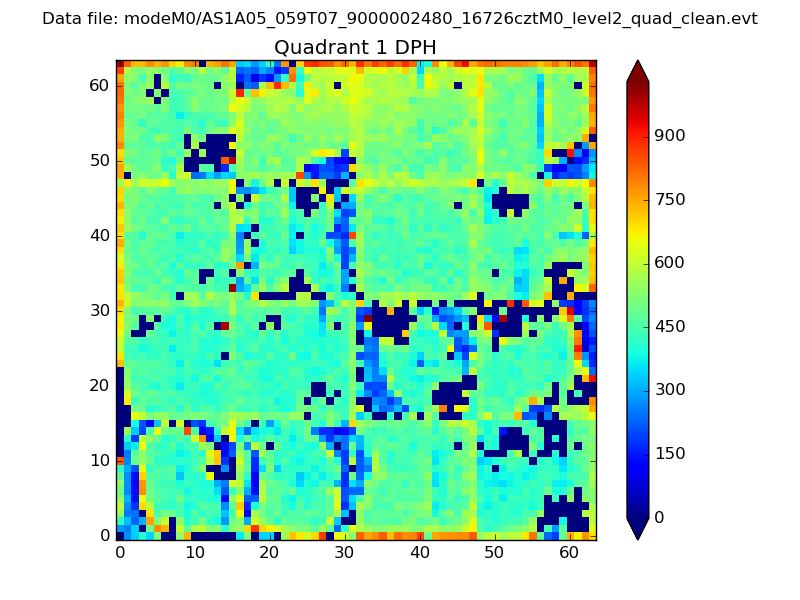 |
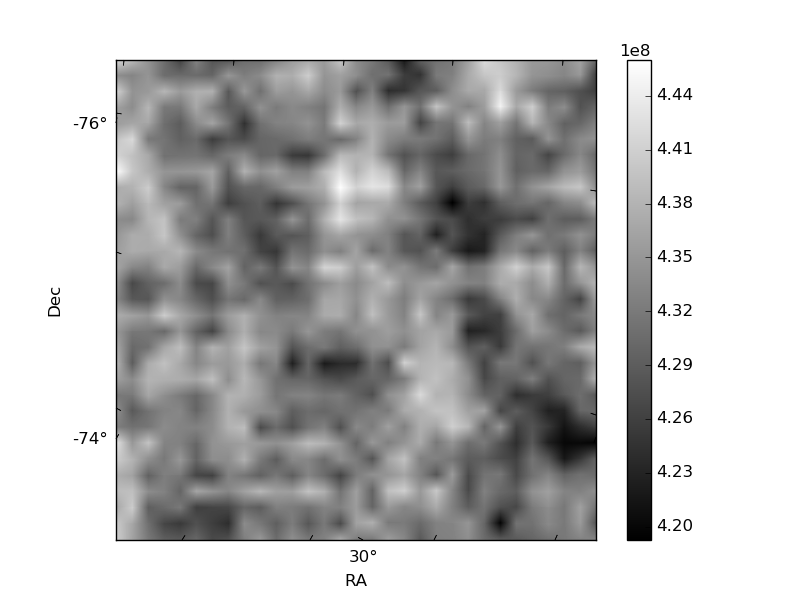
Quadrant B |
|---|---|---|---|
| Quadrant D | 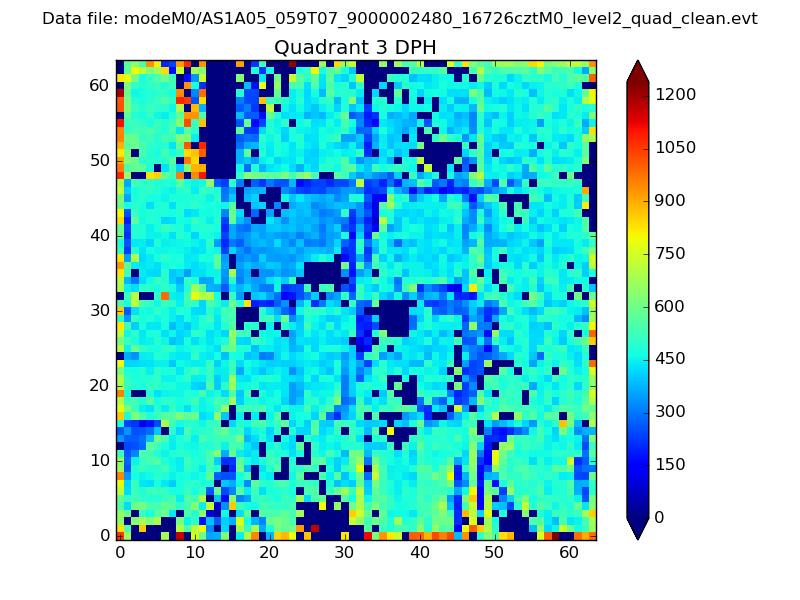 |
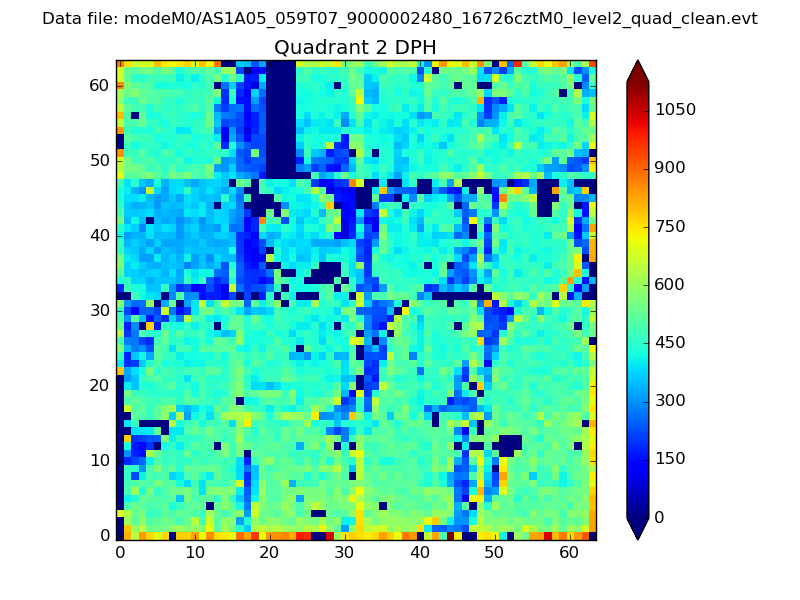 |
Quadrant C |
| Plot type | Count rate plots | Images |
|---|---|---|
| Comparison with Poisson distribution Blue bars denote a histogram of data divided into 1 sec bins. Red curve is a Poisson curve with rate = median count rate of data. |
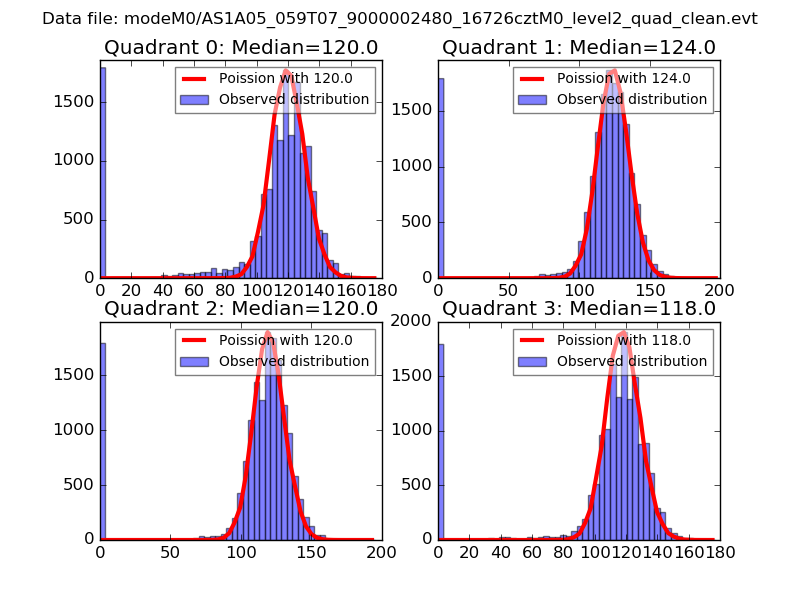 |
 |
| Quadrant-wise count rates Data is divided into 100 sec bins |
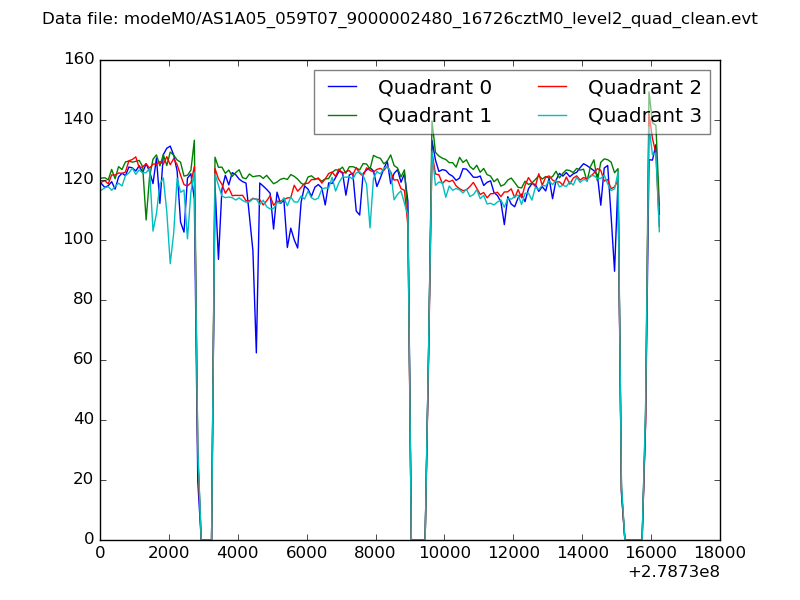 |
|
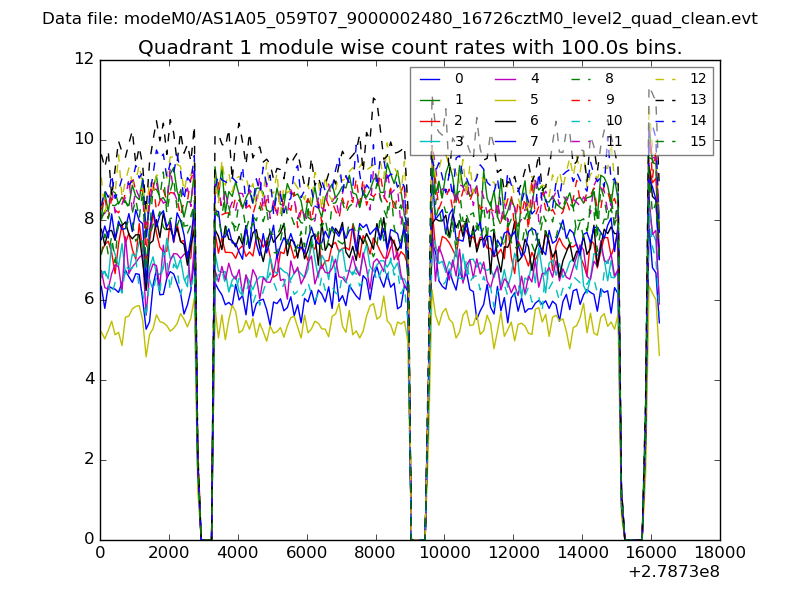
| Module-wise count rates for Quadrant A Data is divided into 100 sec bins |
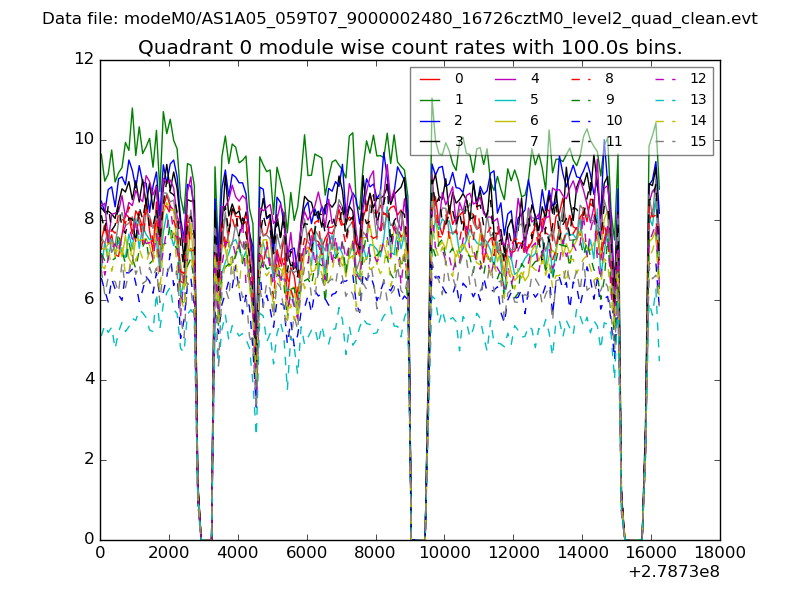 |
 |
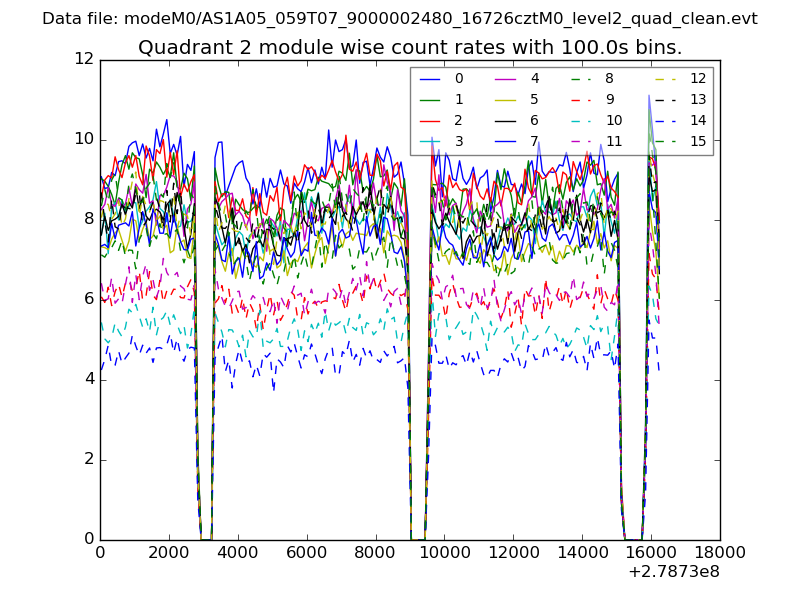
| Module-wise count rates for Quadrant B Data is divided into 100 sec bins |
 |
 |
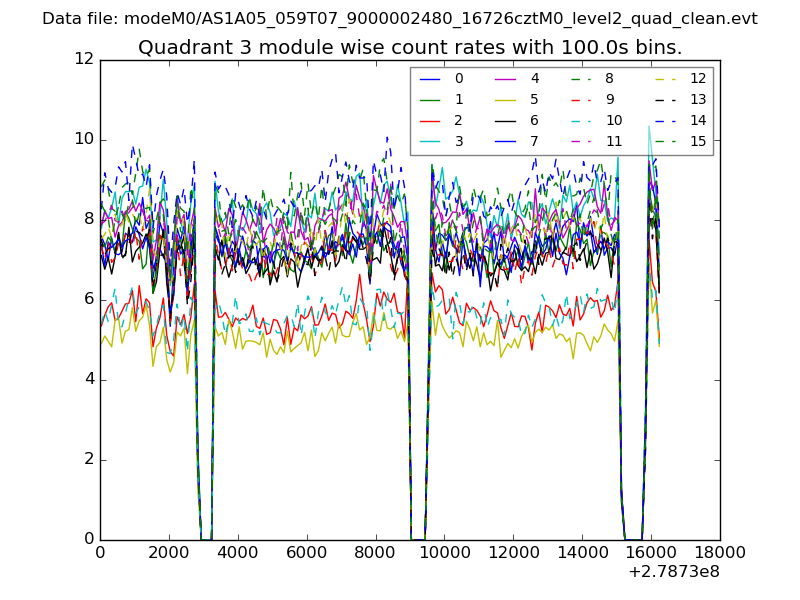
| Module-wise count rates for Quadrant C Data is divided into 100 sec bins |
 |
 |
| Module-wise count rates for Quadrant D Data is divided into 100 sec bins |
 |
 |
| Parameter | Plot |
|---|---|
| CZT HV Monitor | 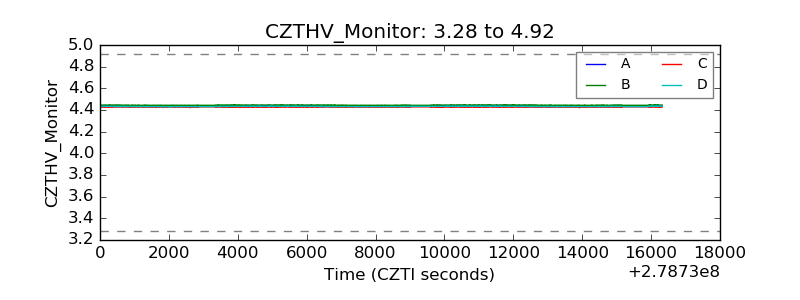 |
| D_VDD | 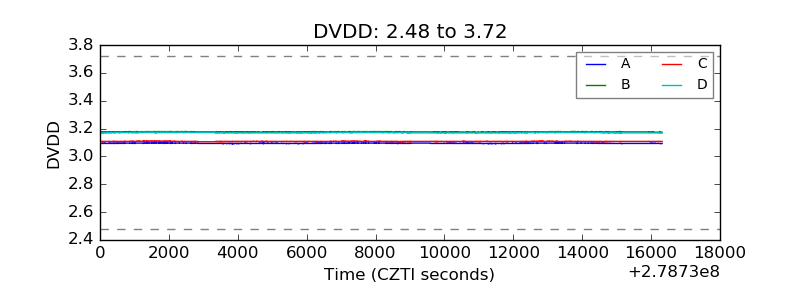 |
| Temperature 1 | 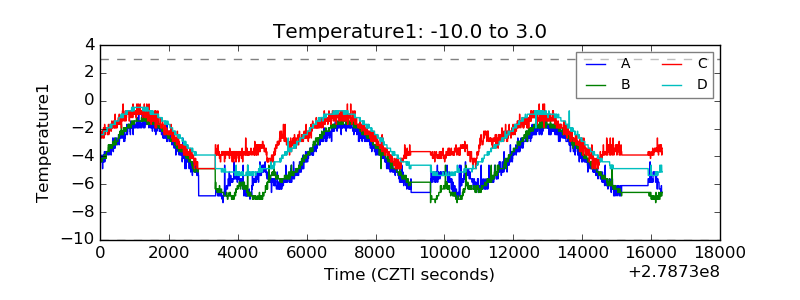 |
| Veto HV Monitor | 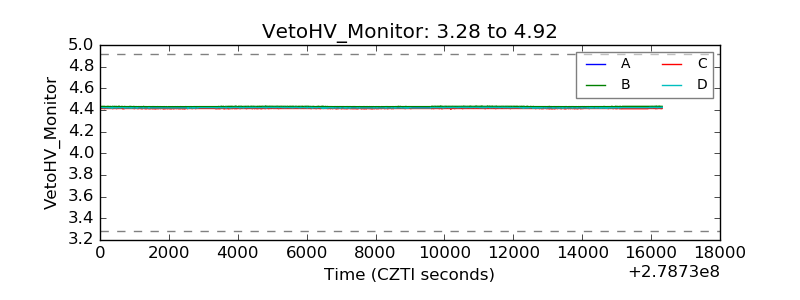 |
| Veto LLD | 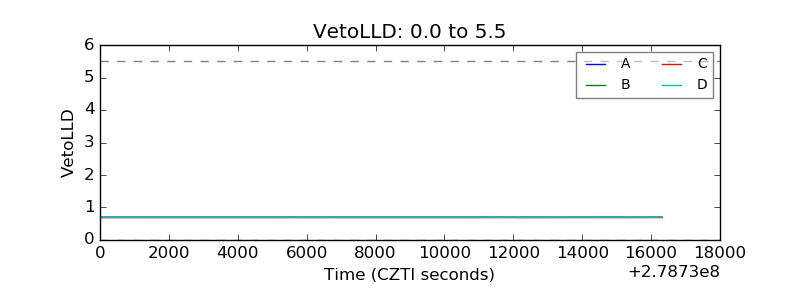 |
| Alpha Counter | 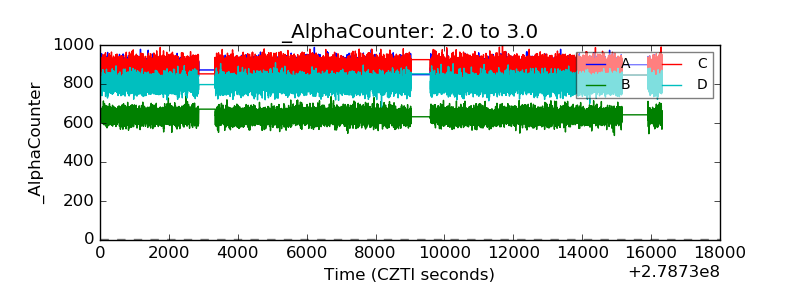 |
| _CPM_Rate | 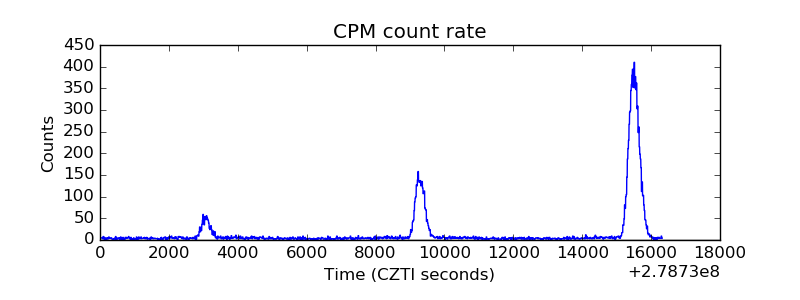 |
| CZT Counter | 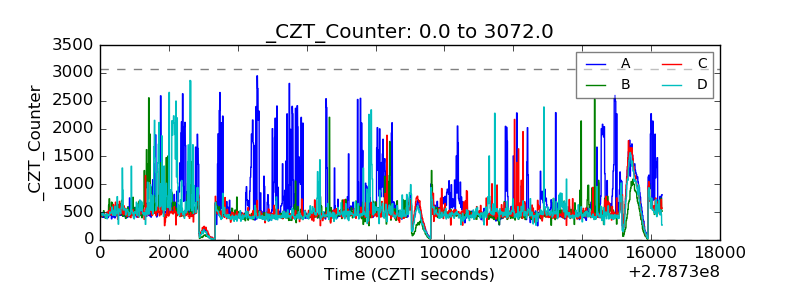 |
| +2.5 Volts monitor |  |
| +5 Volts monitor |  |
| _ROLL_ROT | 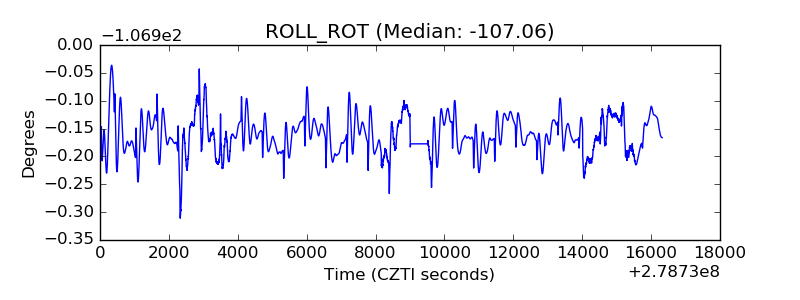 |
| _Roll_DEC | 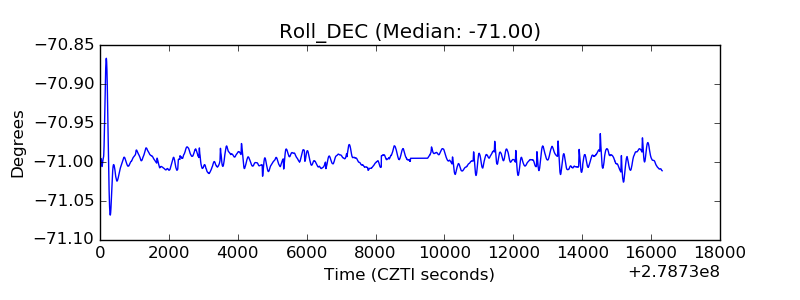 |
| _Roll_RA | 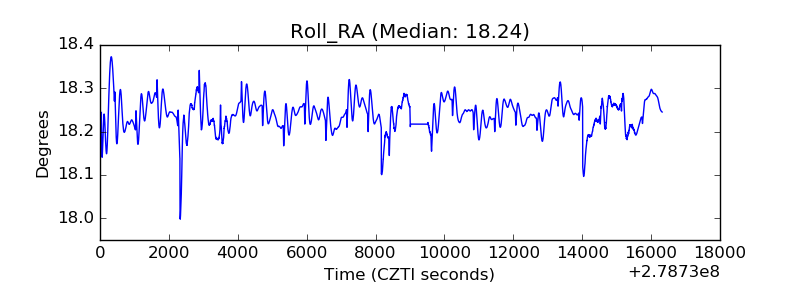 |
| Veto Counter | 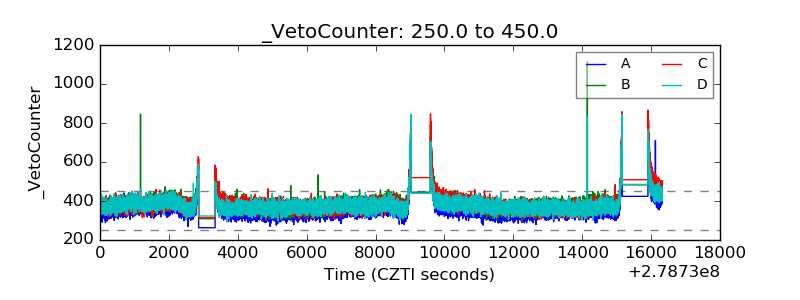 |