| Param | Original file | Final file |
|---|---|---|
| Filename | modeM0/AS1A05_059T07_9000002480_16727cztM0_level2.evt | modeM0/AS1A05_059T07_9000002480_16727cztM0_level2_quad_clean.evt |
| Size (bytes) | 376,692,480 | 87,307,200 |
| Size | 359.2 MB | 83.3 MB |
| Events in quadrant A | 3,568,603 | 567,948 |
| Events in quadrant B | 2,491,536 | 592,704 |
| Events in quadrant C | 2,373,427 | 580,805 |
| Events in quadrant D | 2,650,640 | 568,185 |
| Mode M0 | |||
|---|---|---|---|
| Quadrant | BADHDUFLAG | Total packets | Discarded packets |
| A | 0 | 13899 | 1 |
| B | 0 | 10520 | 1 |
| C | 0 | 10207 | 1 |
| D | 0 | 11030 | 1 |
| Mode M9 | |||
|---|---|---|---|
| Quadrant | BADHDUFLAG | Total packets | Discarded packets |
| A | 0 | 8 | 0 |
| B | 0 | 8 | 0 |
| C | 0 | 8 | 0 |
| D | 0 | 8 | 0 |
| Mode SS | |||
|---|---|---|---|
| Quadrant | BADHDUFLAG | Total packets | Discarded packets |
| A | 0 | 96 | 0 |
| B | 0 | 96 | 0 |
| C | 0 | 96 | 0 |
| D | 0 | 96 | 0 |
| Quadrant | Total seconds | Saturated seconds | Saturation percentage |
|---|---|---|---|
| A | 4765 | 373 | 7.827912% |
| B | 4765 | 112 | 2.350472% |
| C | 4765 | 94 | 1.972718% |
| D | 4765 | 65 | 1.364113% |
Noise dominated data is calculated using 1-second bins in cleaned event files. If a bin has >2000 counts, and if more than 50% of those come from <1% of pixels, then it is considered to be noise-dominated and hence unusable.
| Quadrant | # 1 sec bins | Bins with >0 counts | Bins with >2000 counts | High rate bins dominated by noise | Noise dominated (total time) | Noise dominated (detector-on time) | Marked lightcurve |
|---|---|---|---|---|---|---|---|
| A | 5516 | 4767 | 197 | 197 | 3.57% | 4.13% | 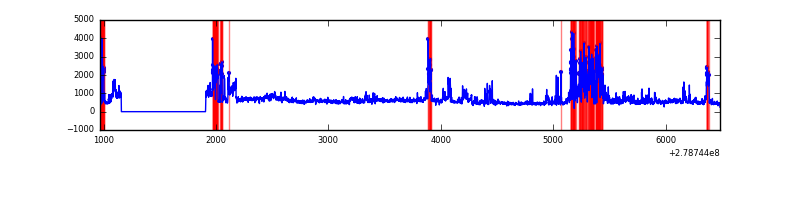 |
| B | 5516 | 4767 | 22 | 22 | 0.40% | 0.46% | 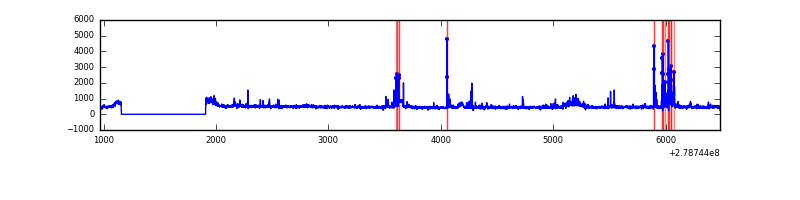 |
| C | 5516 | 4767 | 3 | 3 | 0.05% | 0.06% | 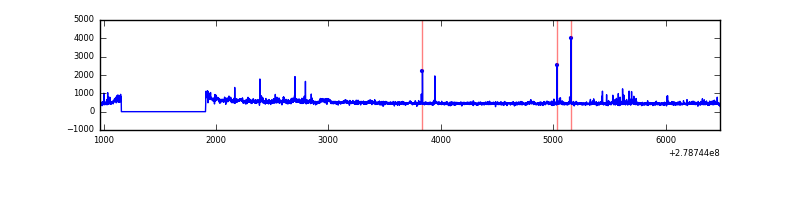 |
| D | 5516 | 4767 | 8 | 8 | 0.15% | 0.17% | 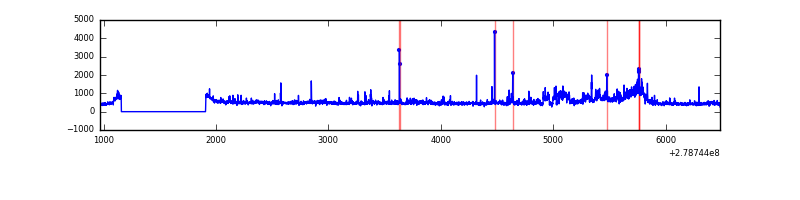 |
Top three noisy pixels from each quadrant. If the there are fewer than three noisy pixels in the level2.evt file, extra rows are filled as -1
| Pixel properties | Quadrant properties | ||||||
|---|---|---|---|---|---|---|---|
| Quadrant | DetID | PixID | Counts | Sigma | Mean | Median | Sigma |
| A | 15 | 174 | 1431695 | 12867.83 | 546 | 533 | 111.2 |
| A | 15 | 190 | 14265 | 123.47 | 546 | 533 | 111.2 |
| A | 3 | 1 | 13651 | 117.95 | 546 | 533 | 111.2 |
| B | 15 | 35 | 175089 | 1646.49 | 554 | 539 | 106.0 |
| B | 10 | 16 | 85422 | 800.68 | 554 | 539 | 106.0 |
| B | 0 | 197 | 20100 | 184.51 | 554 | 539 | 106.0 |
| C | 3 | 233 | 108189 | 856.89 | 539 | 540 | 125.6 |
| C | 14 | 238 | 82997 | 656.36 | 539 | 540 | 125.6 |
| C | 0 | 207 | 80965 | 640.19 | 539 | 540 | 125.6 |
| D | 1 | 52 | 341669 | 2549.65 | 548 | 531 | 133.8 |
| D | 2 | 16 | 99002 | 735.97 | 548 | 531 | 133.8 |
| D | 11 | 176 | 68199 | 505.75 | 548 | 531 | 133.8 |
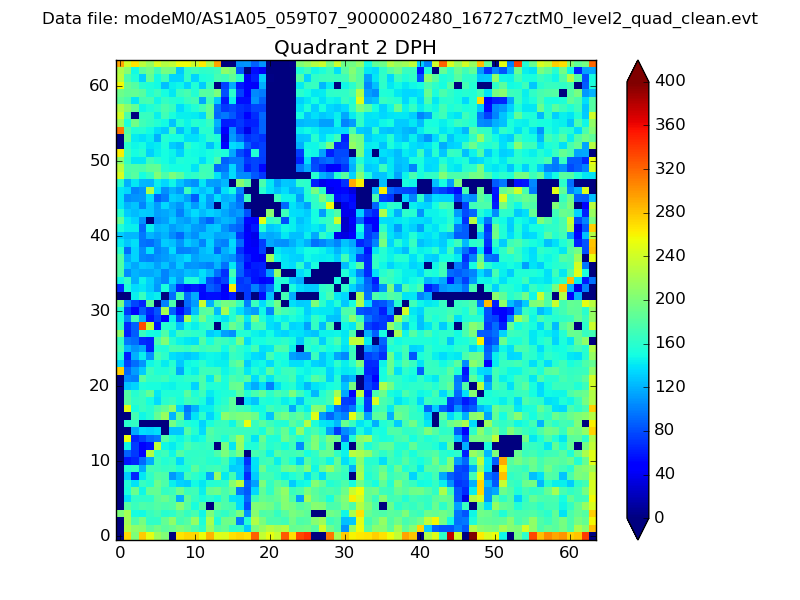
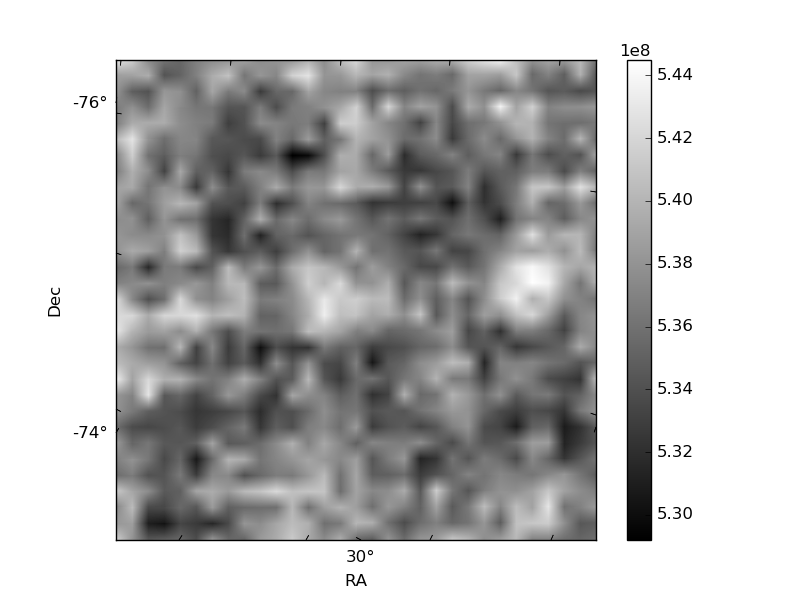
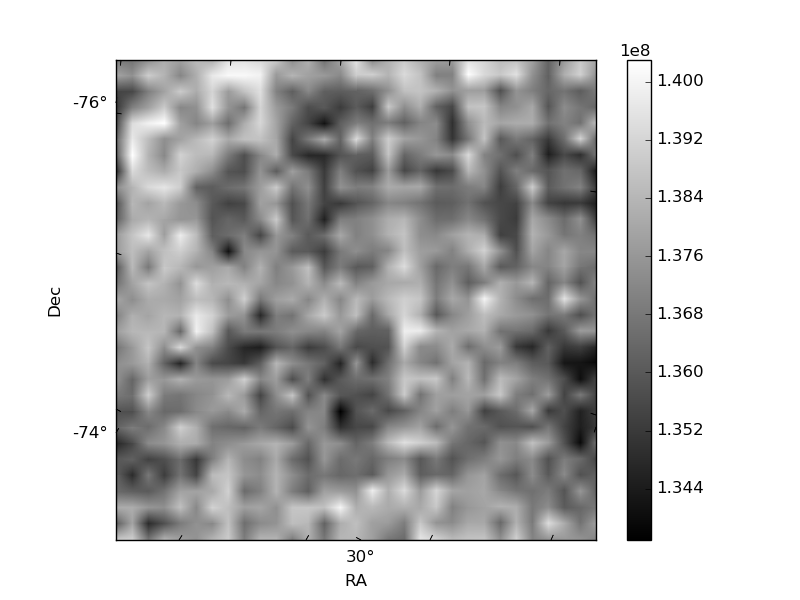
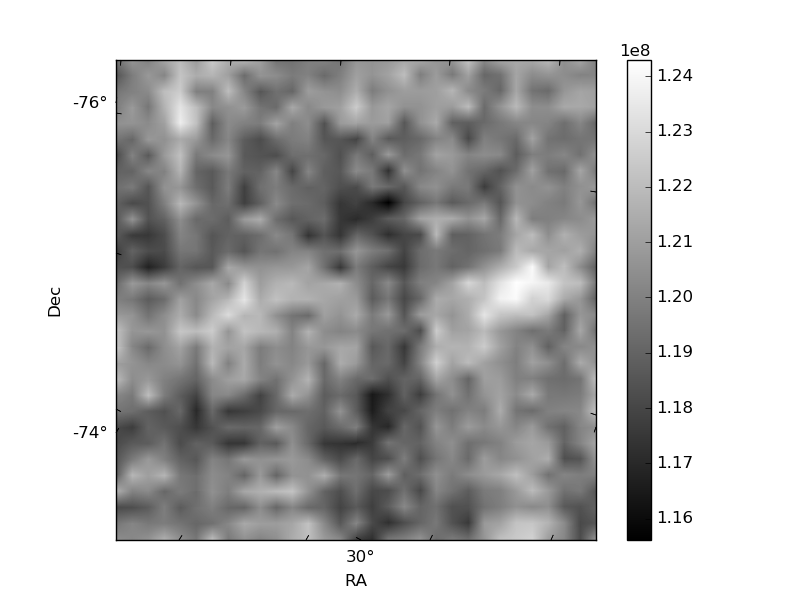
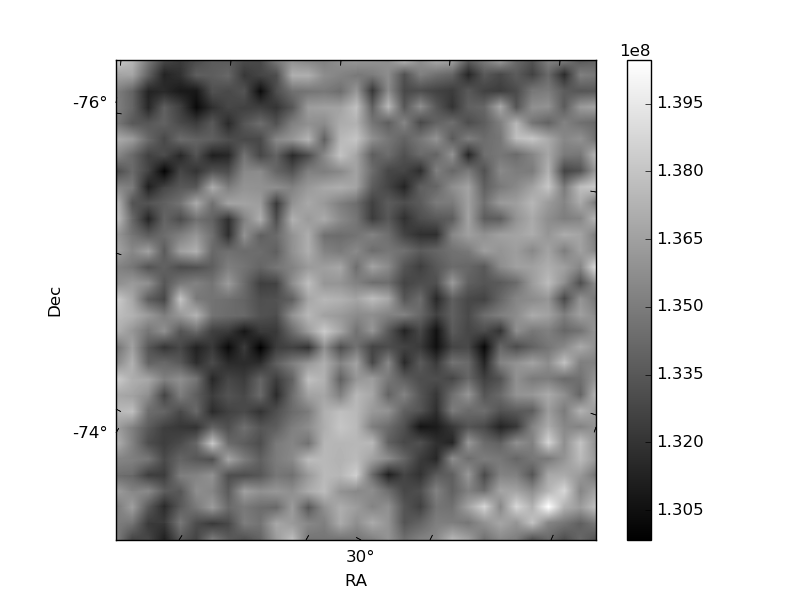
Histogram calculated using DETX and DETY for each event in the final _common_clean file
| Quadrant A | 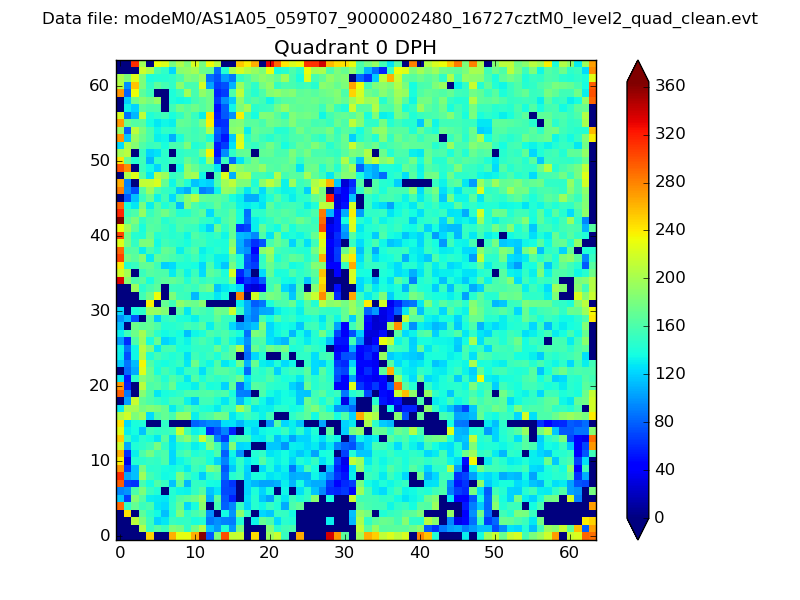 |
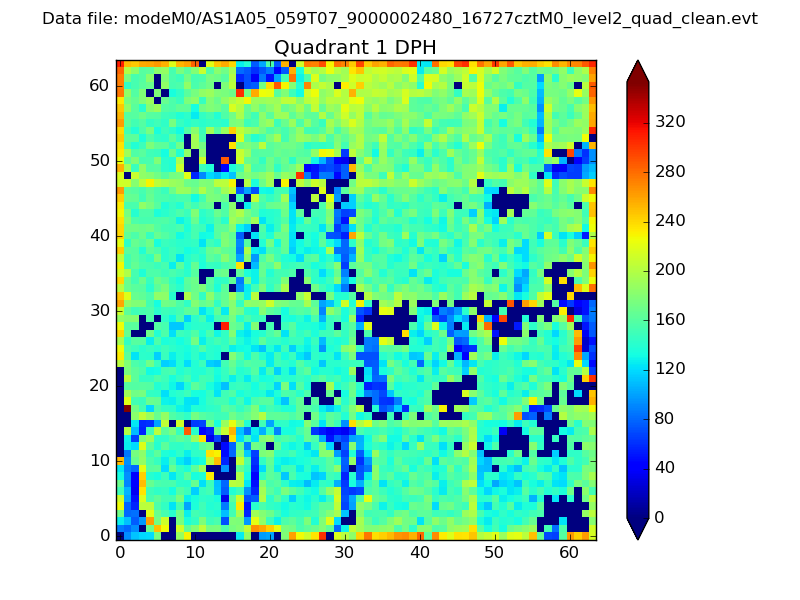 |
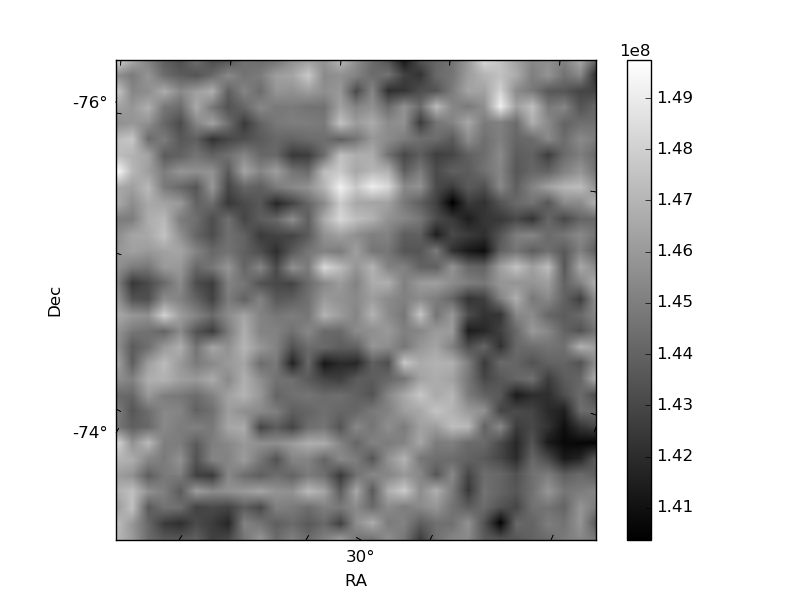
Quadrant B |
|---|---|---|---|
| Quadrant D | 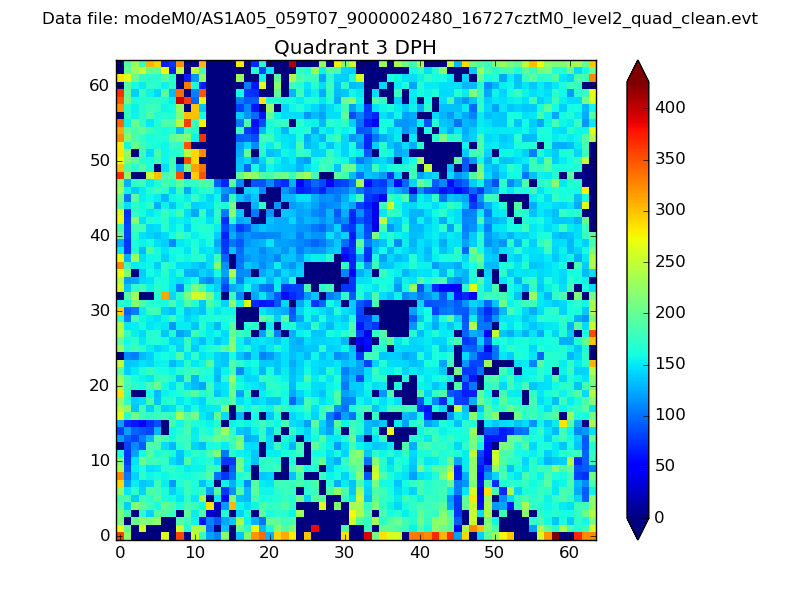 |
 |
Quadrant C |
| Plot type | Count rate plots | Images |
|---|---|---|
| Comparison with Poisson distribution Blue bars denote a histogram of data divided into 1 sec bins. Red curve is a Poisson curve with rate = median count rate of data. |
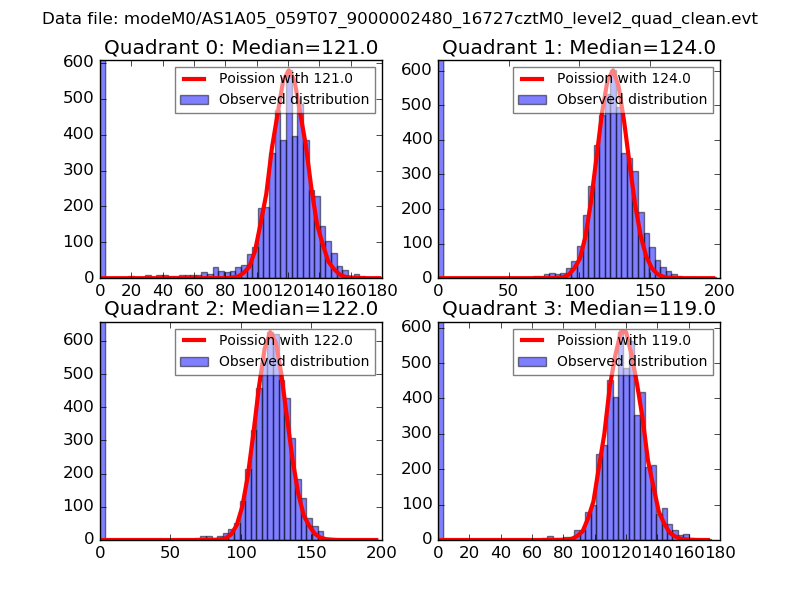 |
 |
| Quadrant-wise count rates Data is divided into 100 sec bins |
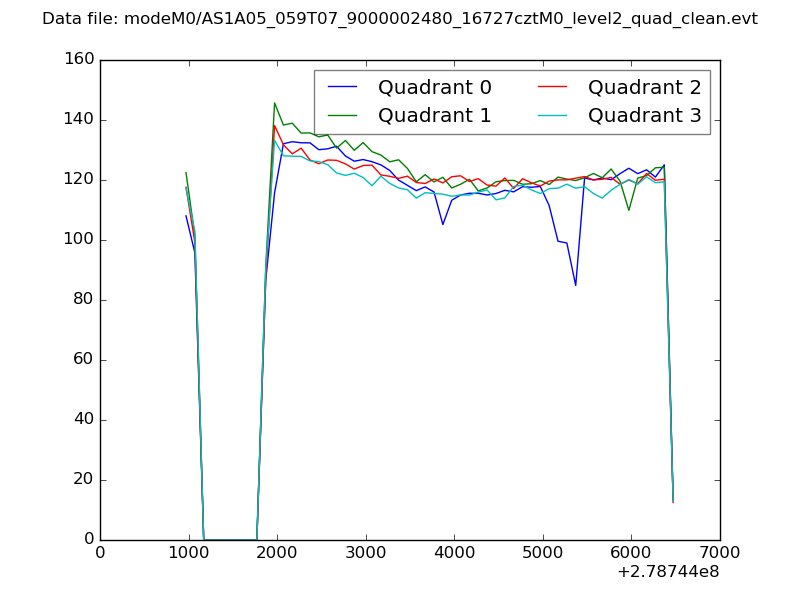 |
|
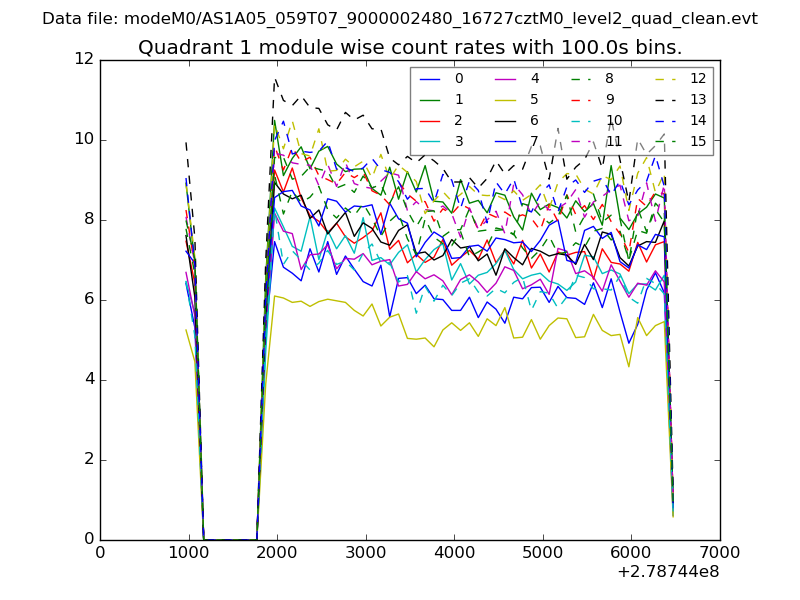
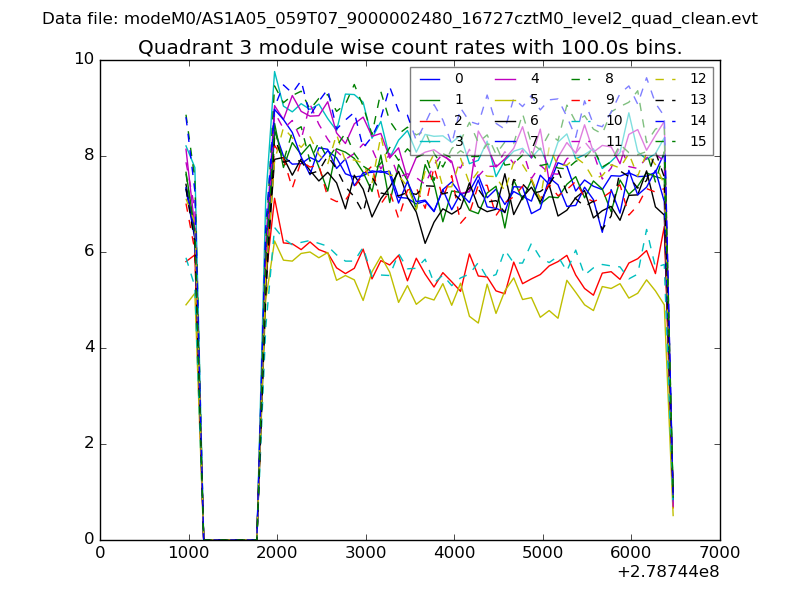
| Module-wise count rates for Quadrant A Data is divided into 100 sec bins |
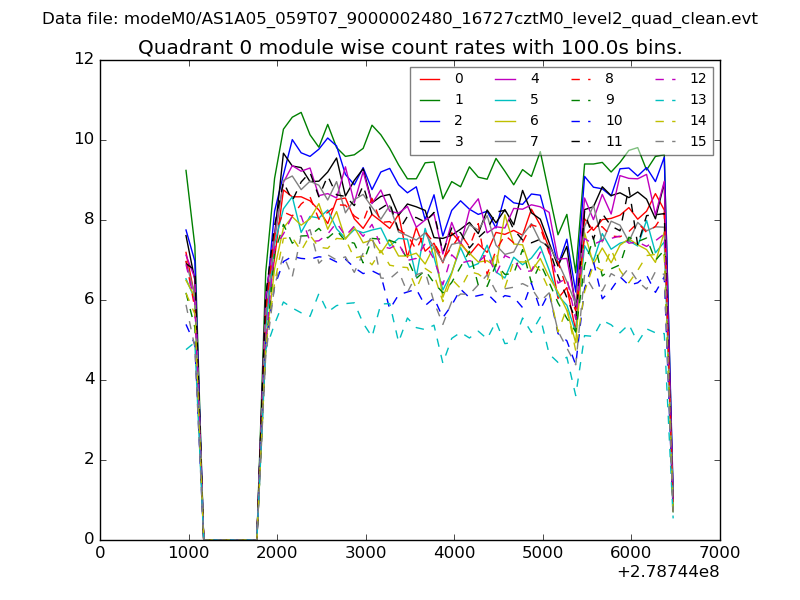 |
 |
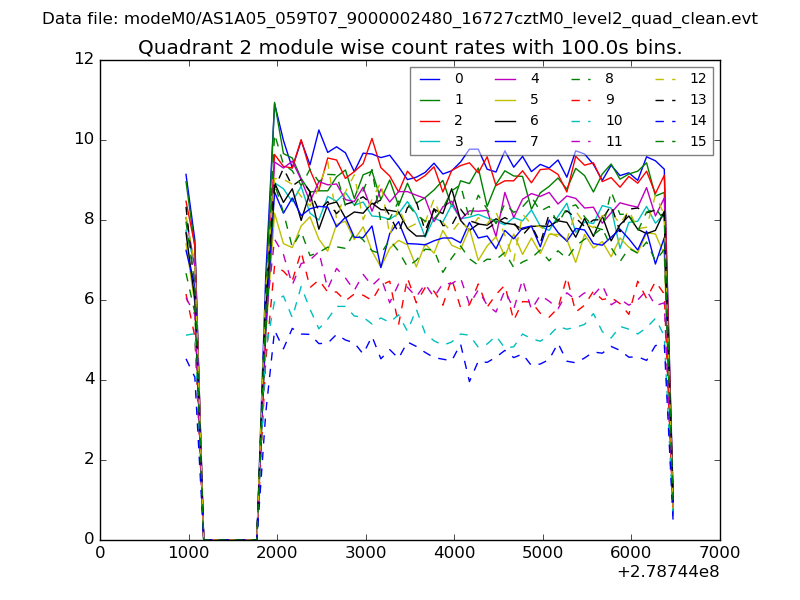
| Module-wise count rates for Quadrant B Data is divided into 100 sec bins |
 |
 |
| Module-wise count rates for Quadrant C Data is divided into 100 sec bins |
 |
 |
| Module-wise count rates for Quadrant D Data is divided into 100 sec bins |
 |
 |
| Parameter | Plot |
|---|---|
| CZT HV Monitor | 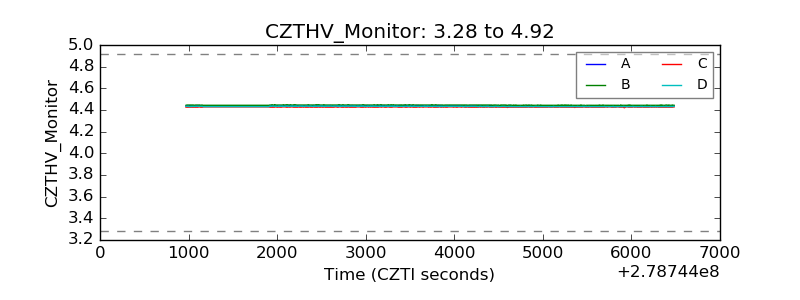 |
| D_VDD | 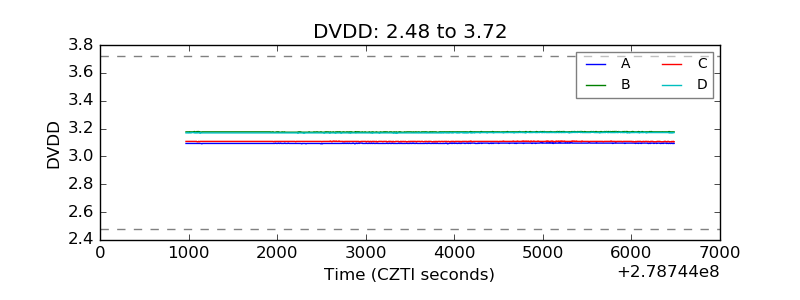 |
| Temperature 1 | 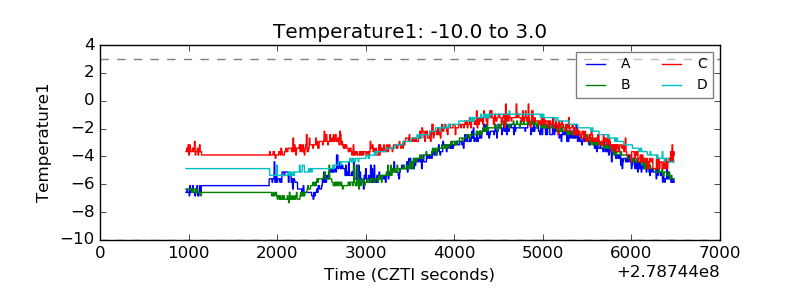 |
| Veto HV Monitor |  |
| Veto LLD | 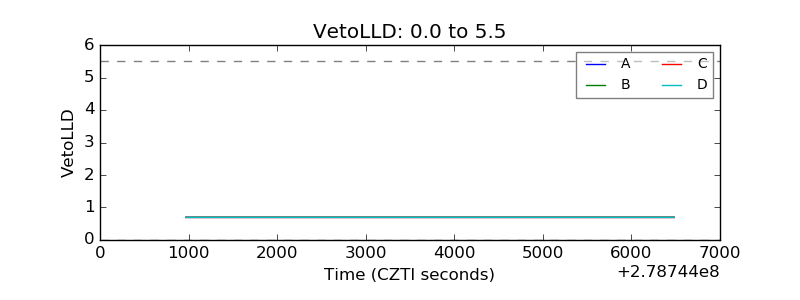 |
| Alpha Counter | 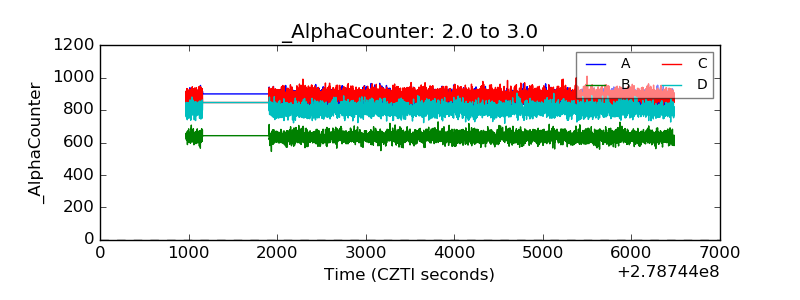 |
| _CPM_Rate | 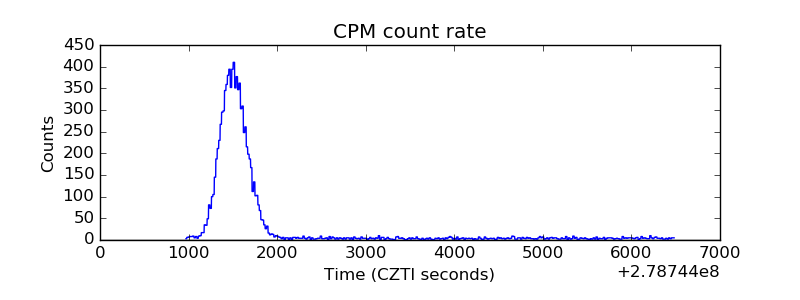 |
| CZT Counter | 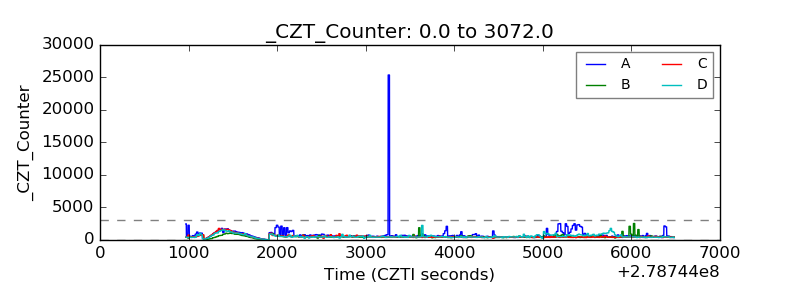 |
| +2.5 Volts monitor |  |
| +5 Volts monitor |  |
| _ROLL_ROT | 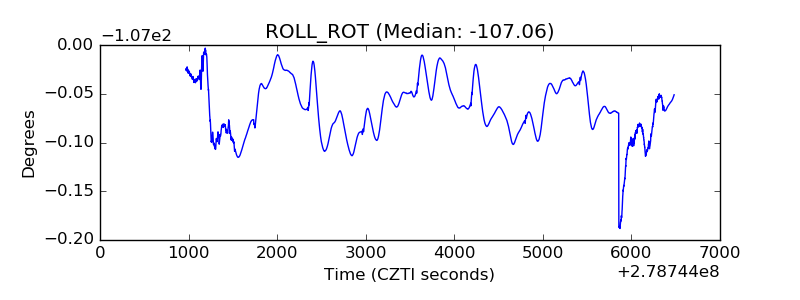 |
| _Roll_DEC | 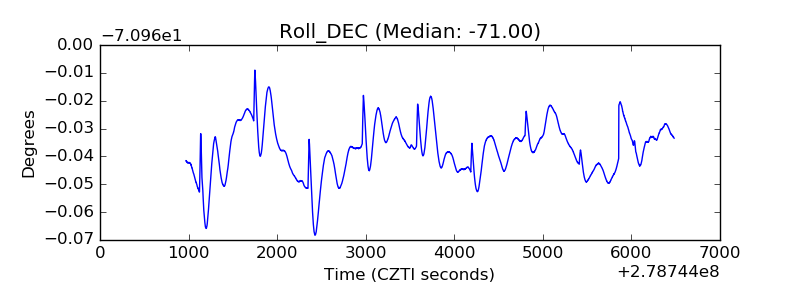 |
| _Roll_RA | 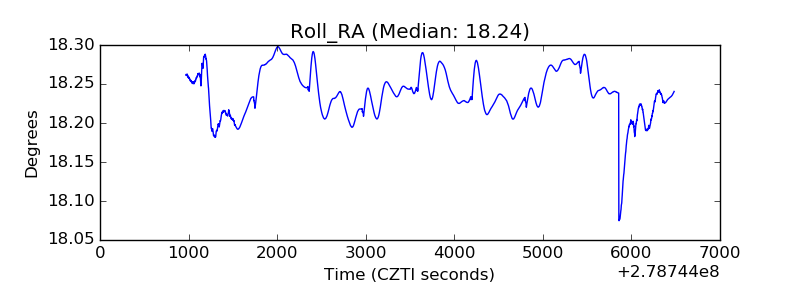 |
| Veto Counter | 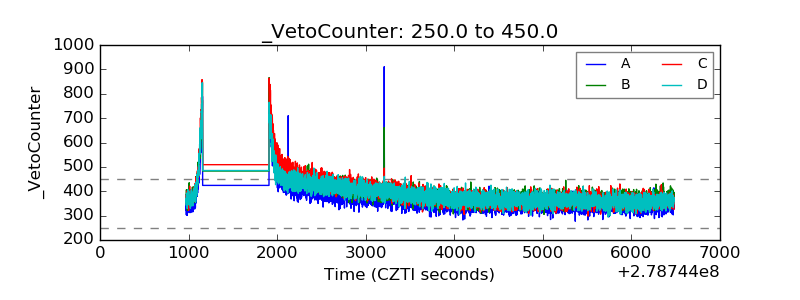 |