| Param | Original file | Final file |
|---|---|---|
| Filename | modeM0/AS1A05_101T07_9000002482cztM0_level2.fits | modeM0/AS1A05_101T07_9000002482cztM0_level2_quad_clean.evt |
| Size (bytes) | 102,231,360 | 113,106,240 |
| Size | 97.5 MB | 107.9 MB |
| Events in quadrant A | 615,454 | 668,987 |
| Events in quadrant B | 609,448 | 728,501 |
| Events in quadrant C | 618,224 | 705,521 |
| Events in quadrant D | 530,142 | 599,409 |
| Mode SS | |||
|---|---|---|---|
| Quadrant | BADHDUFLAG | Total packets | Discarded packets |
| A | 0 | 212 | 0 |
| B | 0 | 212 | 0 |
| C | 0 | 212 | 0 |
| D | 0 | 212 | 0 |
| Mode M9 | |||
|---|---|---|---|
| Quadrant | BADHDUFLAG | Total packets | Discarded packets |
| A | 0 | 21 | 0 |
| B | 0 | 21 | 0 |
| C | 0 | 21 | 0 |
| D | 0 | 21 | 0 |
| Mode M0 | |||
|---|---|---|---|
| Quadrant | BADHDUFLAG | Total packets | Discarded packets |
| A | 0 | 26124 | 0 |
| B | 0 | 22697 | 0 |
| C | 0 | 22505 | 0 |
| D | 0 | 31903 | 0 |
| Quadrant | Total seconds | Saturated seconds | Saturation percentage |
|---|---|---|---|
| A | 10433 | 699 | 6.699895% |
| B | 10433 | 132 | 1.265216% |
| C | 10433 | 161 | 1.543180% |
| D | 10433 | 753 | 7.217483% |
Noise dominated data is calculated using 1-second bins in cleaned event files. If a bin has >2000 counts, and if more than 50% of those come from <1% of pixels, then it is considered to be noise-dominated and hence unusable.
| Quadrant | # 1 sec bins | Bins with >0 counts | Bins with >2000 counts | High rate bins dominated by noise | Noise dominated (total time) | Noise dominated (detector-on time) | Marked lightcurve |
|---|---|---|---|---|---|---|---|
| A | 12483 | 10427 | 0 | 0 | 0.00% | 0.00% | 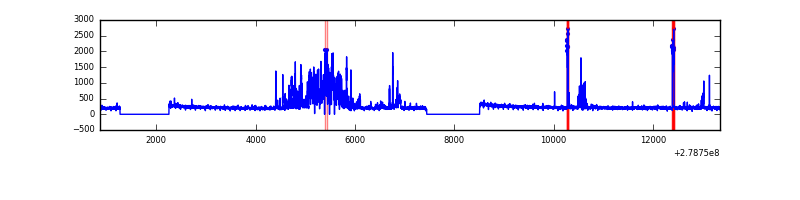 |
| B | 12483 | 10432 | 0 | 0 | 0.00% | 0.00% | 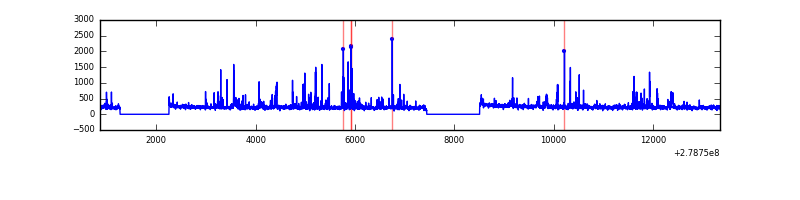 |
| C | 12483 | 10432 | 0 | 0 | 0.00% | 0.00% | 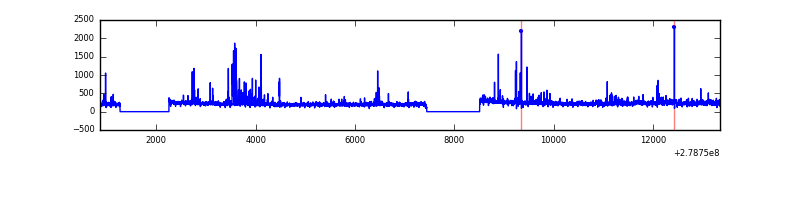 |
| D | 12483 | 10433 | 0 | 0 | 0.00% | 0.00% | 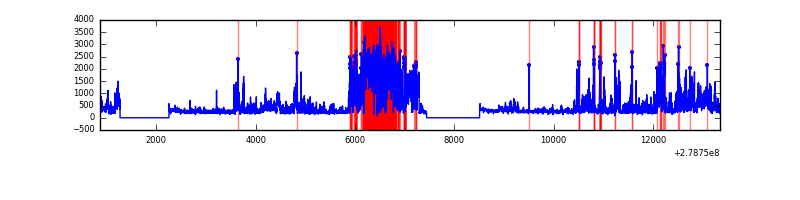 |
Top three noisy pixels from each quadrant. If the there are fewer than three noisy pixels in the level2.evt file, extra rows are filled as -1
| Pixel properties | Quadrant properties | ||||||
|---|---|---|---|---|---|---|---|
| Quadrant | DetID | PixID | Counts | Sigma | Mean | Median | Sigma |
| A | 0 | 29 | 608 | 11.19 | 160 | 151 | 40.8 |
| A | 7 | 110 | 485 | 8.18 | 160 | 151 | 40.8 |
| A | 0 | 30 | 476 | 7.96 | 160 | 151 | 40.8 |
| B | 3 | 80 | 456 | 8.93 | 161 | 154 | 33.8 |
| B | 2 | 9 | 449 | 8.72 | 161 | 154 | 33.8 |
| B | 2 | 8 | 430 | 8.16 | 161 | 154 | 33.8 |
| C | 3 | 126 | 474 | 7.4 | 163 | 153 | 43.4 |
| C | 1 | 81 | 473 | 7.38 | 163 | 153 | 43.4 |
| C | 1 | 80 | 461 | 7.1 | 163 | 153 | 43.4 |
| D | 10 | 189 | 381 | 5.75 | 151 | 137 | 42.4 |
| D | 6 | 231 | 381 | 5.75 | 151 | 137 | 42.4 |
| D | 3 | 14 | 379 | 5.7 | 151 | 137 | 42.4 |
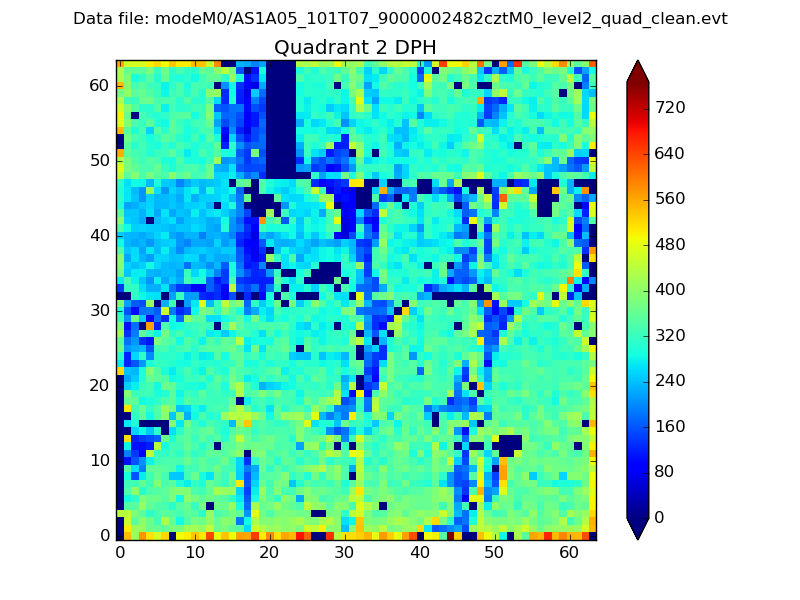
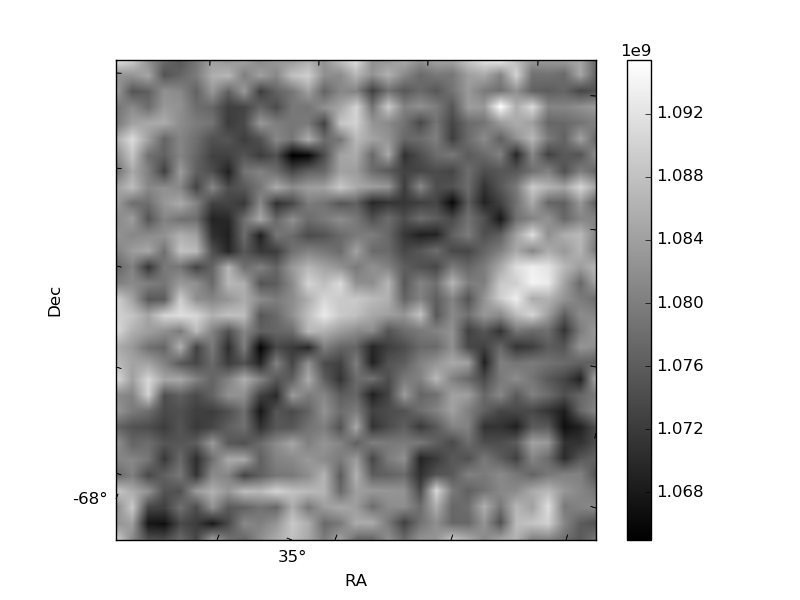
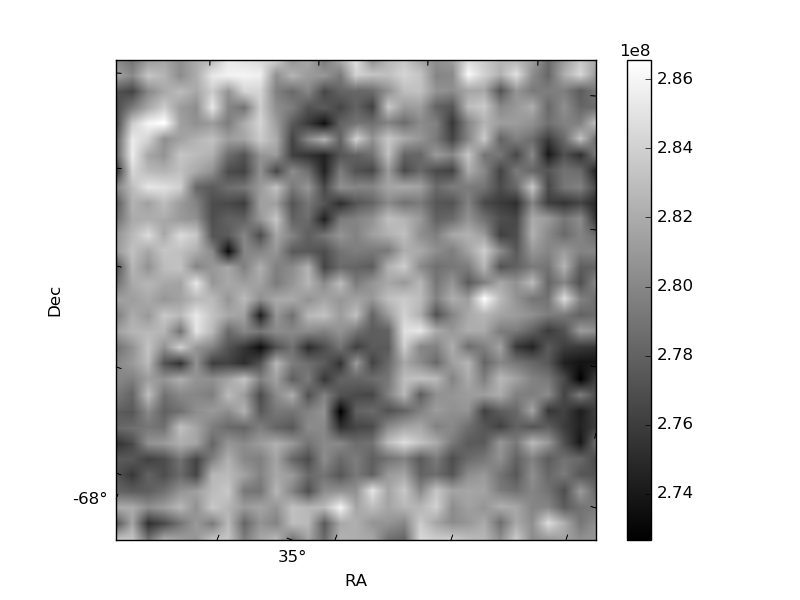
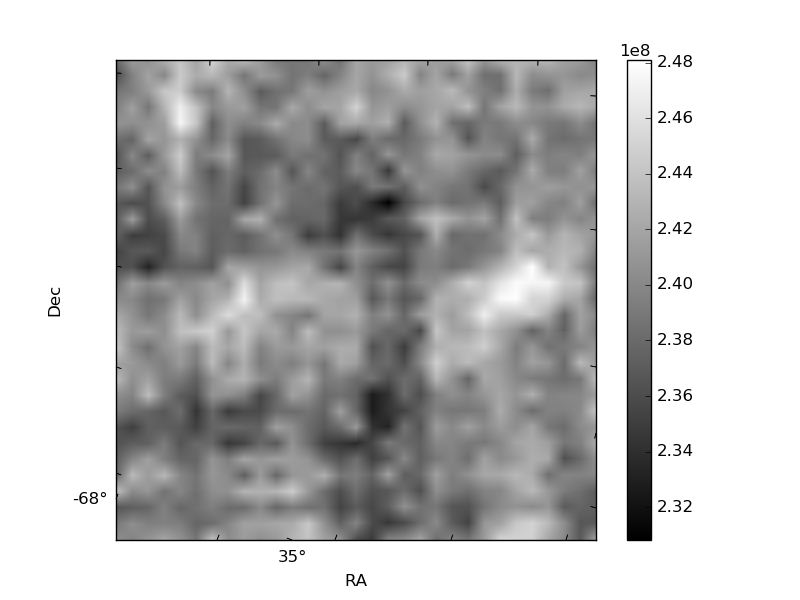
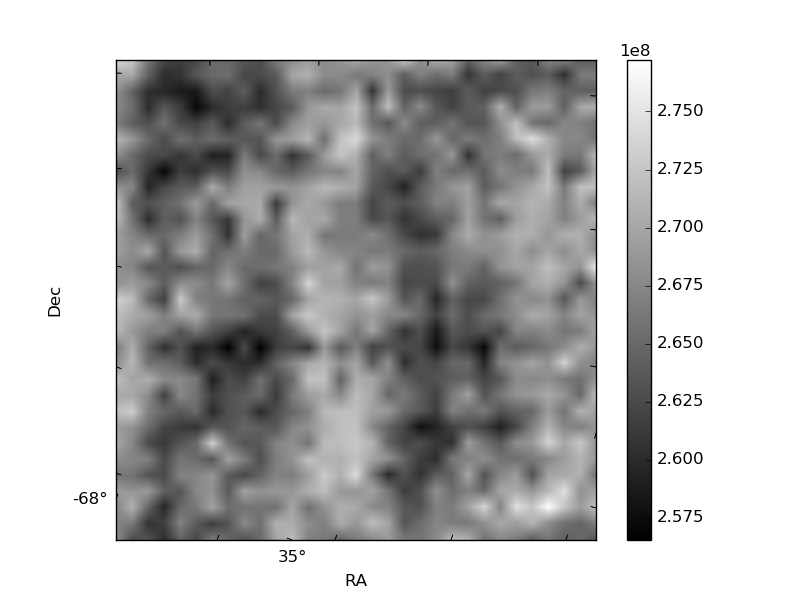
Histogram calculated using DETX and DETY for each event in the final _common_clean file
| Quadrant A | 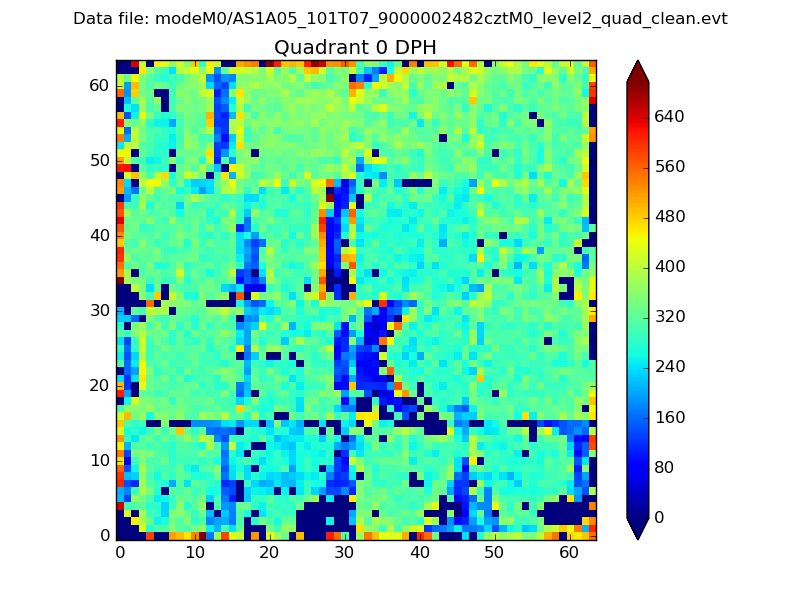 |
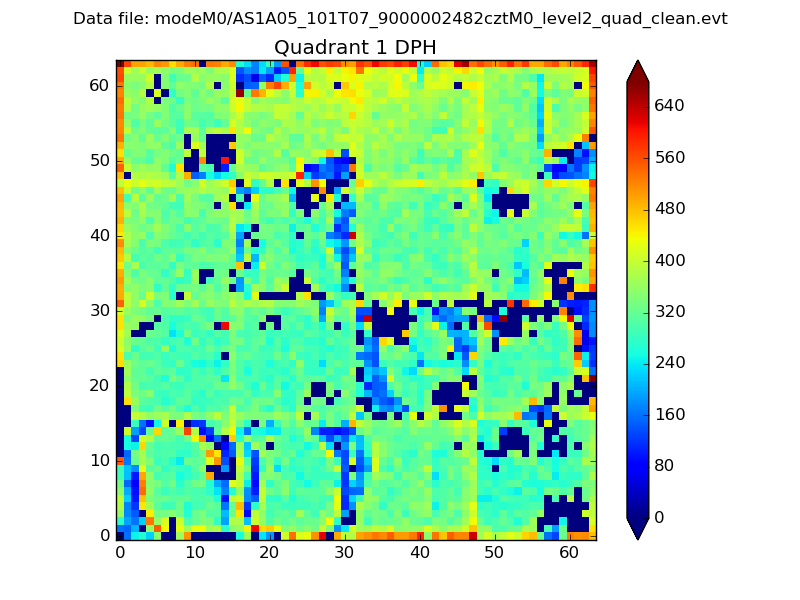 |
Quadrant B |
|---|---|---|---|
| Quadrant D | 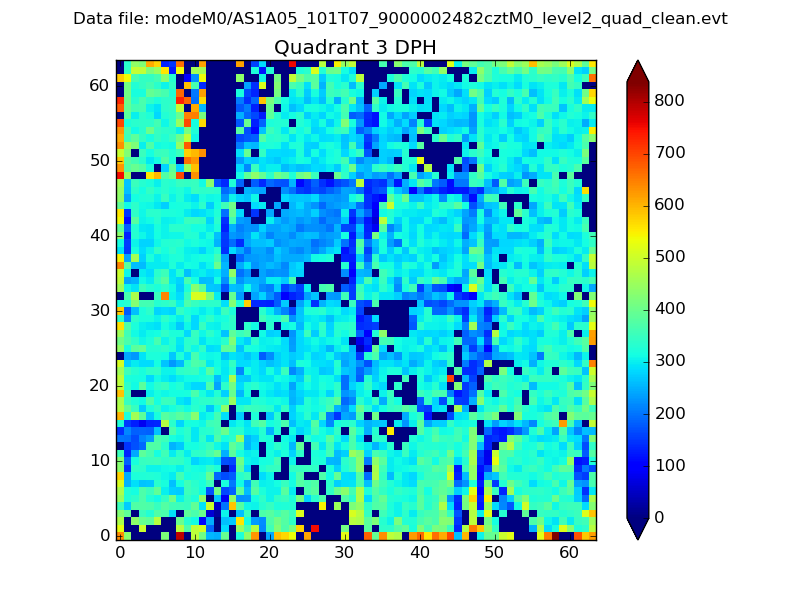 |
 |
Quadrant C |
| Plot type | Count rate plots | Images |
|---|---|---|
| Comparison with Poisson distribution Blue bars denote a histogram of data divided into 1 sec bins. Red curve is a Poisson curve with rate = median count rate of data. |
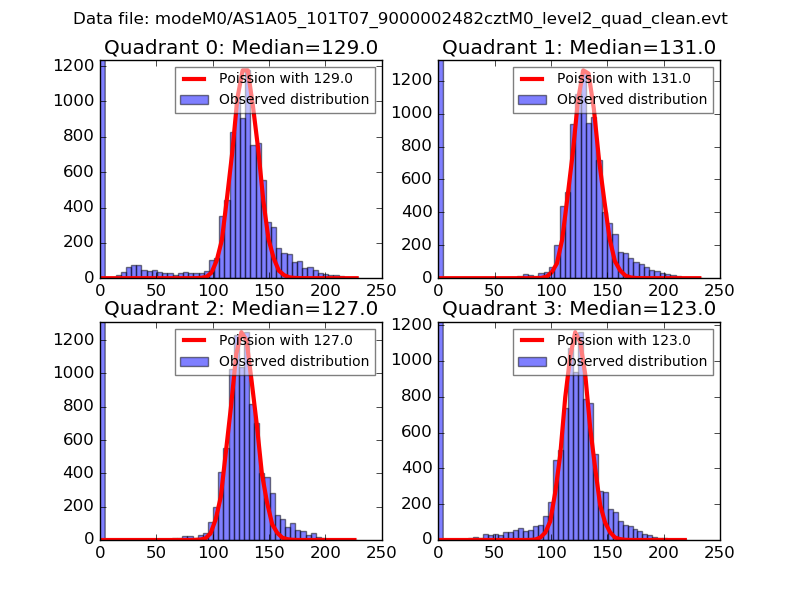 |
 |
| Quadrant-wise count rates Data is divided into 100 sec bins |
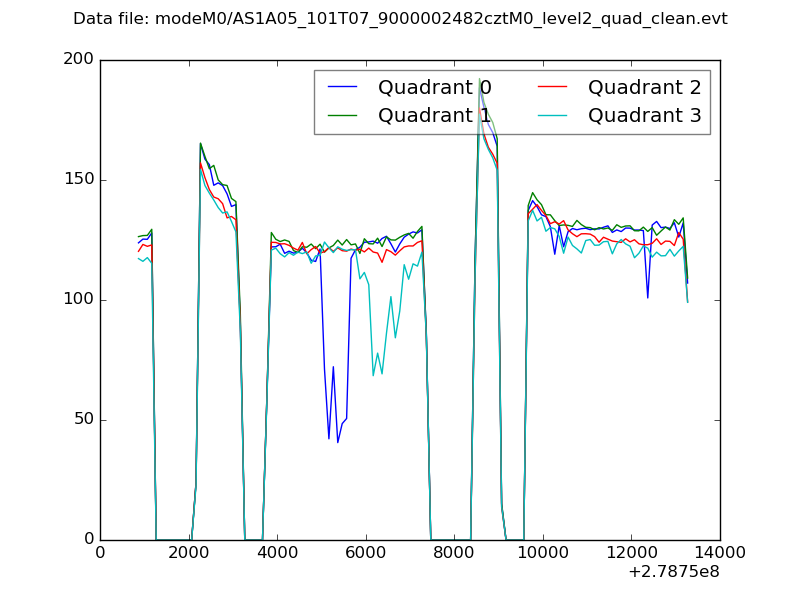 |
|
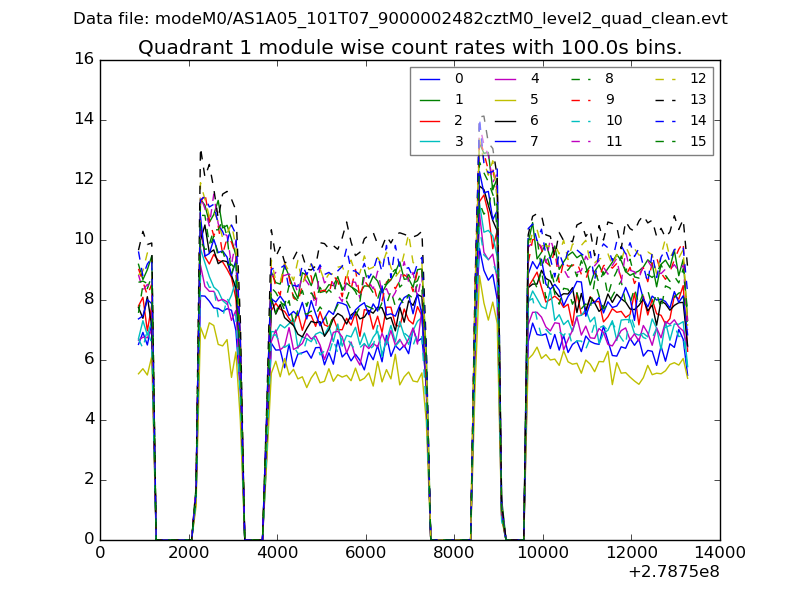
| Module-wise count rates for Quadrant A Data is divided into 100 sec bins |
 |
 |
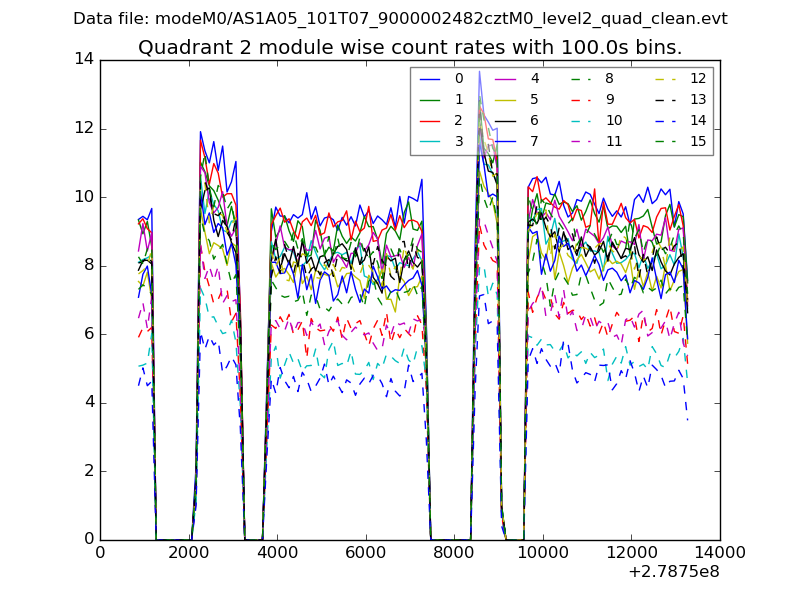
| Module-wise count rates for Quadrant B Data is divided into 100 sec bins |
 |
 |
| Module-wise count rates for Quadrant C Data is divided into 100 sec bins |
 |
 |
| Module-wise count rates for Quadrant D Data is divided into 100 sec bins |
 |
 |
| Parameter | Plot |
|---|---|
| CZT HV Monitor | 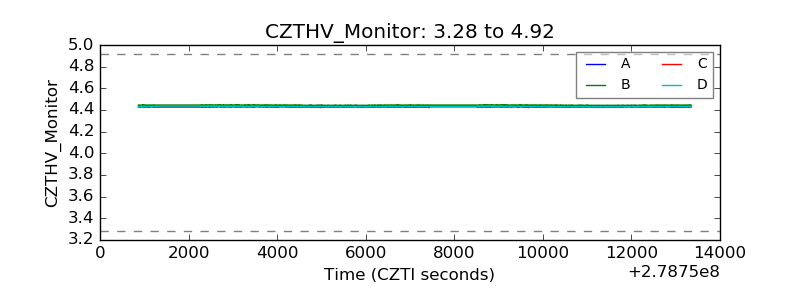 |
| D_VDD | 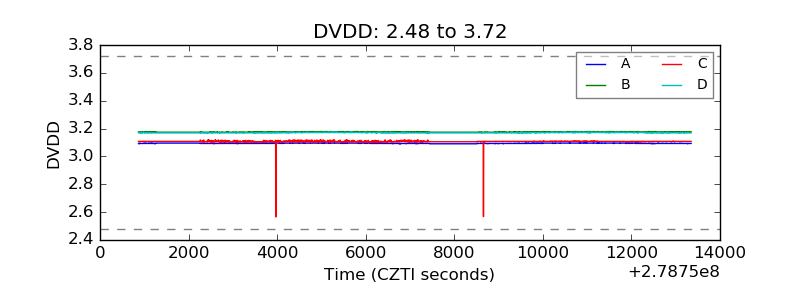 |
| Temperature 1 | 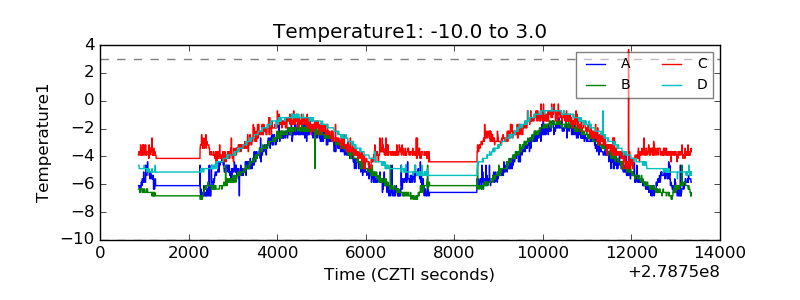 |
| Veto HV Monitor | 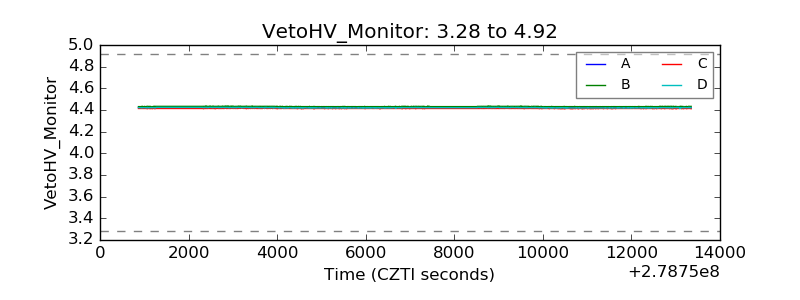 |
| Veto LLD |  |
| Alpha Counter | 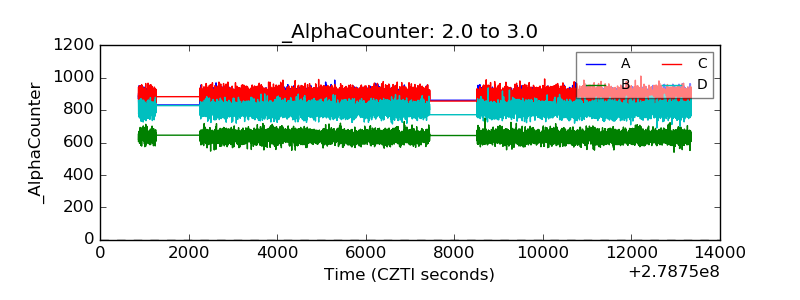 |
| _CPM_Rate | 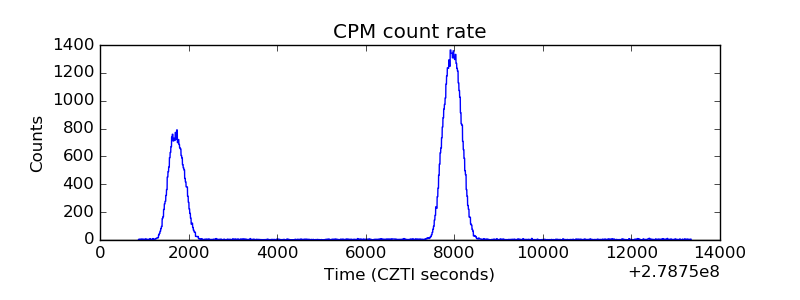 |
| CZT Counter | 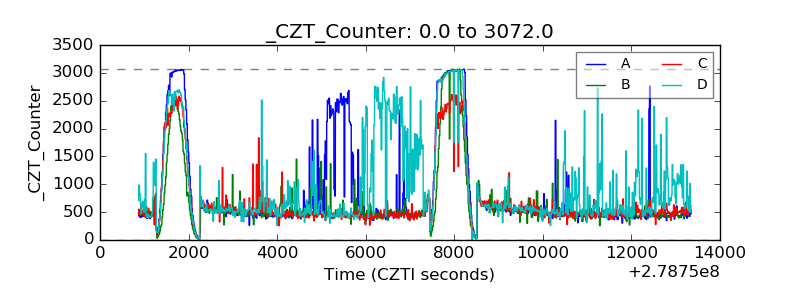 |
| +2.5 Volts monitor | 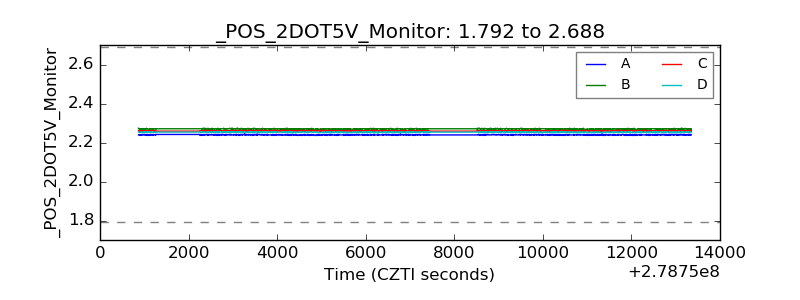 |
| +5 Volts monitor | 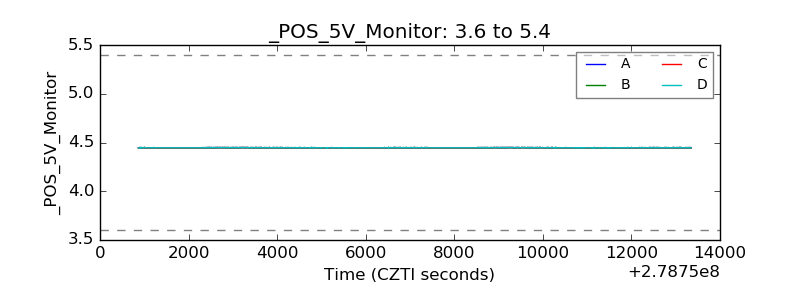 |
| _ROLL_ROT | 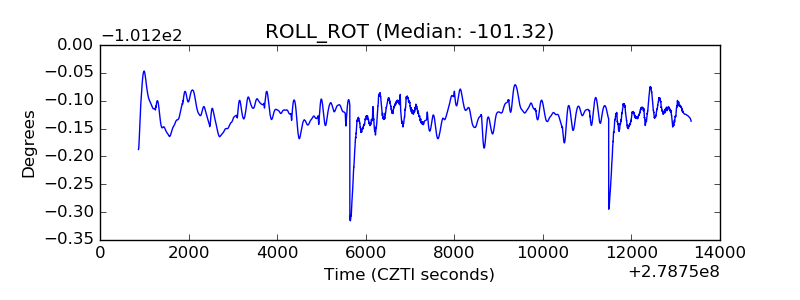 |
| _Roll_DEC | 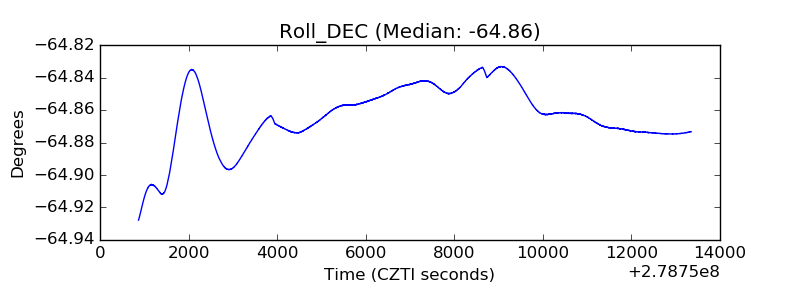 |
| _Roll_RA | 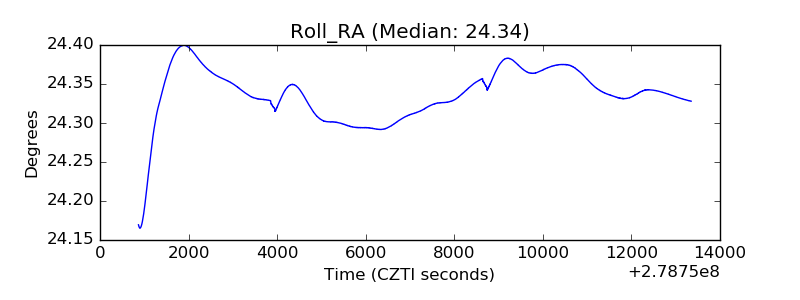 |
| Veto Counter |  |