| Param | Original file | Final file |
|---|---|---|
| Filename | modeM0/AS1A05_101T07_9000002482_16730cztM0_level2.evt | modeM0/AS1A05_101T07_9000002482_16730cztM0_level2_quad_clean.evt |
| Size (bytes) | 325,016,640 | 73,039,680 |
| Size | 310.0 MB | 69.7 MB |
| Events in quadrant A | 2,175,173 | 482,051 |
| Events in quadrant B | 2,189,520 | 491,624 |
| Events in quadrant C | 2,151,497 | 474,436 |
| Events in quadrant D | 3,033,843 | 460,815 |
| Mode SS | |||
|---|---|---|---|
| Quadrant | BADHDUFLAG | Total packets | Discarded packets |
| A | 0 | 86 | 0 |
| B | 0 | 86 | 0 |
| C | 0 | 86 | 0 |
| D | 0 | 86 | 0 |
| Mode M0 | |||
|---|---|---|---|
| Quadrant | BADHDUFLAG | Total packets | Discarded packets |
| A | 0 | 9236 | 0 |
| B | 0 | 9167 | 0 |
| C | 0 | 8963 | 0 |
| D | 0 | 11816 | 0 |
| Quadrant | Total seconds | Saturated seconds | Saturation percentage |
|---|---|---|---|
| A | 4301 | 62 | 1.441525% |
| B | 4301 | 14 | 0.325506% |
| C | 4301 | 26 | 0.604511% |
| D | 4301 | 71 | 1.650779% |
Noise dominated data is calculated using 1-second bins in cleaned event files. If a bin has >2000 counts, and if more than 50% of those come from <1% of pixels, then it is considered to be noise-dominated and hence unusable.
| Quadrant | # 1 sec bins | Bins with >0 counts | Bins with >2000 counts | High rate bins dominated by noise | Noise dominated (total time) | Noise dominated (detector-on time) | Marked lightcurve |
|---|---|---|---|---|---|---|---|
| A | 4302 | 4302 | 55 | 55 | 1.28% | 1.28% | 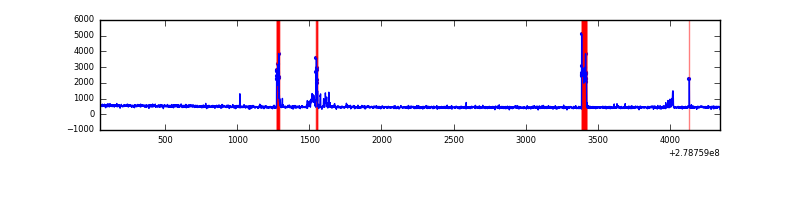 |
| B | 4302 | 4302 | 4 | 4 | 0.09% | 0.09% | 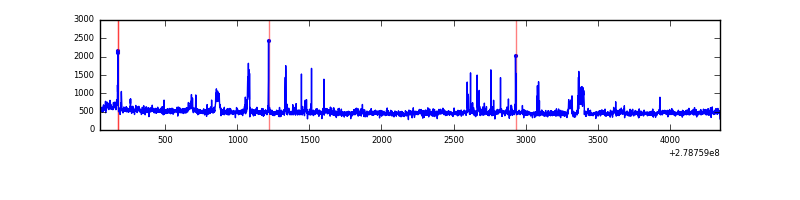 |
| C | 4302 | 4302 | 5 | 5 | 0.12% | 0.12% | 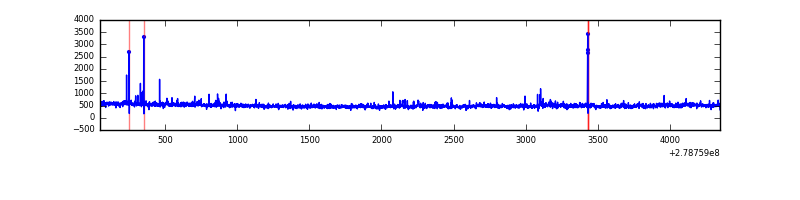 |
| D | 4302 | 4302 | 82 | 82 | 1.91% | 1.91% | 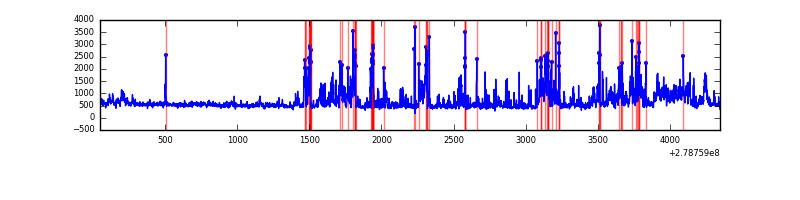 |
Top three noisy pixels from each quadrant. If the there are fewer than three noisy pixels in the level2.evt file, extra rows are filled as -1
| Pixel properties | Quadrant properties | ||||||
|---|---|---|---|---|---|---|---|
| Quadrant | DetID | PixID | Counts | Sigma | Mean | Median | Sigma |
| A | 15 | 174 | 217082 | 2107.43 | 507 | 498 | 102.8 |
| A | 3 | 1 | 5326 | 46.98 | 507 | 498 | 102.8 |
| A | 0 | 226 | 4404 | 38.01 | 507 | 498 | 102.8 |
| B | 15 | 35 | 96532 | 1010.28 | 510 | 498 | 95.1 |
| B | 0 | 229 | 27003 | 278.83 | 510 | 498 | 95.1 |
| B | 0 | 197 | 18033 | 184.47 | 510 | 498 | 95.1 |
| C | 3 | 233 | 96046 | 845.38 | 486 | 489 | 113.0 |
| C | 14 | 238 | 77864 | 684.52 | 486 | 489 | 113.0 |
| C | 0 | 207 | 61740 | 541.88 | 486 | 489 | 113.0 |
| D | 12 | 110 | 454842 | 3810.57 | 491 | 478 | 119.2 |
| D | 1 | 52 | 255558 | 2139.25 | 491 | 478 | 119.2 |
| D | 10 | 70 | 139722 | 1167.78 | 491 | 478 | 119.2 |
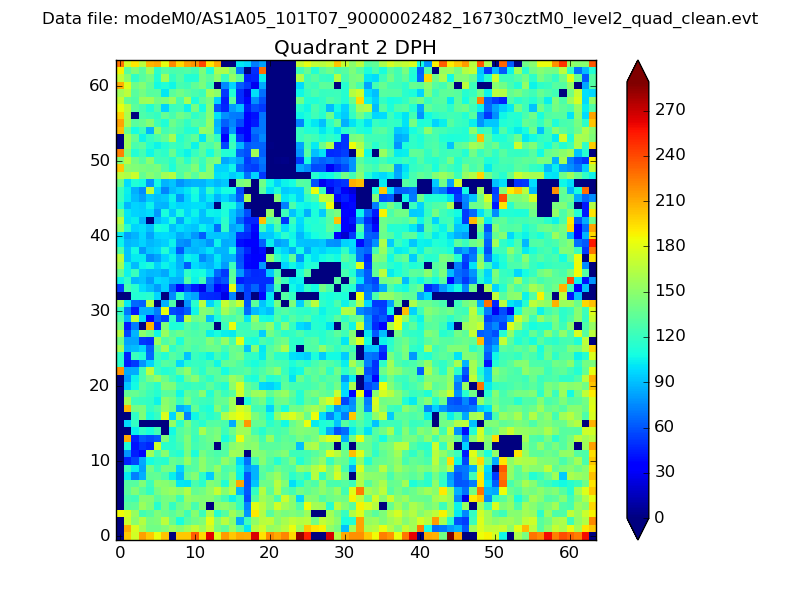
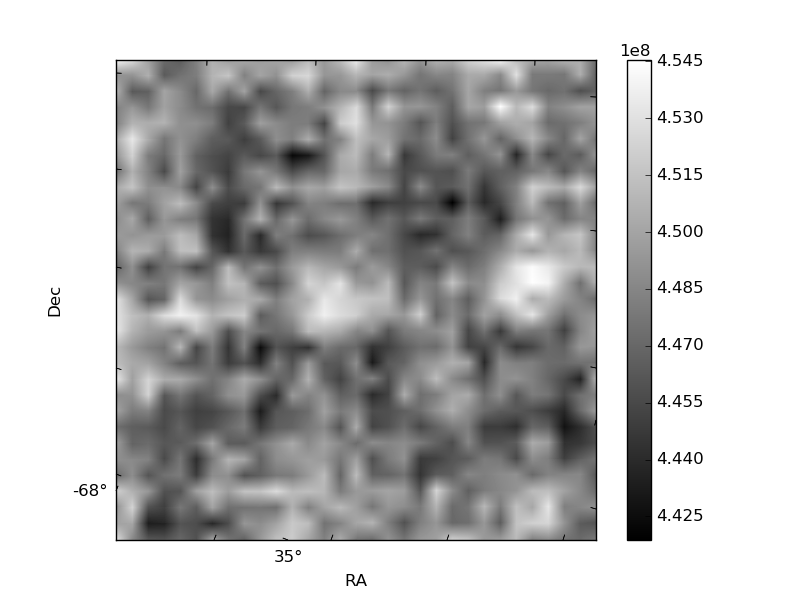
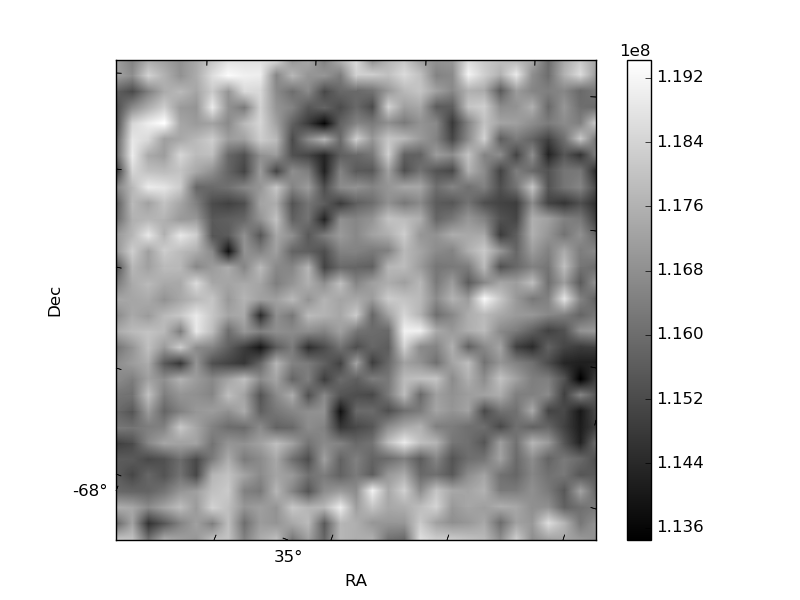
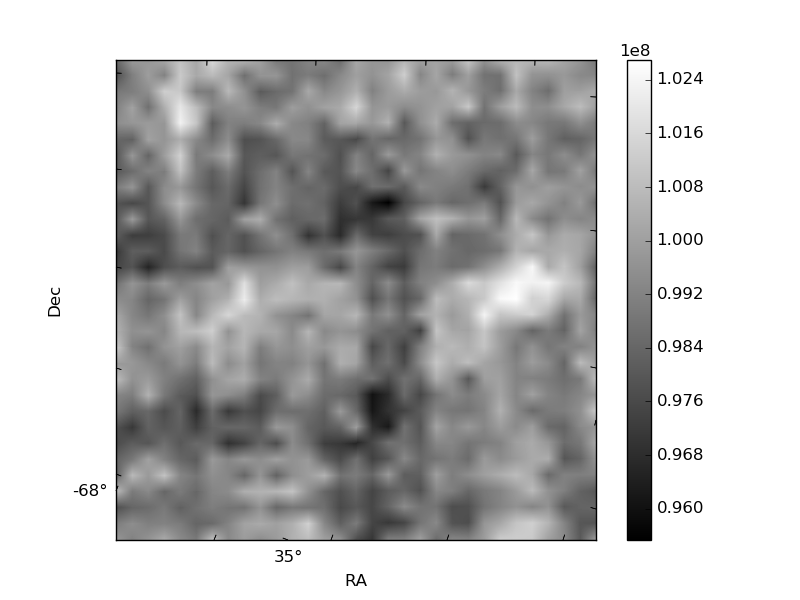
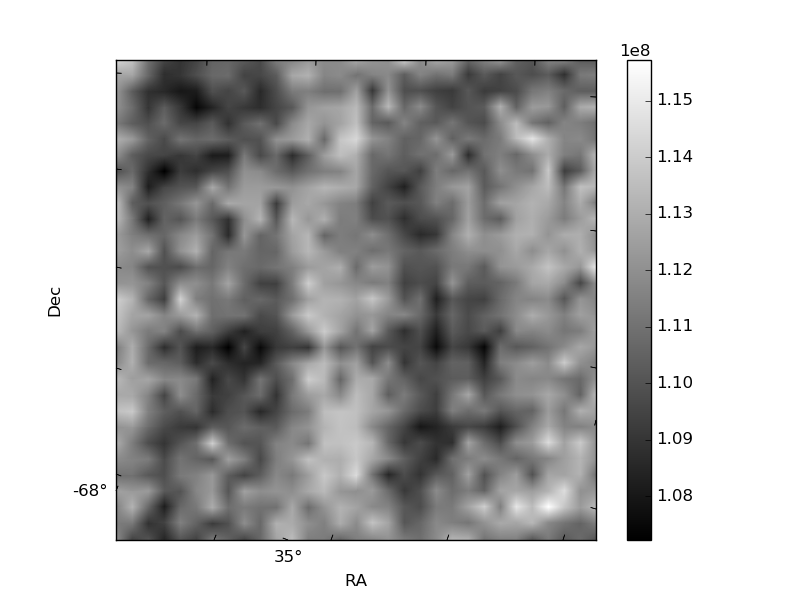
Histogram calculated using DETX and DETY for each event in the final _common_clean file
| Quadrant A | 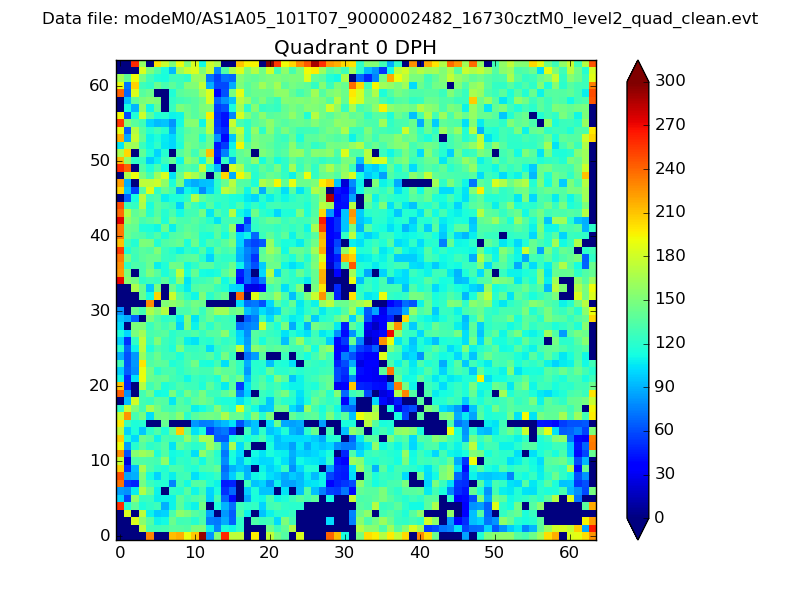 |
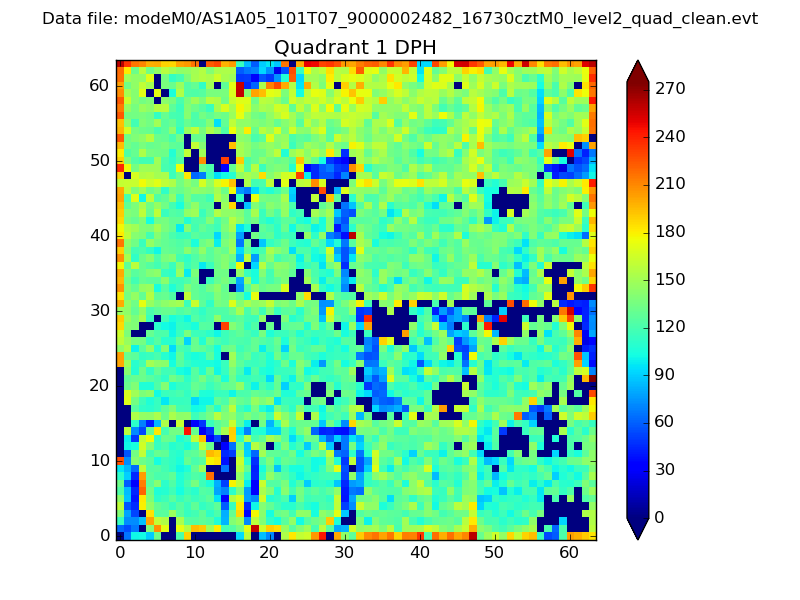 |
Quadrant B |
|---|---|---|---|
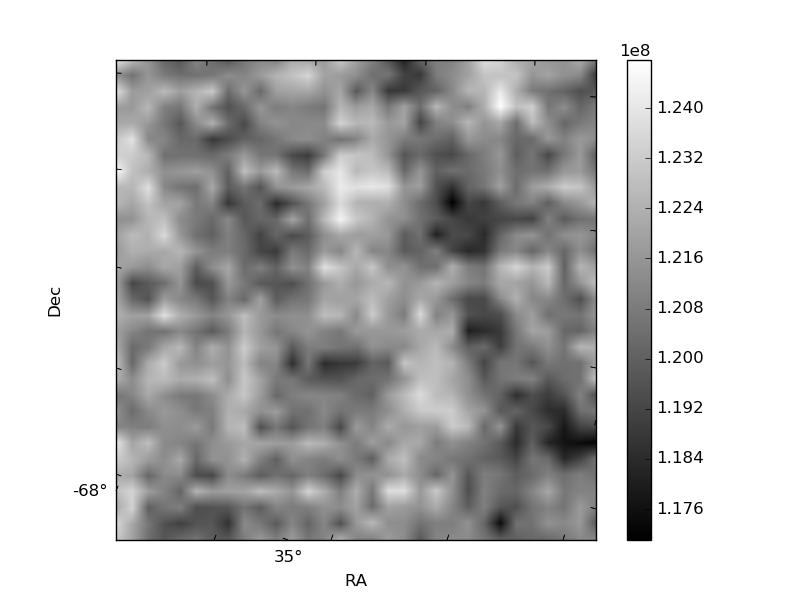
| Quadrant D | 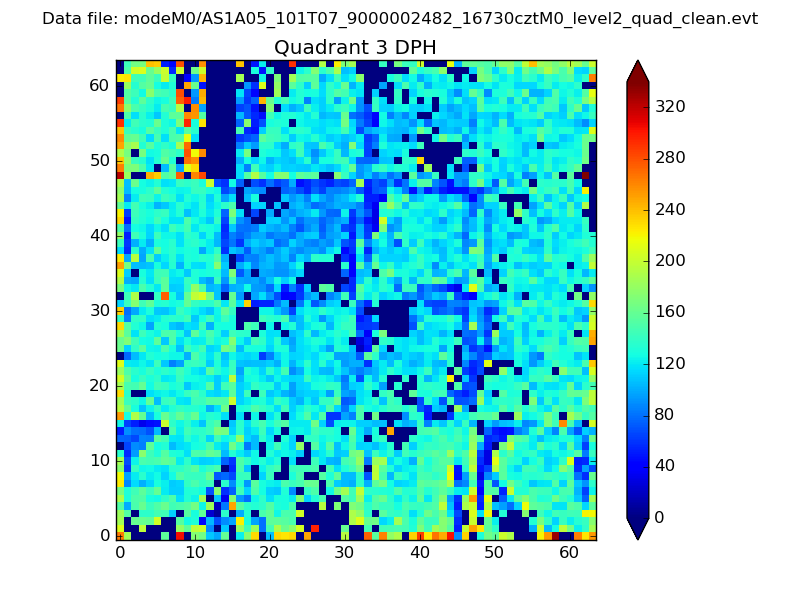 |
 |
Quadrant C |
| Plot type | Count rate plots | Images |
|---|---|---|
| Comparison with Poisson distribution Blue bars denote a histogram of data divided into 1 sec bins. Red curve is a Poisson curve with rate = median count rate of data. |
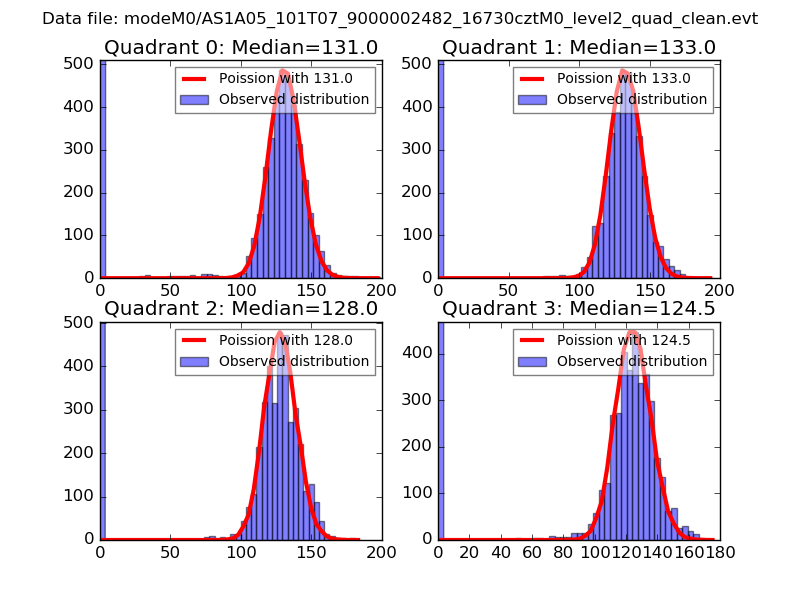 |
 |
| Quadrant-wise count rates Data is divided into 100 sec bins |
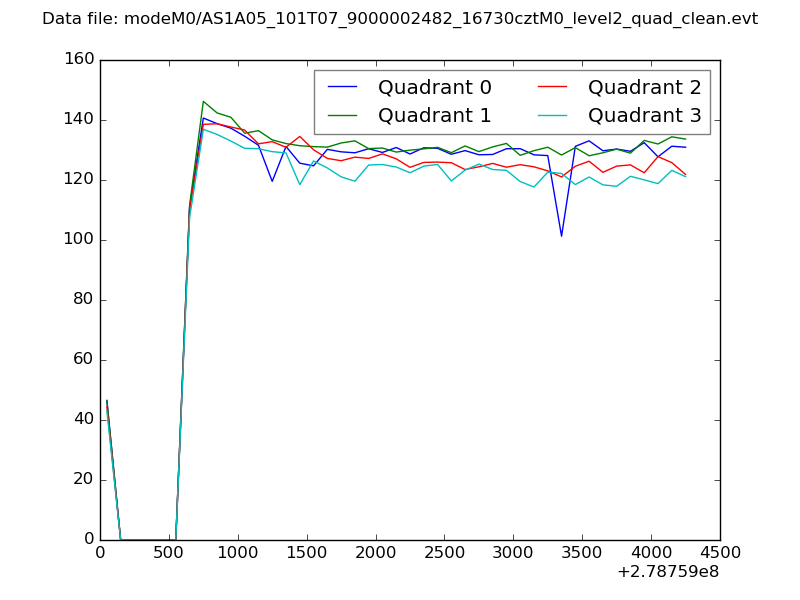 |
|
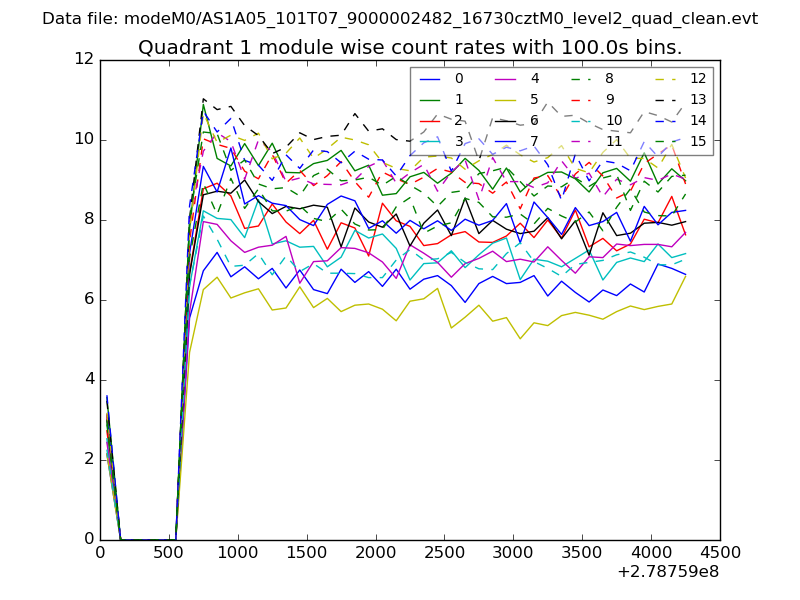
| Module-wise count rates for Quadrant A Data is divided into 100 sec bins |
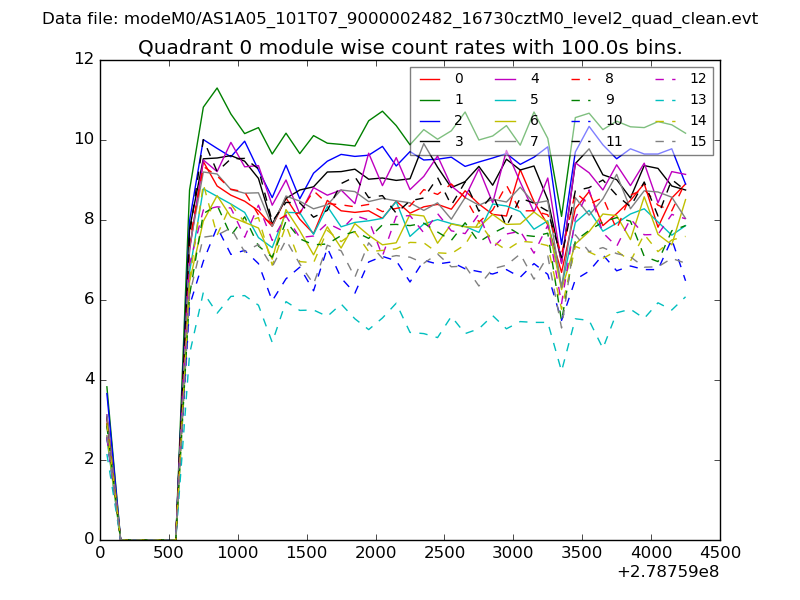 |
 |
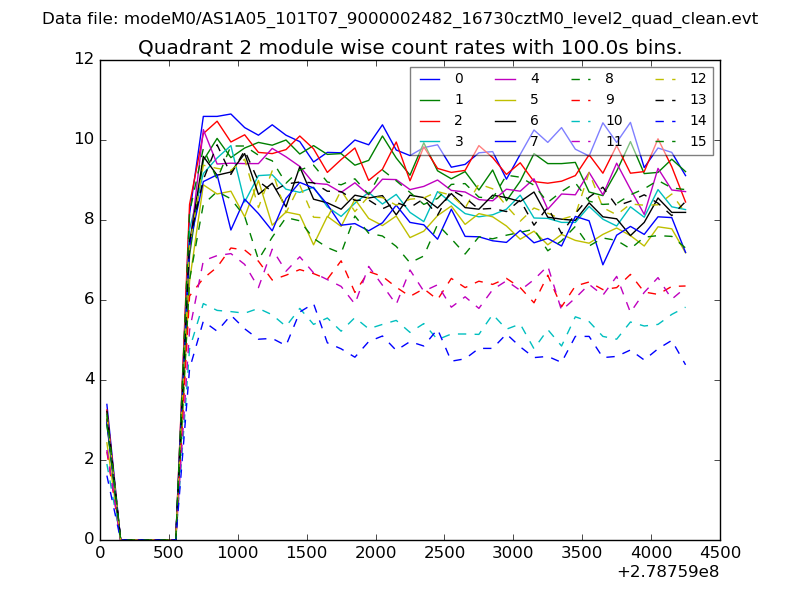
| Module-wise count rates for Quadrant B Data is divided into 100 sec bins |
 |
 |
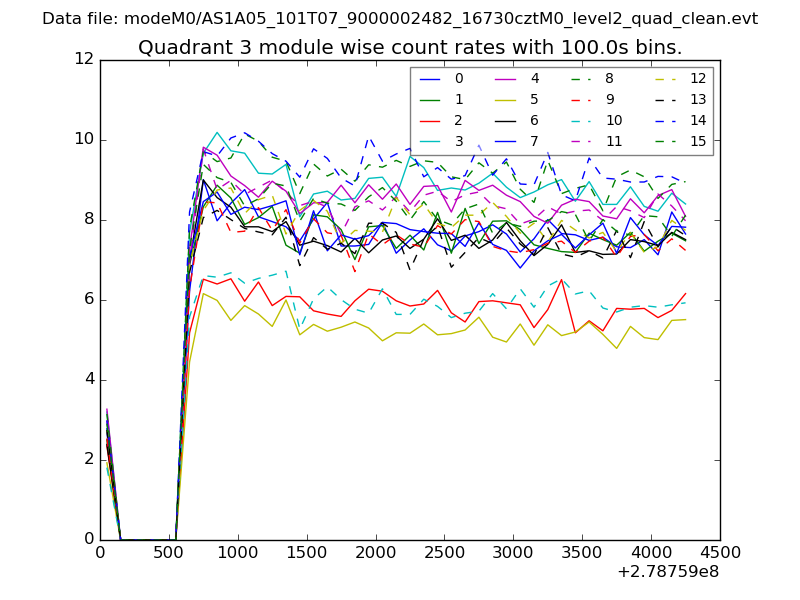
| Module-wise count rates for Quadrant C Data is divided into 100 sec bins |
 |
 |
| Module-wise count rates for Quadrant D Data is divided into 100 sec bins |
 |
 |
| Parameter | Plot |
|---|---|
| CZT HV Monitor | 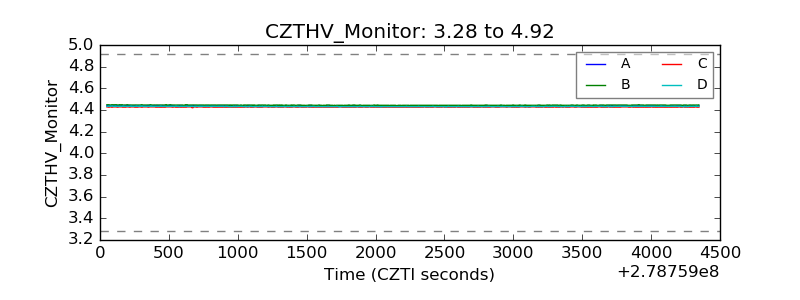 |
| D_VDD | 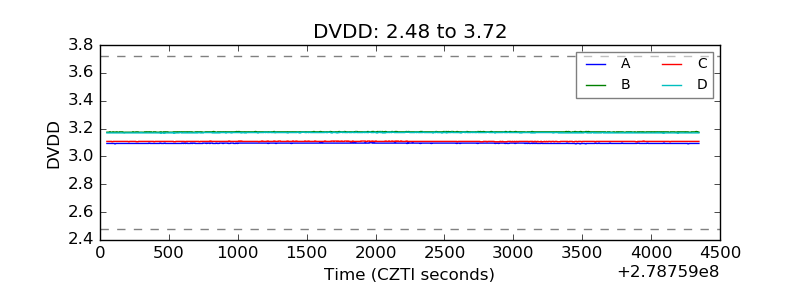 |
| Temperature 1 | 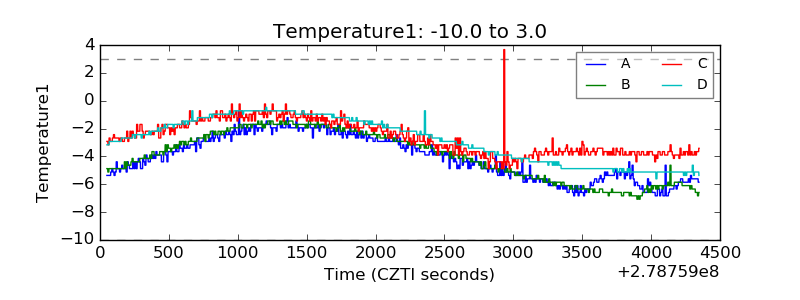 |
| Veto HV Monitor | 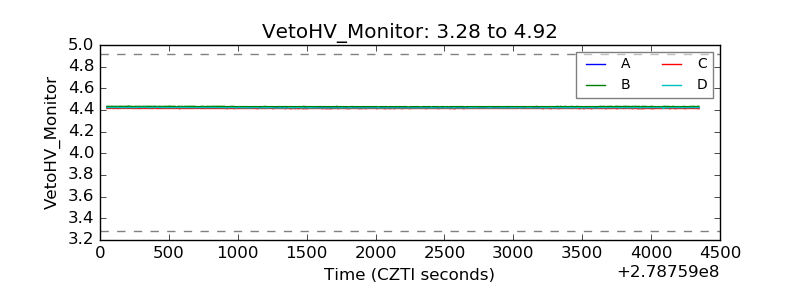 |
| Veto LLD | 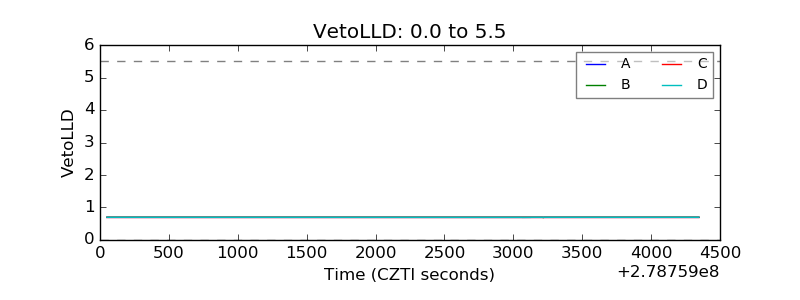 |
| Alpha Counter | 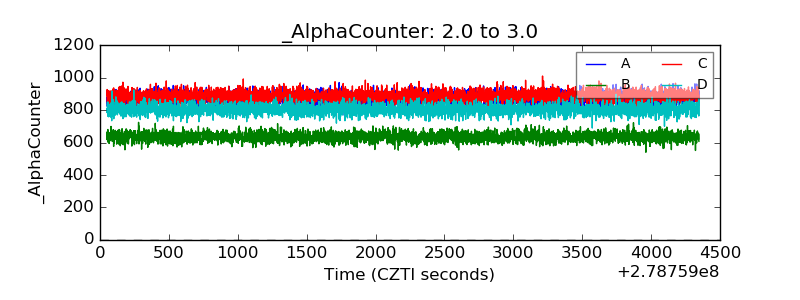 |
| _CPM_Rate | 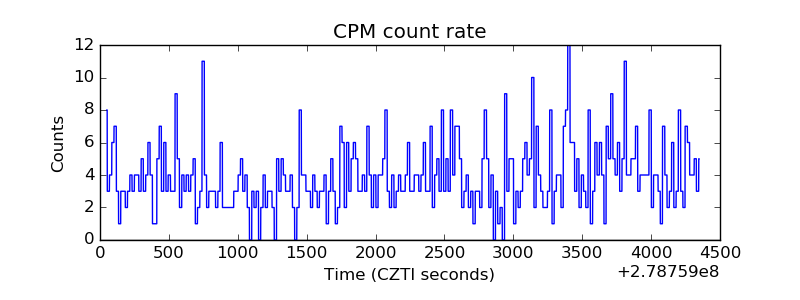 |
| CZT Counter | 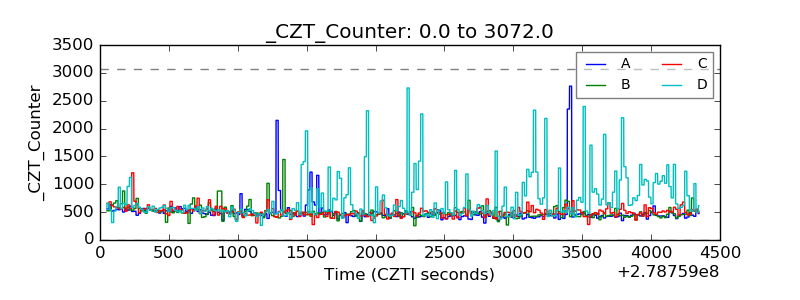 |
| +2.5 Volts monitor |  |
| +5 Volts monitor | 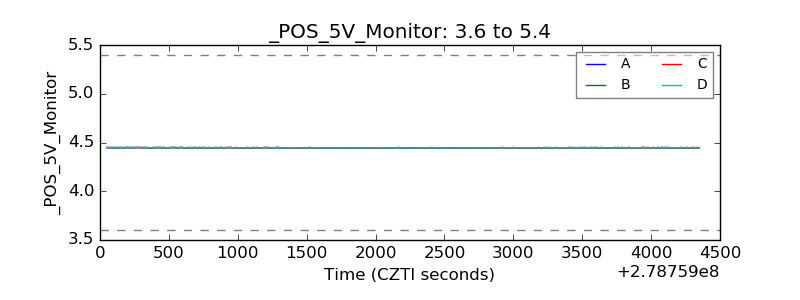 |
| _ROLL_ROT | 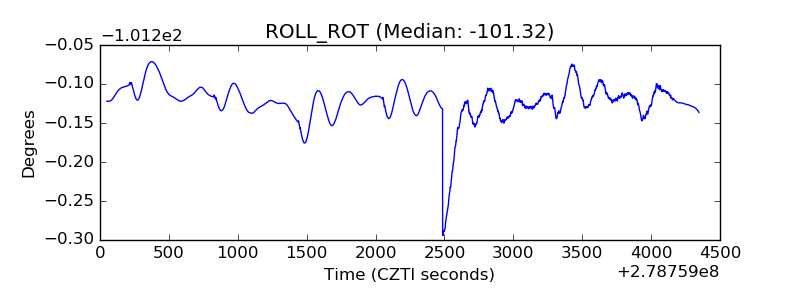 |
| _Roll_DEC |  |
| _Roll_RA | 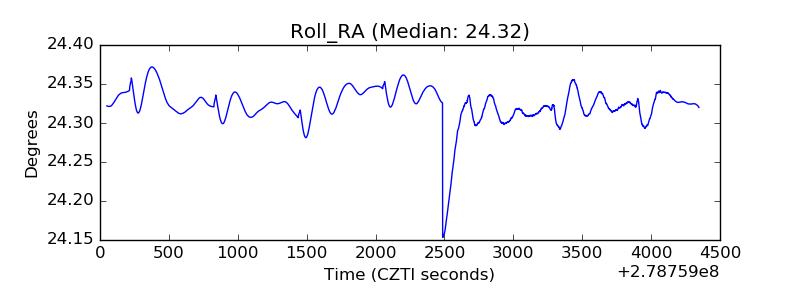 |
| Veto Counter | 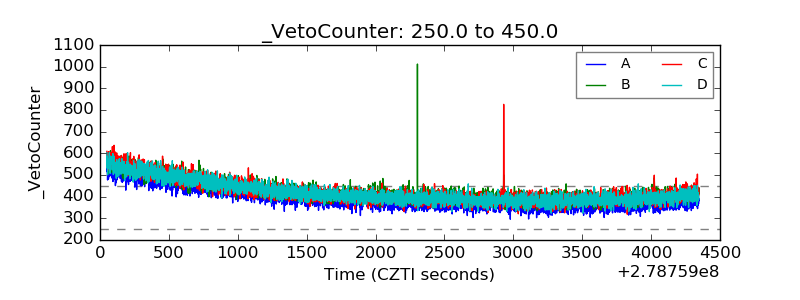 |