| Param | Original file | Final file |
|---|---|---|
| Filename | modeM0/AS1A05_202T01_9000002484_16730cztM0_level2.evt | modeM0/AS1A05_202T01_9000002484_16730cztM0_level2_quad_clean.evt |
| Size (bytes) | 113,172,480 | 23,302,080 |
| Size | 107.9 MB | 22.2 MB |
| Events in quadrant A | 780,880 | 156,300 |
| Events in quadrant B | 822,096 | 159,789 |
| Events in quadrant C | 812,844 | 148,664 |
| Events in quadrant D | 923,111 | 145,448 |
| Mode M0 | |||
|---|---|---|---|
| Quadrant | BADHDUFLAG | Total packets | Discarded packets |
| A | 0 | 3193 | 1 |
| B | 0 | 3340 | 0 |
| C | 0 | 3396 | 0 |
| D | 0 | 3748 | 0 |
| Mode M9 | |||
|---|---|---|---|
| Quadrant | BADHDUFLAG | Total packets | Discarded packets |
| A | 0 | 10 | 0 |
| B | 0 | 10 | 0 |
| C | 0 | 10 | 0 |
| D | 0 | 10 | 0 |
| Mode SS | |||
|---|---|---|---|
| Quadrant | BADHDUFLAG | Total packets | Discarded packets |
| A | 0 | 24 | 0 |
| B | 0 | 24 | 0 |
| C | 0 | 24 | 0 |
| D | 0 | 24 | 0 |
| Quadrant | Total seconds | Saturated seconds | Saturation percentage |
|---|---|---|---|
| A | 1268 | 8 | 0.630915% |
| B | 1268 | 16 | 1.261830% |
| C | 1268 | 35 | 2.760252% |
| D | 1268 | 15 | 1.182965% |
Noise dominated data is calculated using 1-second bins in cleaned event files. If a bin has >2000 counts, and if more than 50% of those come from <1% of pixels, then it is considered to be noise-dominated and hence unusable.
| Quadrant | # 1 sec bins | Bins with >0 counts | Bins with >2000 counts | High rate bins dominated by noise | Noise dominated (total time) | Noise dominated (detector-on time) | Marked lightcurve |
|---|---|---|---|---|---|---|---|
| A | 1269 | 1269 | 1 | 1 | 0.08% | 0.08% | 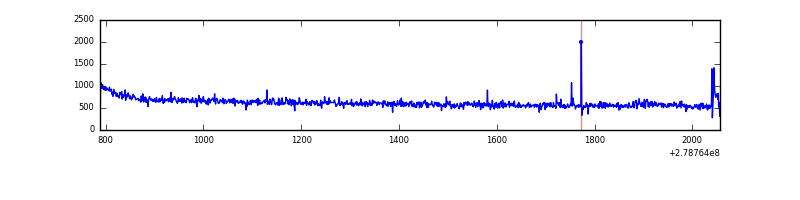 |
| B | 1269 | 1269 | 0 | 0 | 0.00% | 0.00% | 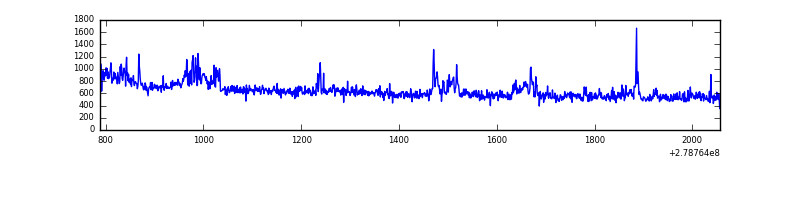 |
| C | 1269 | 1269 | 0 | 0 | 0.00% | 0.00% | 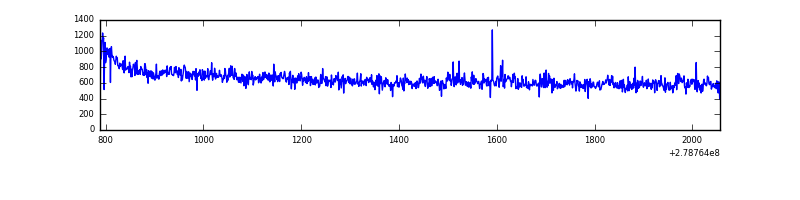 |
| D | 1269 | 1269 | 2 | 2 | 0.16% | 0.16% | 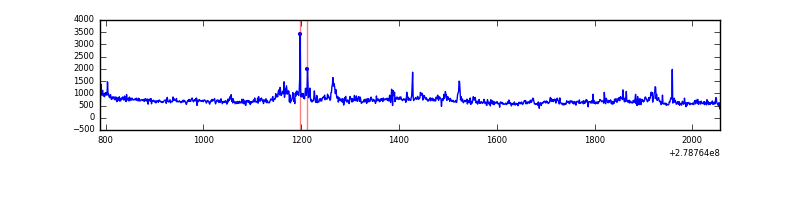 |
Top three noisy pixels from each quadrant. If the there are fewer than three noisy pixels in the level2.evt file, extra rows are filled as -1
| Pixel properties | Quadrant properties | ||||||
|---|---|---|---|---|---|---|---|
| Quadrant | DetID | PixID | Counts | Sigma | Mean | Median | Sigma |
| A | 15 | 174 | 12582 | 305.51 | 199 | 195 | 40.5 |
| A | 0 | 226 | 1836 | 40.47 | 199 | 195 | 40.5 |
| A | 3 | 1 | 1795 | 39.46 | 199 | 195 | 40.5 |
| B | 15 | 35 | 29270 | 773.2 | 194 | 190 | 37.6 |
| B | 10 | 16 | 12885 | 337.55 | 194 | 190 | 37.6 |
| B | 5 | 236 | 7873 | 204.28 | 194 | 190 | 37.6 |
| C | 3 | 233 | 33749 | 759.32 | 188 | 189 | 44.2 |
| C | 14 | 238 | 30367 | 682.8 | 188 | 189 | 44.2 |
| C | 0 | 207 | 12265 | 273.23 | 188 | 189 | 44.2 |
| D | 2 | 16 | 82267 | 1718.93 | 194 | 189 | 47.7 |
| D | 1 | 52 | 34261 | 713.56 | 194 | 189 | 47.7 |
| D | 11 | 176 | 22261 | 462.24 | 194 | 189 | 47.7 |
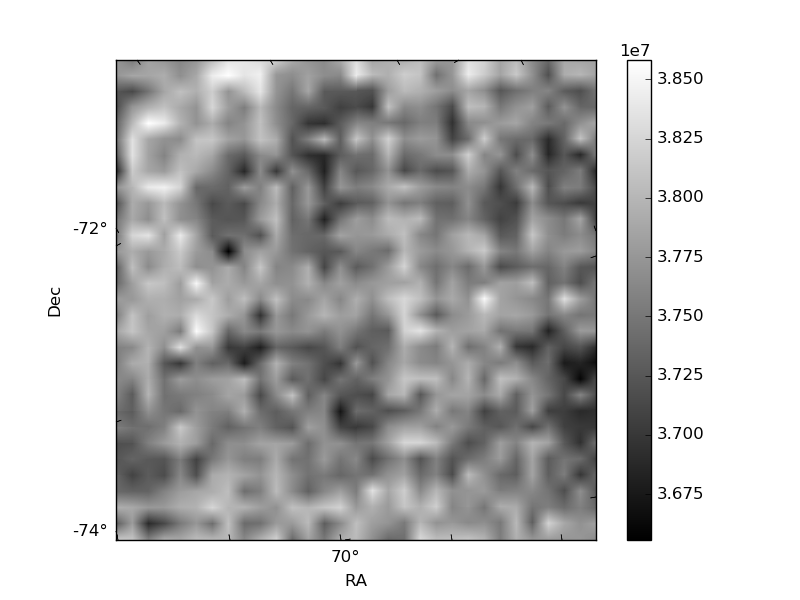
Histogram calculated using DETX and DETY for each event in the final _common_clean file
| Quadrant A | 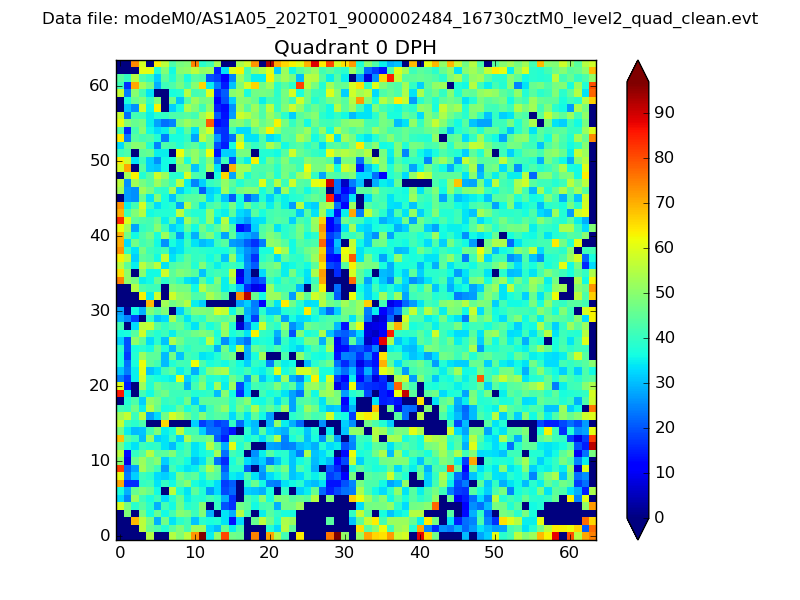 |
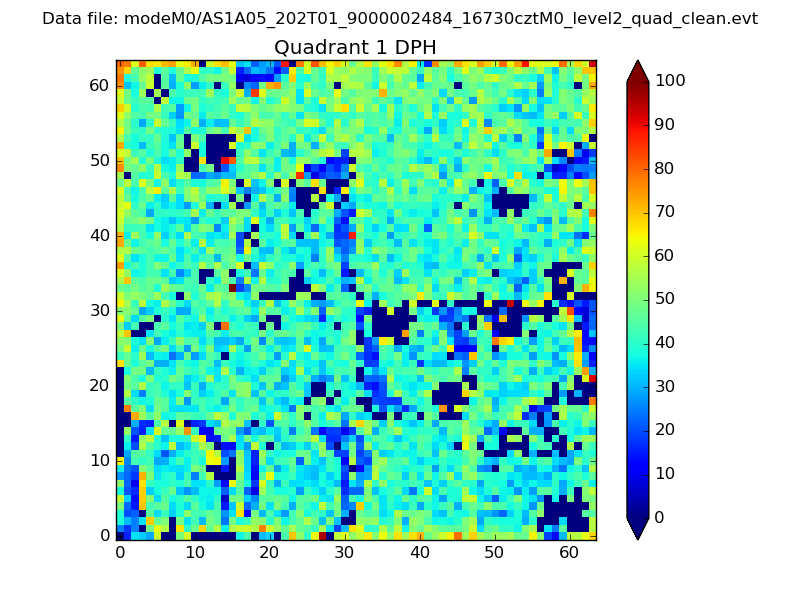 |
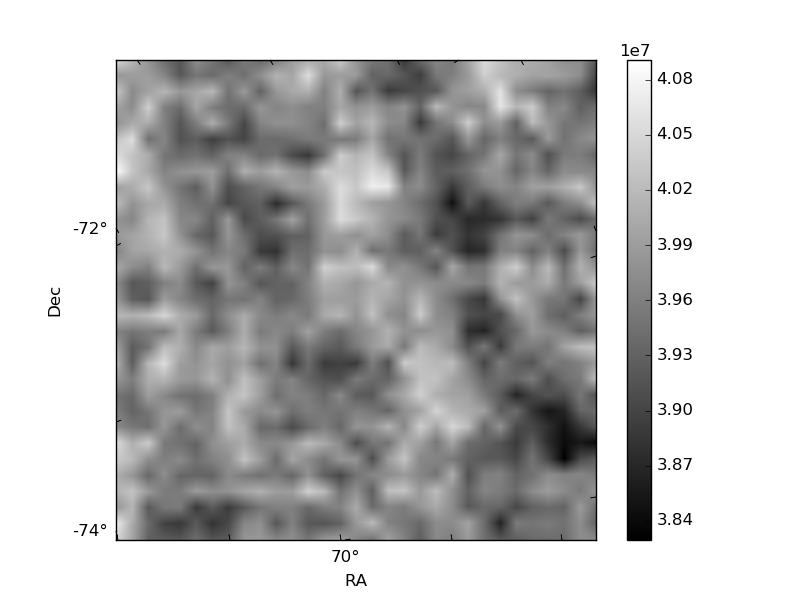
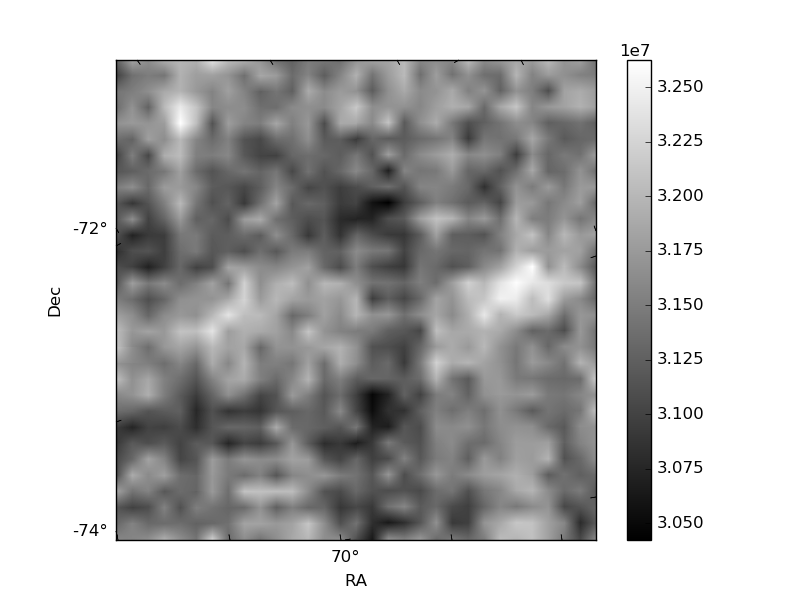
Quadrant B |
|---|---|---|---|
| Quadrant D |  |
 |
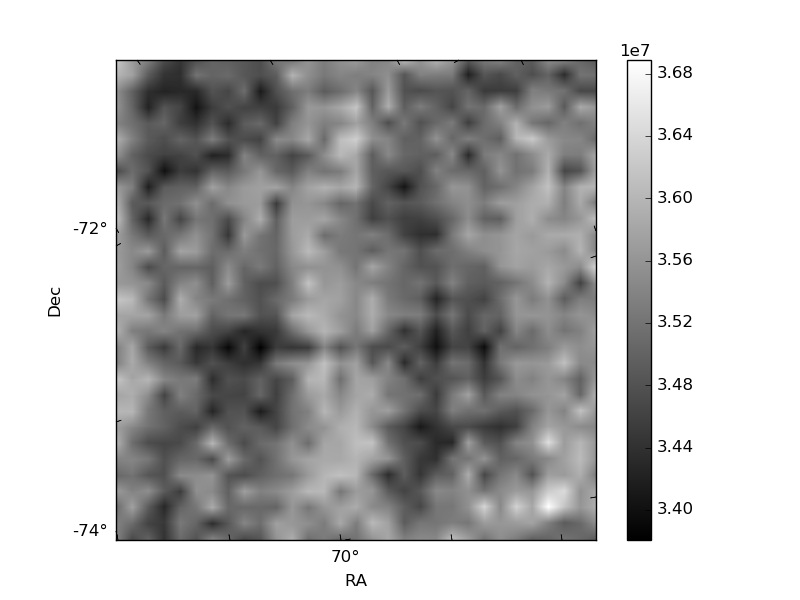
Quadrant C |
| Plot type | Count rate plots | Images |
|---|---|---|
| Comparison with Poisson distribution Blue bars denote a histogram of data divided into 1 sec bins. Red curve is a Poisson curve with rate = median count rate of data. |
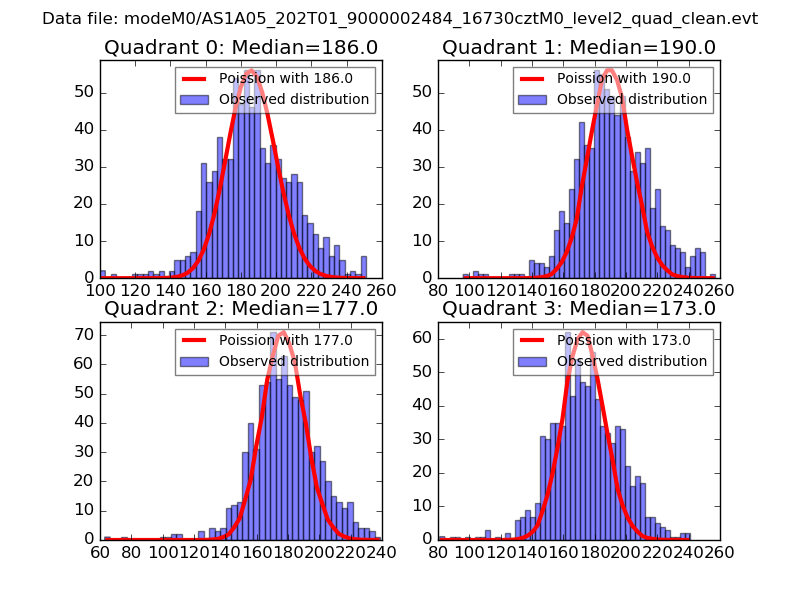 |
 |
| Quadrant-wise count rates Data is divided into 100 sec bins |
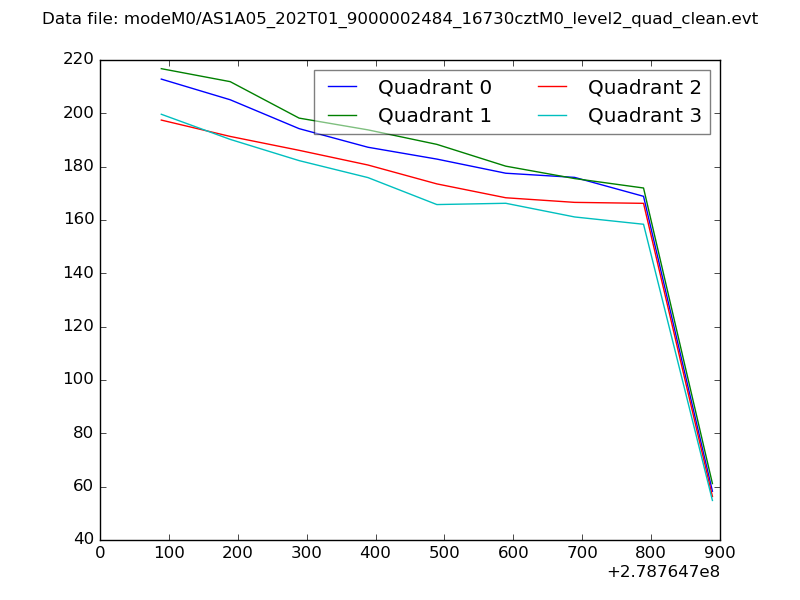 |
|
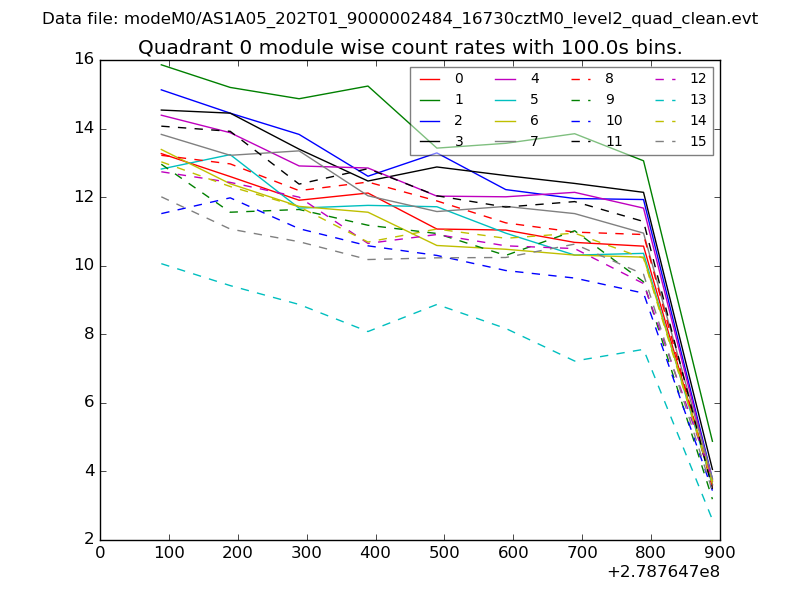
| Module-wise count rates for Quadrant A Data is divided into 100 sec bins |
 |
 |
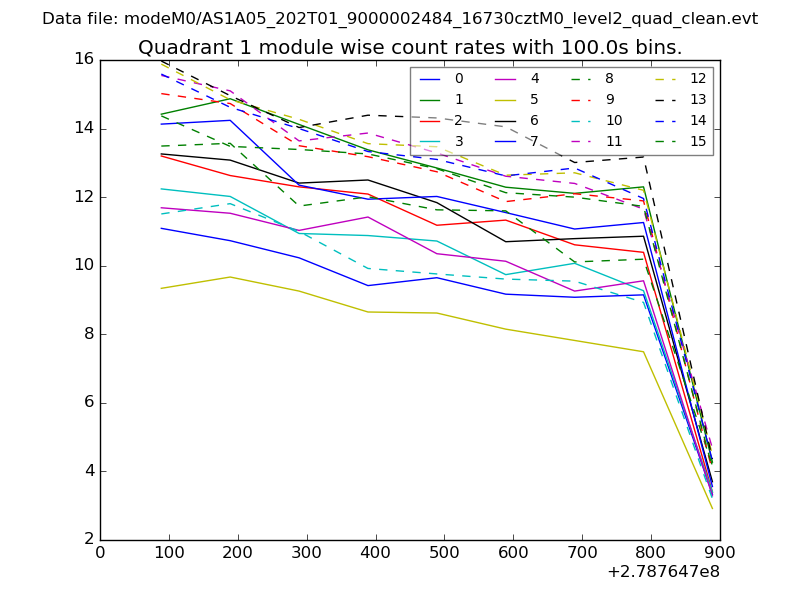
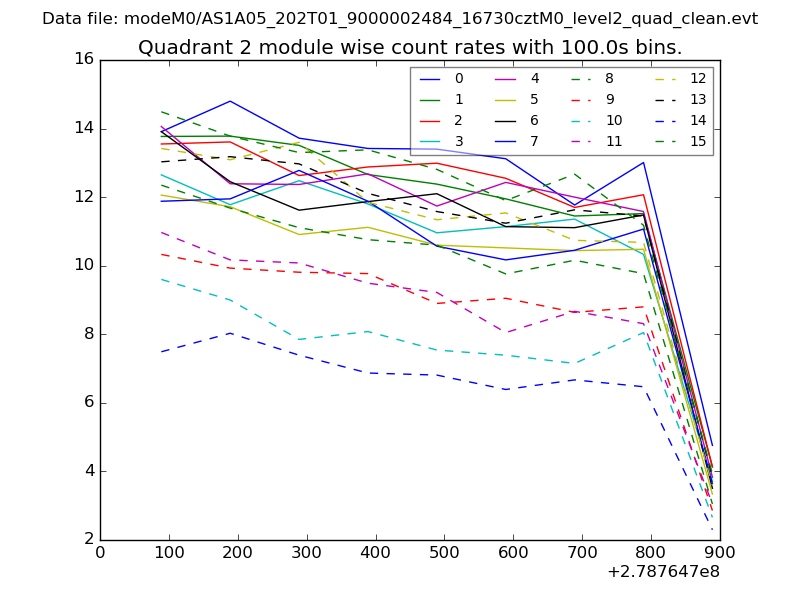
| Module-wise count rates for Quadrant B Data is divided into 100 sec bins |
 |
 |
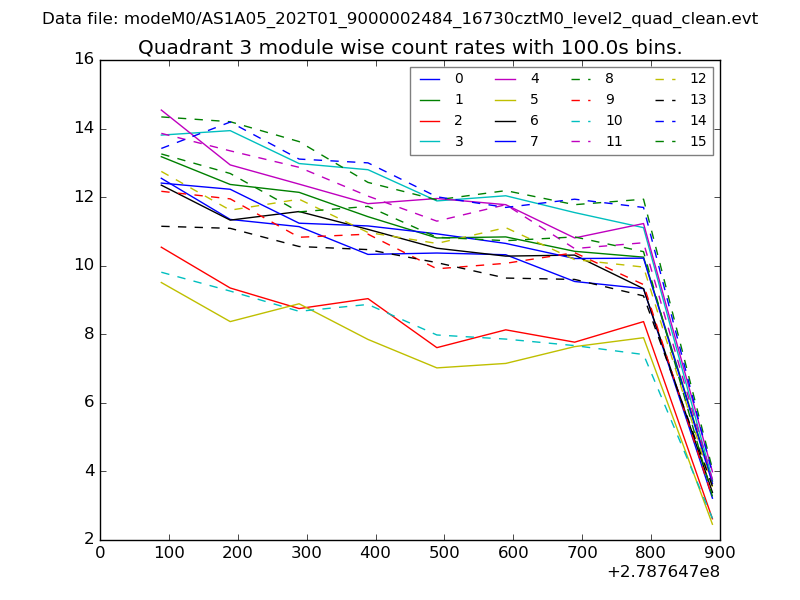
| Module-wise count rates for Quadrant C Data is divided into 100 sec bins |
 |
 |
| Module-wise count rates for Quadrant D Data is divided into 100 sec bins |
 |
 |
| Parameter | Plot |
|---|---|
| CZT HV Monitor | 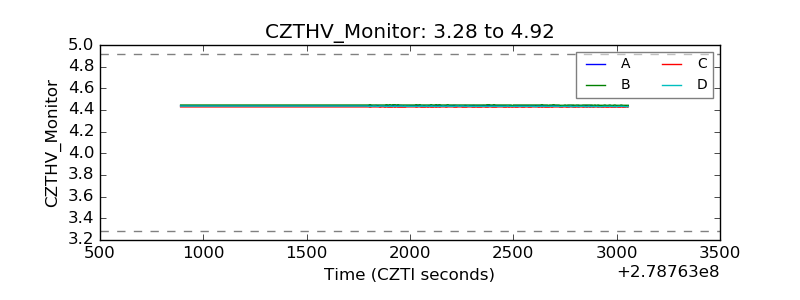 |
| D_VDD | 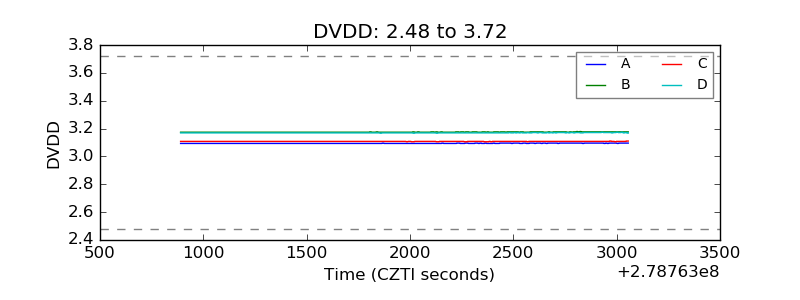 |
| Temperature 1 | 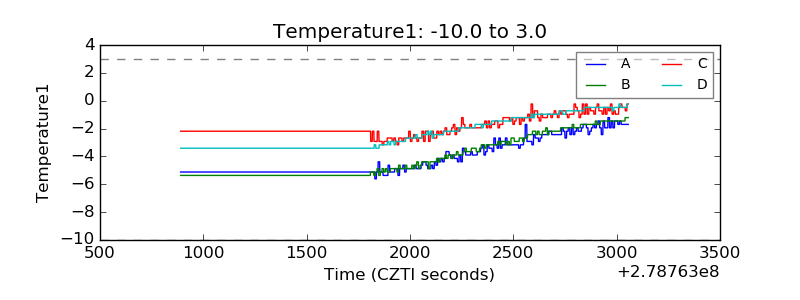 |
| Veto HV Monitor | 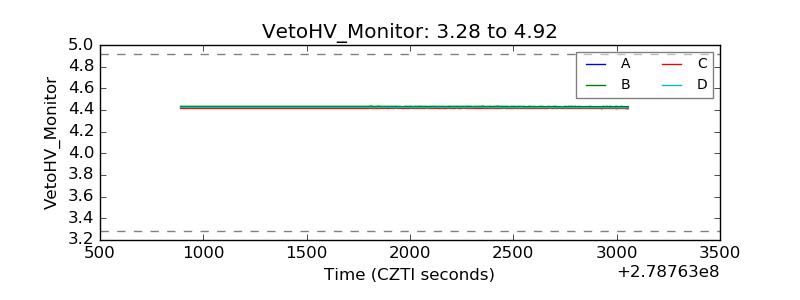 |
| Veto LLD | 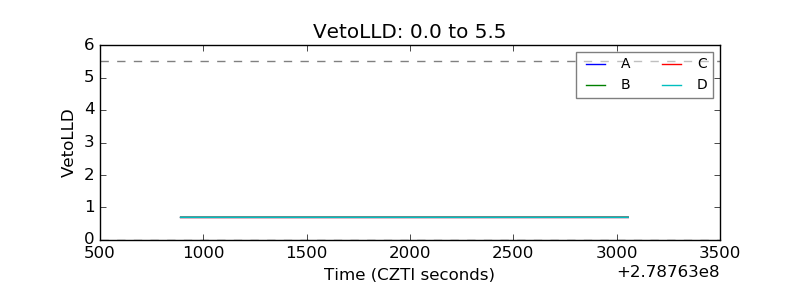 |
| Alpha Counter | 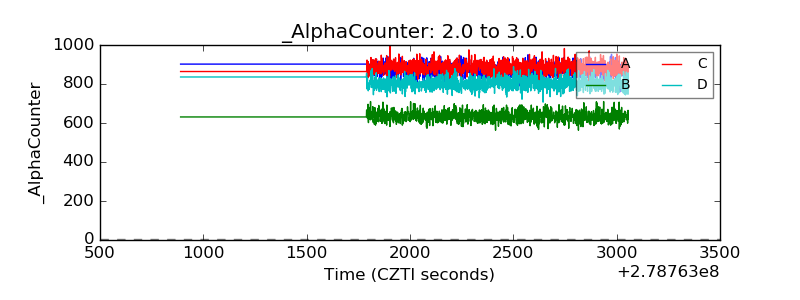 |
| _CPM_Rate | 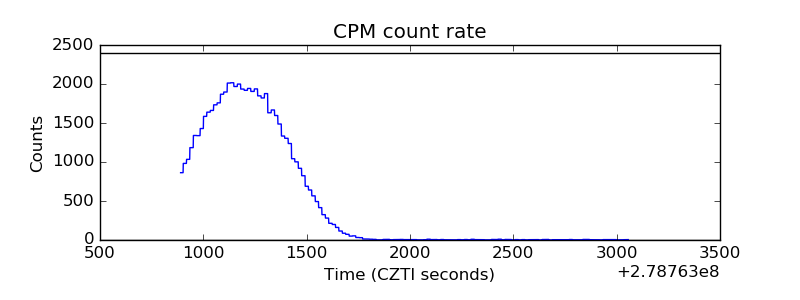 |
| CZT Counter |  |
| +2.5 Volts monitor |  |
| +5 Volts monitor | 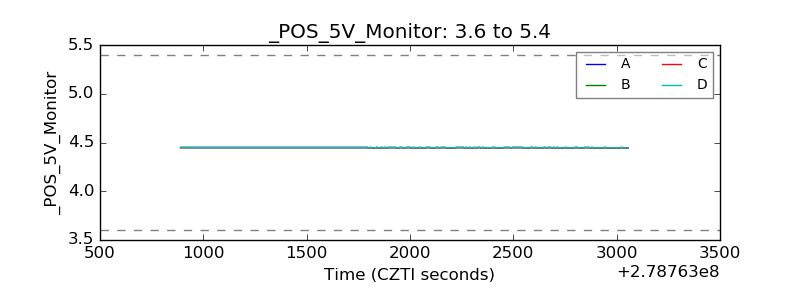 |
| _ROLL_ROT | 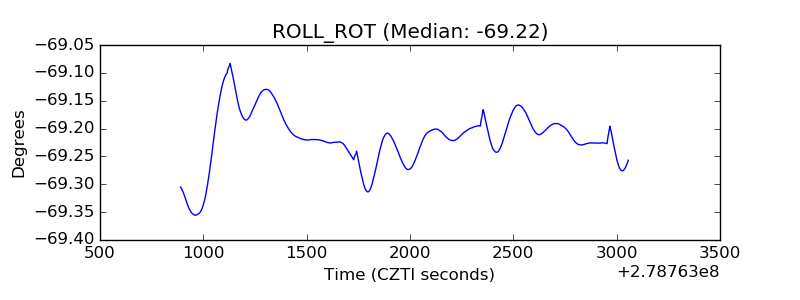 |
| _Roll_DEC | 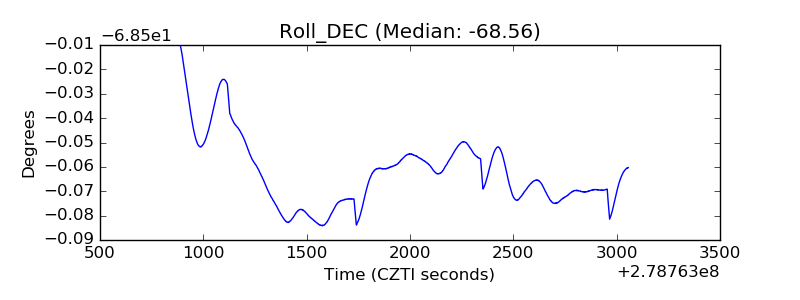 |
| _Roll_RA |  |
| Veto Counter | 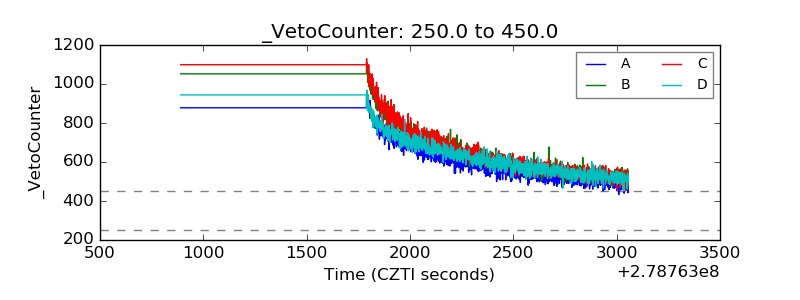 |