| Param | Original file | Final file |
|---|---|---|
| Filename | modeM0/AS1A05_202T01_9000002484_16731cztM0_level2.evt | modeM0/AS1A05_202T01_9000002484_16731cztM0_level2_quad_clean.evt |
| Size (bytes) | 546,946,560 | 113,152,320 |
| Size | 521.6 MB | 107.9 MB |
| Events in quadrant A | 4,125,454 | 759,385 |
| Events in quadrant B | 3,559,916 | 779,021 |
| Events in quadrant C | 3,396,708 | 741,477 |
| Events in quadrant D | 5,065,298 | 716,868 |
| Mode M0 | |||
|---|---|---|---|
| Quadrant | BADHDUFLAG | Total packets | Discarded packets |
| A | 0 | 16363 | 2 |
| B | 0 | 14606 | 1 |
| C | 0 | 14139 | 1 |
| D | 0 | 19470 | 1 |
| Mode M9 | |||
|---|---|---|---|
| Quadrant | BADHDUFLAG | Total packets | Discarded packets |
| A | 0 | 13 | 0 |
| B | 0 | 13 | 0 |
| C | 0 | 13 | 0 |
| D | 0 | 13 | 0 |
| Mode SS | |||
|---|---|---|---|
| Quadrant | BADHDUFLAG | Total packets | Discarded packets |
| A | 0 | 124 | 0 |
| B | 0 | 124 | 0 |
| C | 0 | 124 | 0 |
| D | 0 | 124 | 0 |
| Quadrant | Total seconds | Saturated seconds | Saturation percentage |
|---|---|---|---|
| A | 6163 | 299 | 4.851533% |
| B | 6163 | 119 | 1.930878% |
| C | 6163 | 154 | 2.498783% |
| D | 6163 | 244 | 3.959111% |
Noise dominated data is calculated using 1-second bins in cleaned event files. If a bin has >2000 counts, and if more than 50% of those come from <1% of pixels, then it is considered to be noise-dominated and hence unusable.
| Quadrant | # 1 sec bins | Bins with >0 counts | Bins with >2000 counts | High rate bins dominated by noise | Noise dominated (total time) | Noise dominated (detector-on time) | Marked lightcurve |
|---|---|---|---|---|---|---|---|
| A | 7449 | 6165 | 146 | 146 | 1.96% | 2.37% | 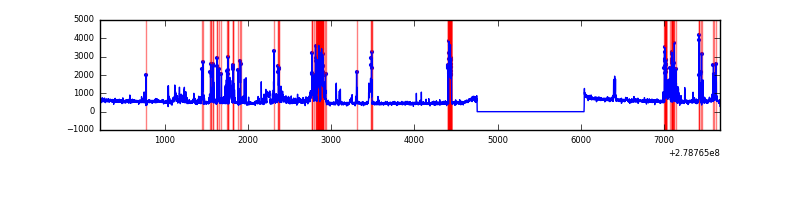 |
| B | 7449 | 6165 | 14 | 14 | 0.19% | 0.23% | 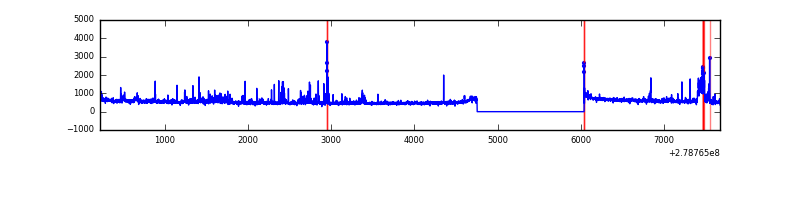 |
| C | 7449 | 6165 | 10 | 10 | 0.13% | 0.16% | 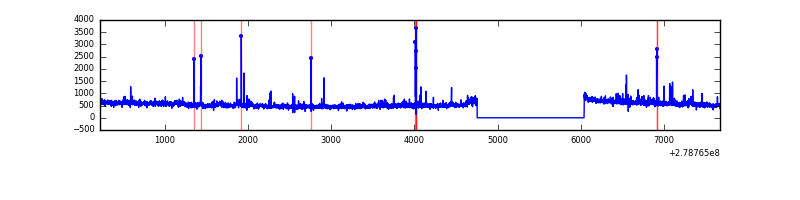 |
| D | 7449 | 6164 | 149 | 149 | 2.00% | 2.42% | 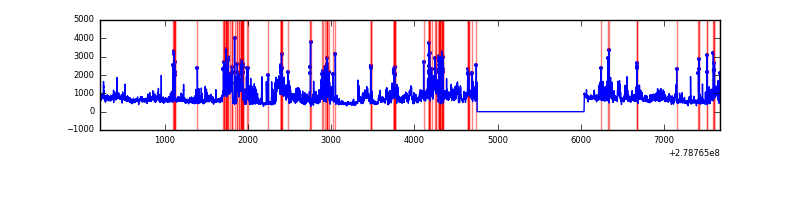 |
Top three noisy pixels from each quadrant. If the there are fewer than three noisy pixels in the level2.evt file, extra rows are filled as -1
| Pixel properties | Quadrant properties | ||||||
|---|---|---|---|---|---|---|---|
| Quadrant | DetID | PixID | Counts | Sigma | Mean | Median | Sigma |
| A | 15 | 174 | 991635 | 6220.55 | 811 | 798 | 159.3 |
| A | 10 | 234 | 10742 | 62.43 | 811 | 798 | 159.3 |
| A | 3 | 1 | 7479 | 41.94 | 811 | 798 | 159.3 |
| B | 15 | 35 | 178711 | 1200.7 | 812 | 794 | 148.2 |
| B | 7 | 220 | 51958 | 345.29 | 812 | 794 | 148.2 |
| B | 10 | 16 | 44947 | 297.97 | 812 | 794 | 148.2 |
| C | 0 | 207 | 150972 | 857.28 | 773 | 779 | 175.2 |
| C | 14 | 238 | 124524 | 706.32 | 773 | 779 | 175.2 |
| C | 3 | 233 | 106297 | 602.28 | 773 | 779 | 175.2 |
| D | 12 | 110 | 1247769 | 6692.35 | 784 | 763 | 186.3 |
| D | 2 | 16 | 222428 | 1189.62 | 784 | 763 | 186.3 |
| D | 1 | 52 | 191490 | 1023.58 | 784 | 763 | 186.3 |
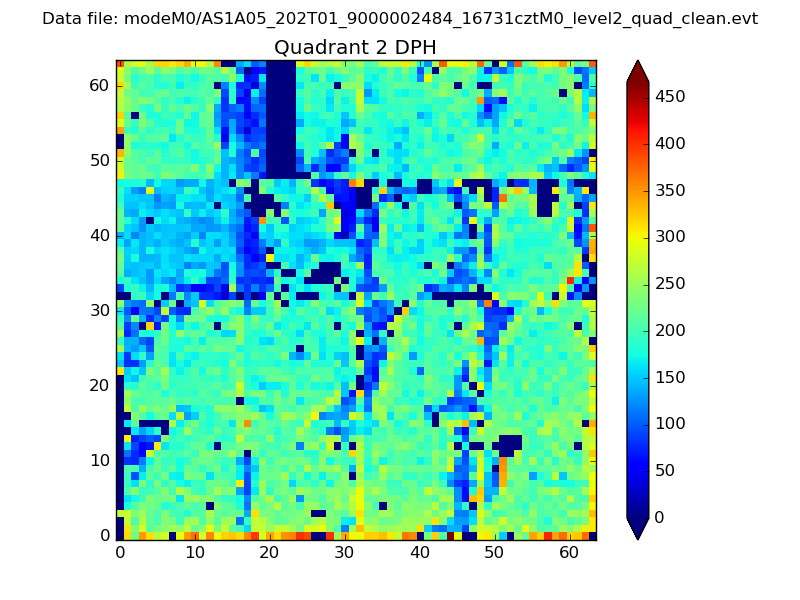
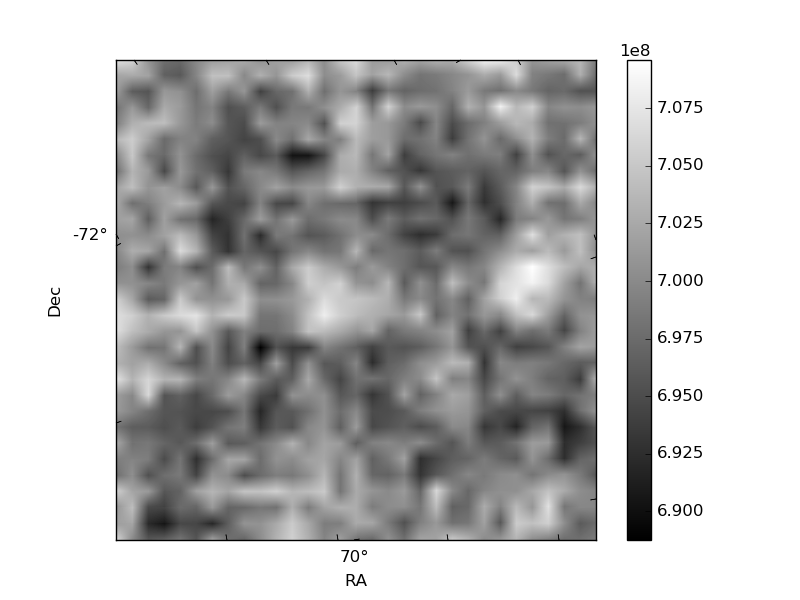
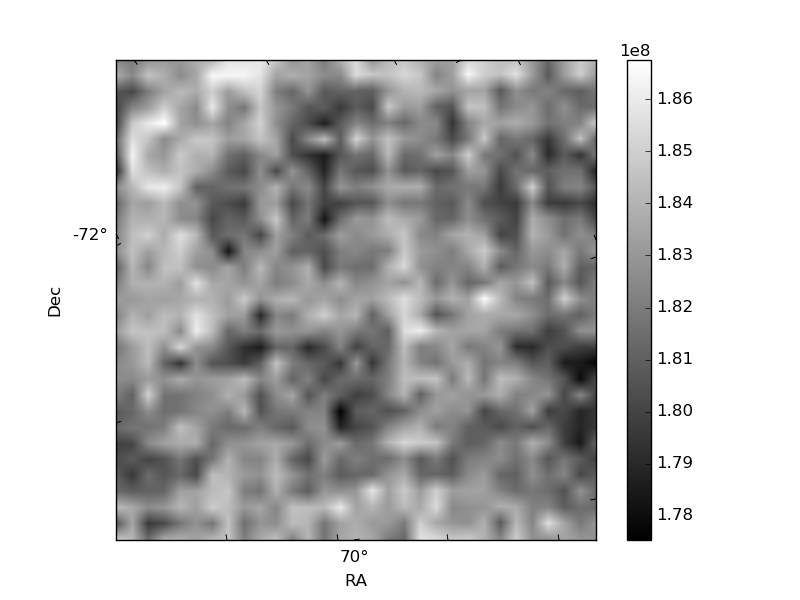
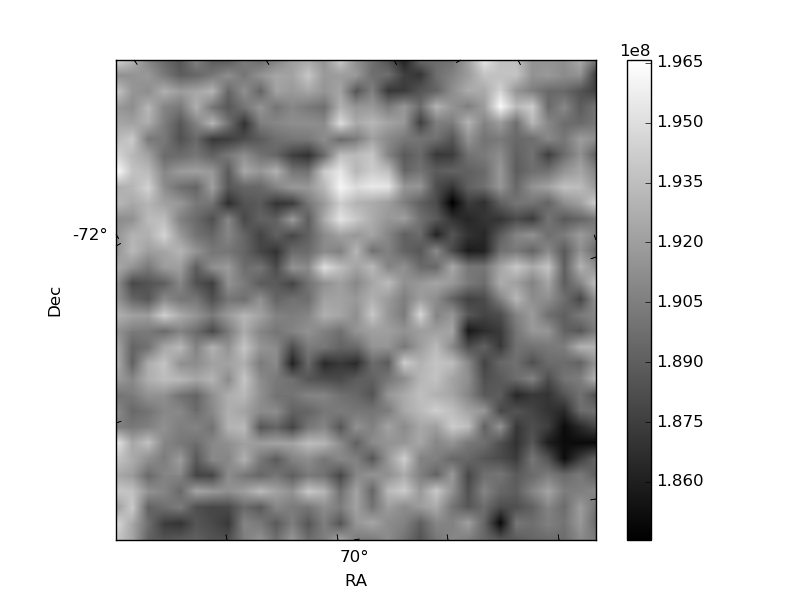
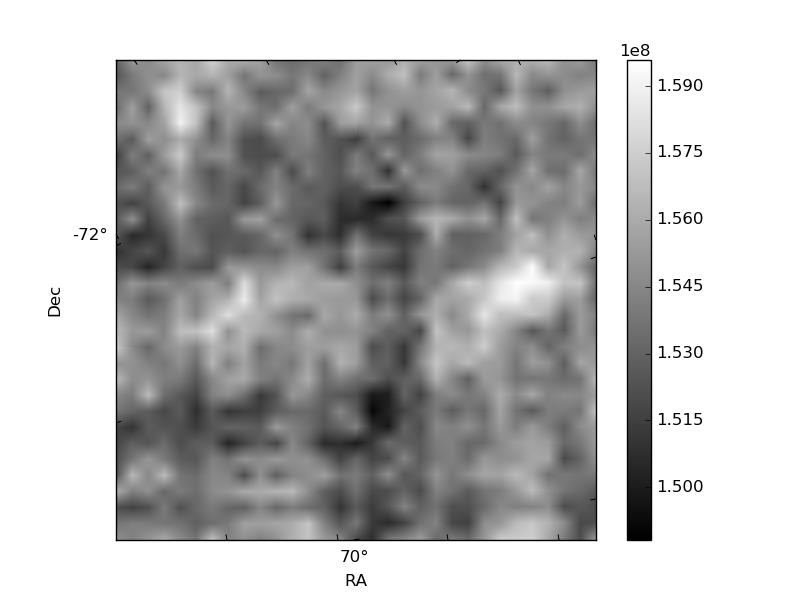
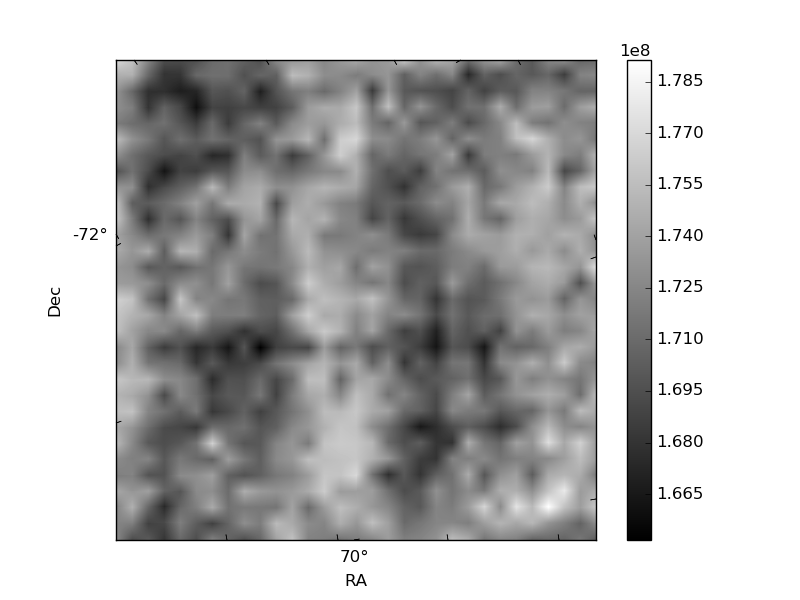
Histogram calculated using DETX and DETY for each event in the final _common_clean file
| Quadrant A | 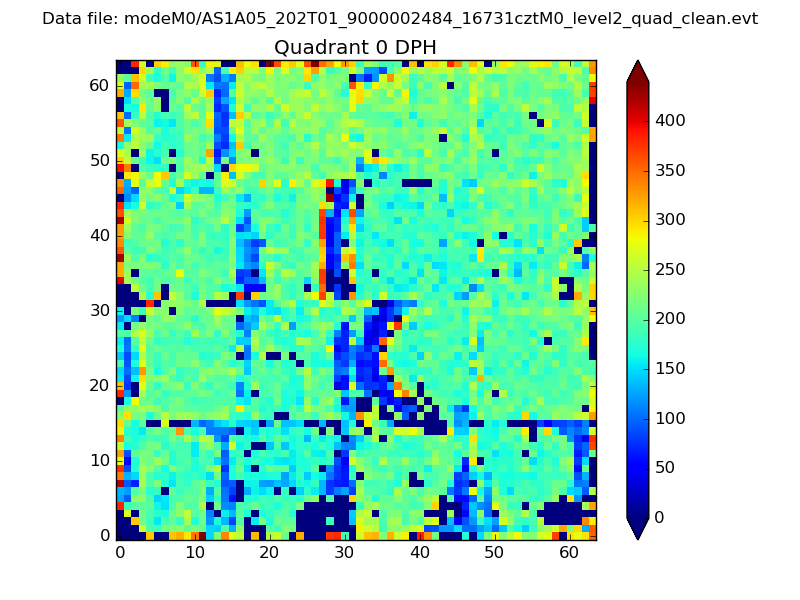 |
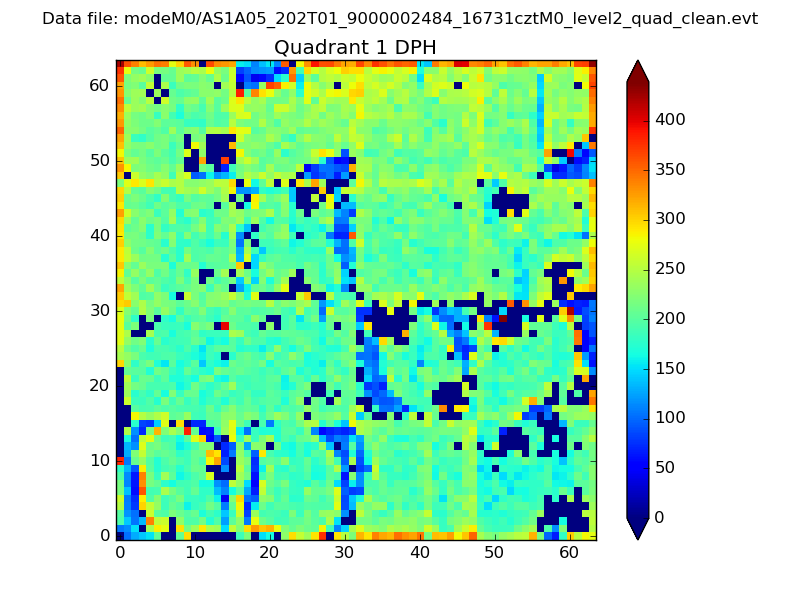 |
Quadrant B |
|---|---|---|---|
| Quadrant D | 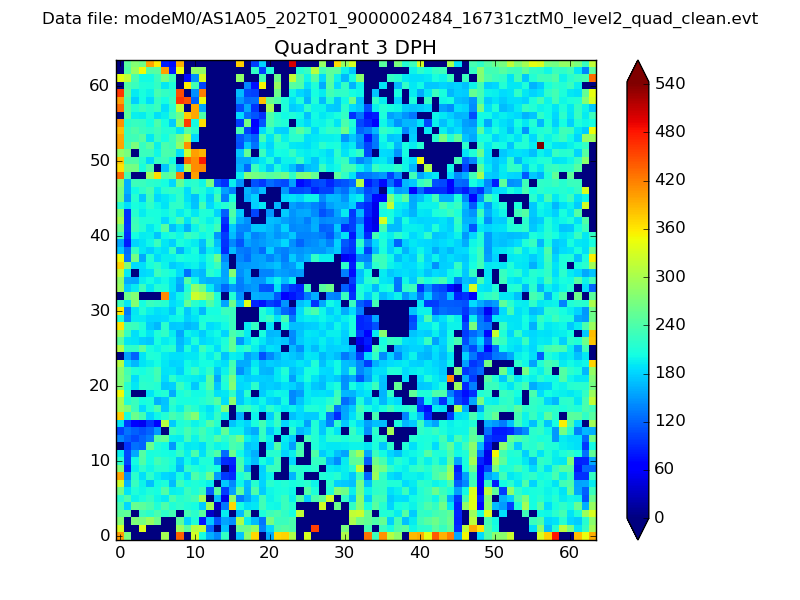 |
 |
Quadrant C |
| Plot type | Count rate plots | Images |
|---|---|---|
| Comparison with Poisson distribution Blue bars denote a histogram of data divided into 1 sec bins. Red curve is a Poisson curve with rate = median count rate of data. |
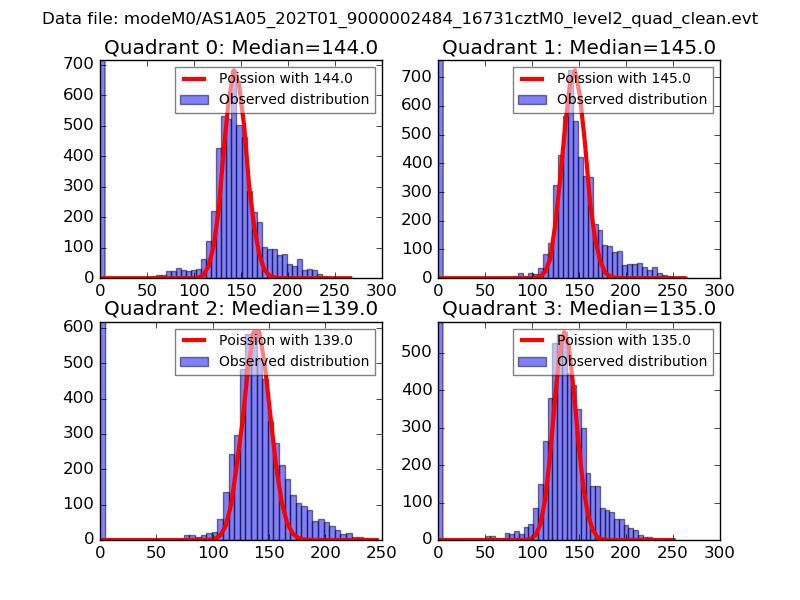 |
 |
| Quadrant-wise count rates Data is divided into 100 sec bins |
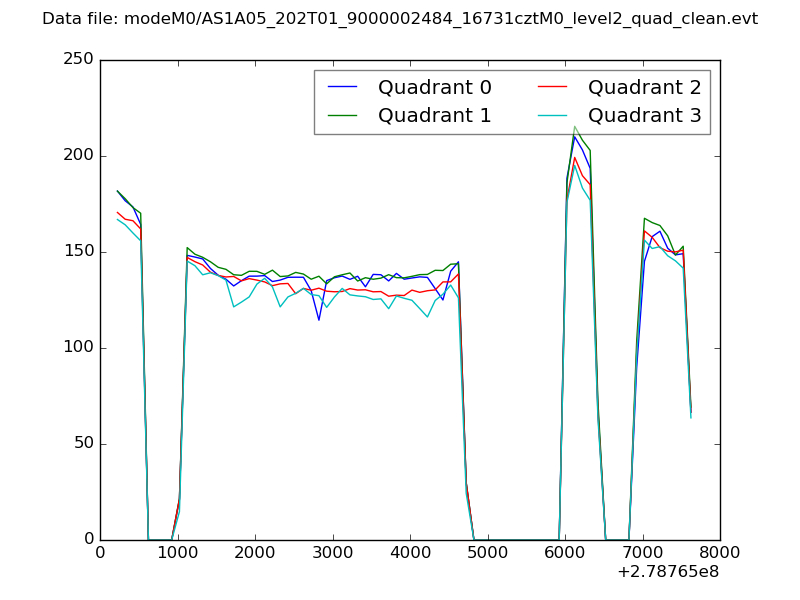 |
|
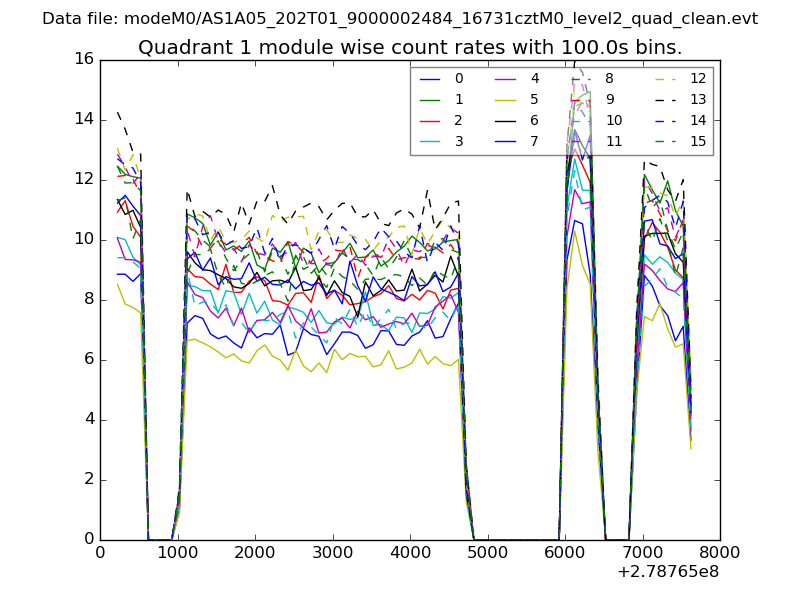
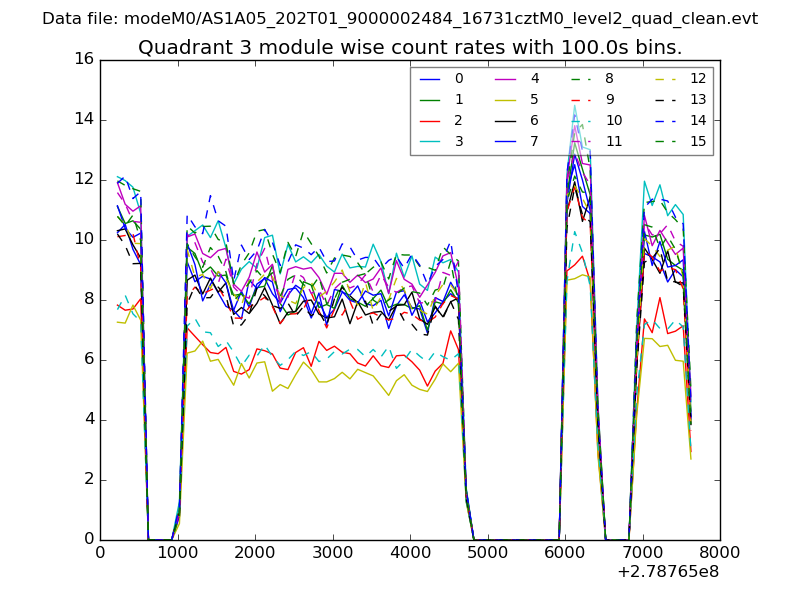
| Module-wise count rates for Quadrant A Data is divided into 100 sec bins |
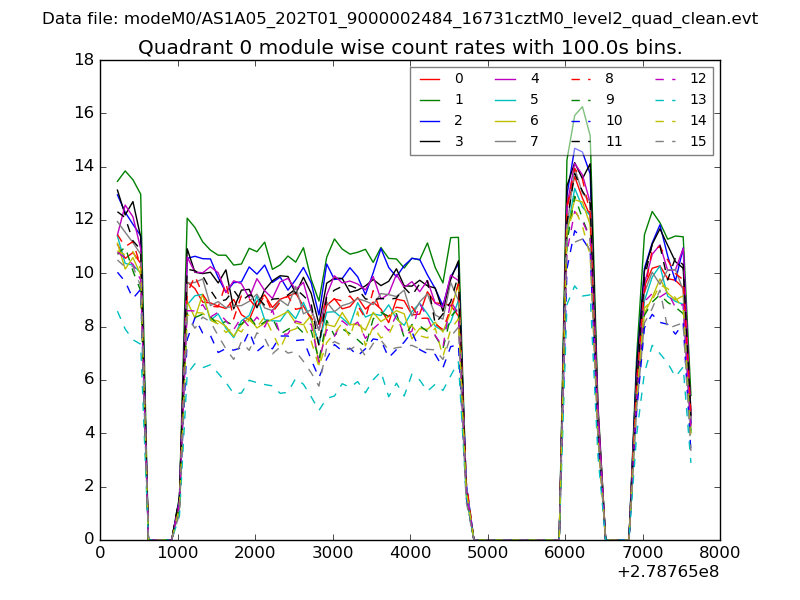 |
 |
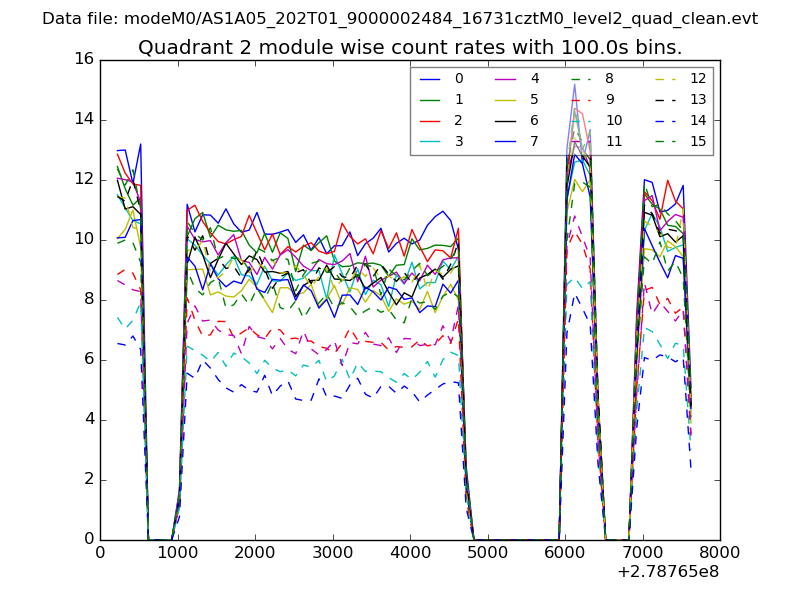
| Module-wise count rates for Quadrant B Data is divided into 100 sec bins |
 |
 |
| Module-wise count rates for Quadrant C Data is divided into 100 sec bins |
 |
 |
| Module-wise count rates for Quadrant D Data is divided into 100 sec bins |
 |
 |
| Parameter | Plot |
|---|---|
| CZT HV Monitor | 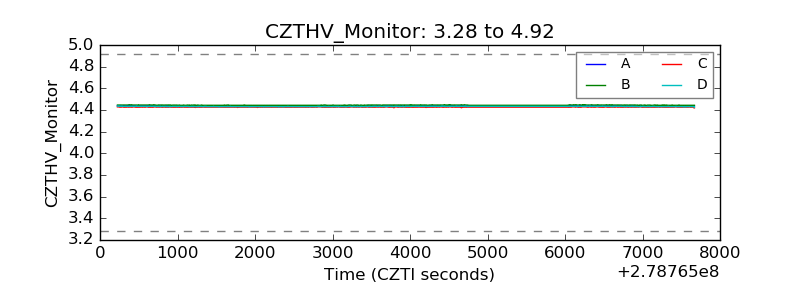 |
| D_VDD | 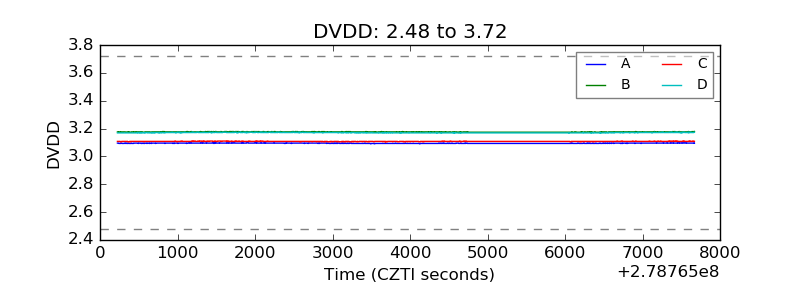 |
| Temperature 1 | 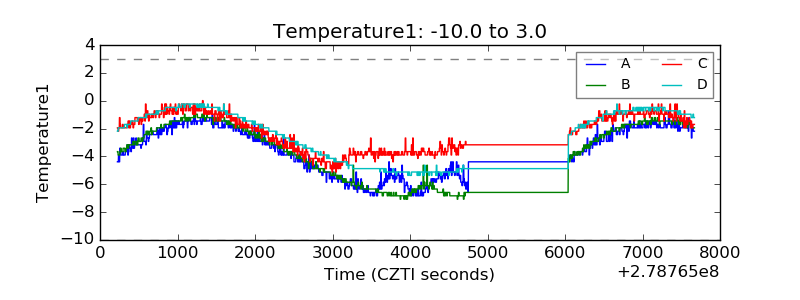 |
| Veto HV Monitor | 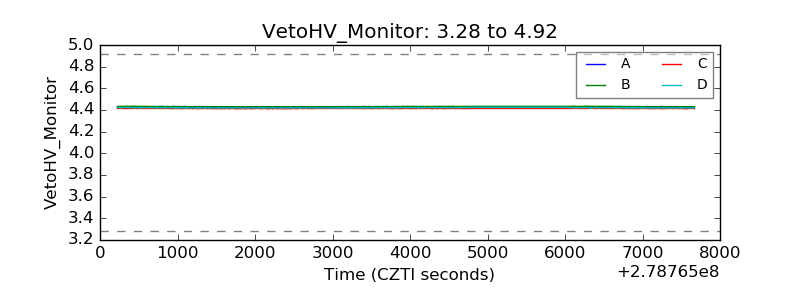 |
| Veto LLD | 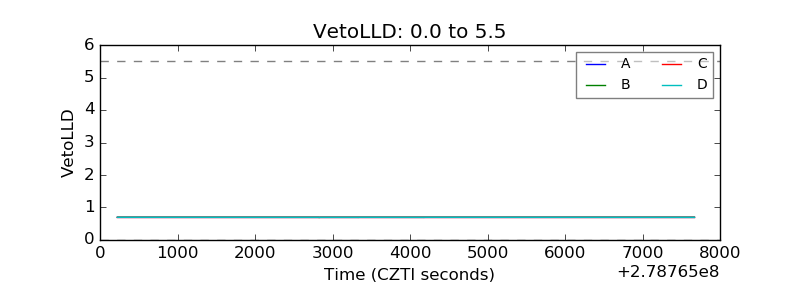 |
| Alpha Counter | 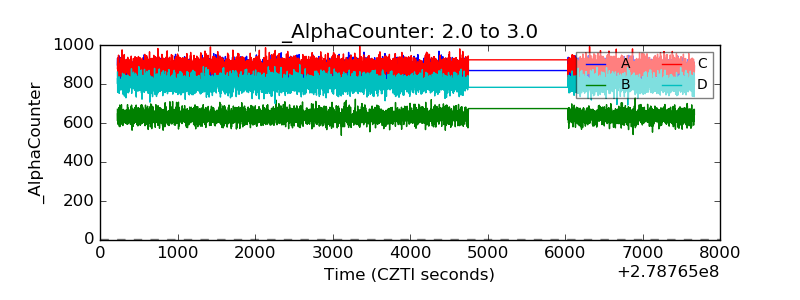 |
| _CPM_Rate | 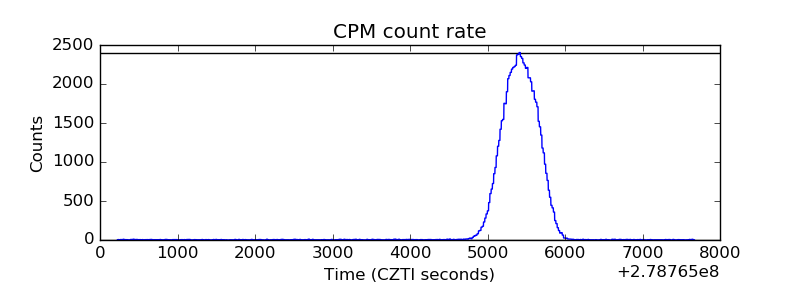 |
| CZT Counter | 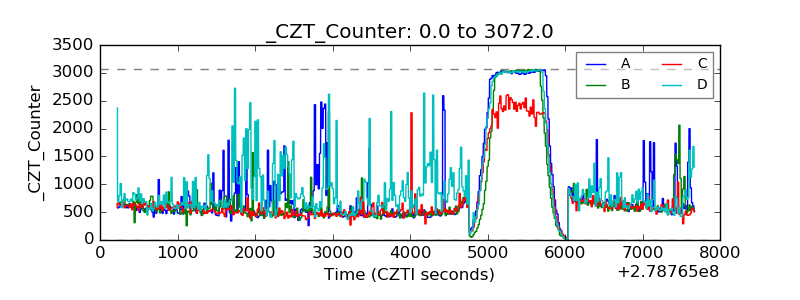 |
| +2.5 Volts monitor |  |
| +5 Volts monitor |  |
| _ROLL_ROT | 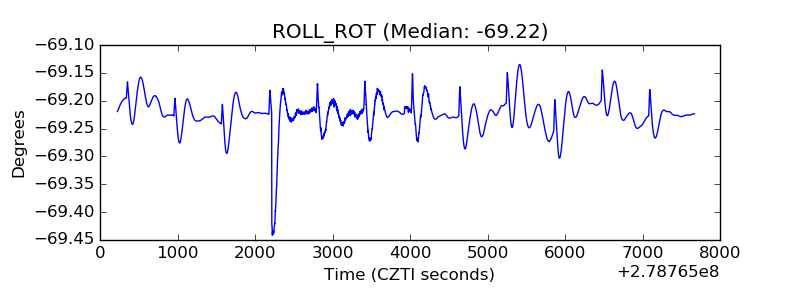 |
| _Roll_DEC | 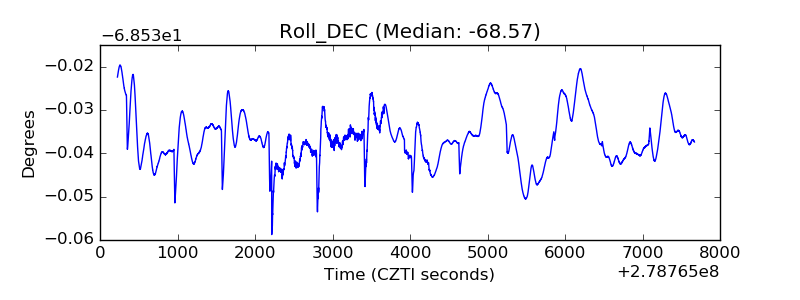 |
| _Roll_RA | 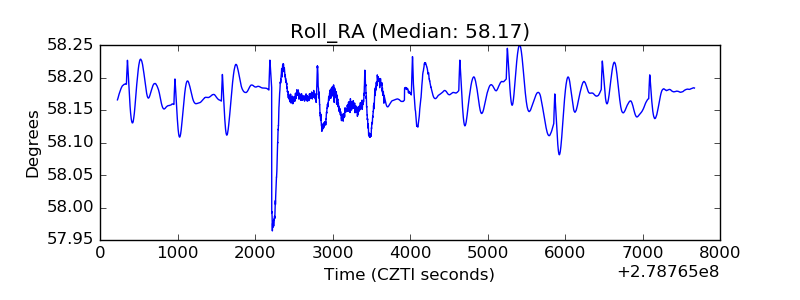 |
| Veto Counter | 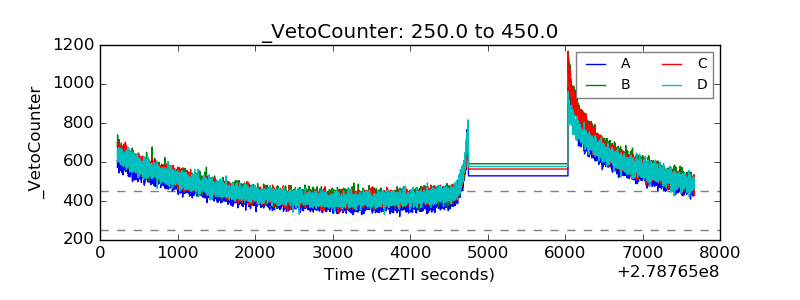 |