| Param | Original file | Final file |
|---|---|---|
| Filename | modeM0/AS1A05_202T01_9000002484_16732cztM0_level2.evt | modeM0/AS1A05_202T01_9000002484_16732cztM0_level2_quad_clean.evt |
| Size (bytes) | 554,754,240 | 113,221,440 |
| Size | 529.1 MB | 108.0 MB |
| Events in quadrant A | 4,981,017 | 735,367 |
| Events in quadrant B | 3,614,168 | 788,972 |
| Events in quadrant C | 3,375,682 | 744,385 |
| Events in quadrant D | 4,407,766 | 725,259 |
| Mode M0 | |||
|---|---|---|---|
| Quadrant | BADHDUFLAG | Total packets | Discarded packets |
| A | 0 | 19046 | 2 |
| B | 0 | 14793 | 1 |
| C | 0 | 14104 | 1 |
| D | 0 | 17360 | 1 |
| Mode M9 | |||
|---|---|---|---|
| Quadrant | BADHDUFLAG | Total packets | Discarded packets |
| A | 0 | 14 | 0 |
| B | 0 | 14 | 0 |
| C | 0 | 14 | 0 |
| D | 0 | 14 | 0 |
| Mode SS | |||
|---|---|---|---|
| Quadrant | BADHDUFLAG | Total packets | Discarded packets |
| A | 0 | 126 | 0 |
| B | 0 | 126 | 0 |
| C | 0 | 126 | 0 |
| D | 0 | 126 | 0 |
| Quadrant | Total seconds | Saturated seconds | Saturation percentage |
|---|---|---|---|
| A | 6232 | 651 | 10.446085% |
| B | 6232 | 128 | 2.053915% |
| C | 6232 | 143 | 2.294608% |
| D | 6232 | 217 | 3.482028% |
Noise dominated data is calculated using 1-second bins in cleaned event files. If a bin has >2000 counts, and if more than 50% of those come from <1% of pixels, then it is considered to be noise-dominated and hence unusable.
| Quadrant | # 1 sec bins | Bins with >0 counts | Bins with >2000 counts | High rate bins dominated by noise | Noise dominated (total time) | Noise dominated (detector-on time) | Marked lightcurve |
|---|---|---|---|---|---|---|---|
| A | 7587 | 6233 | 398 | 398 | 5.25% | 6.39% | 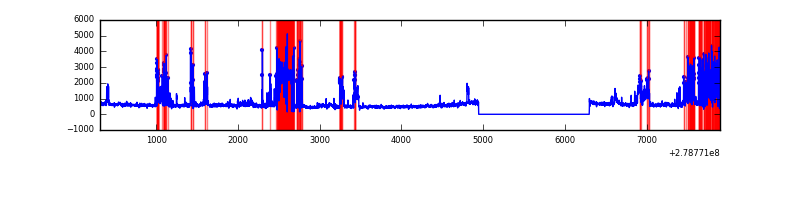 |
| B | 7588 | 6234 | 19 | 19 | 0.25% | 0.30% | 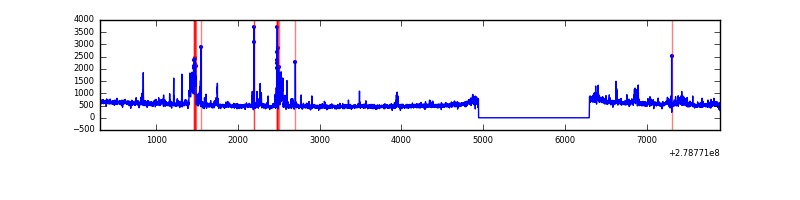 |
| C | 7588 | 6234 | 7 | 7 | 0.09% | 0.11% | 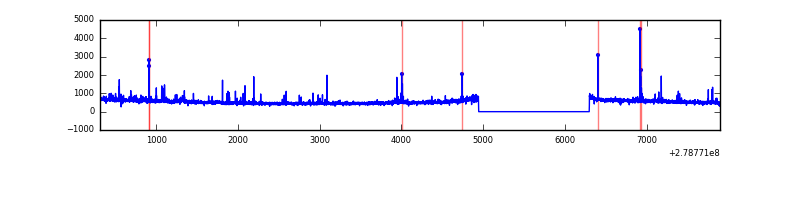 |
| D | 7588 | 6234 | 118 | 118 | 1.56% | 1.89% | 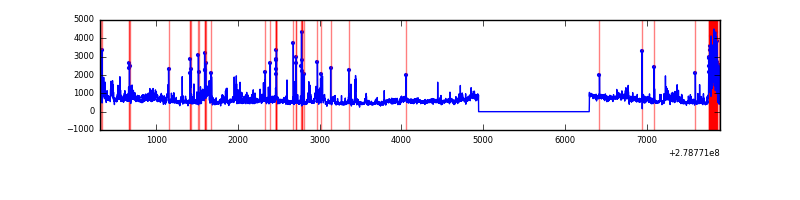 |
Top three noisy pixels from each quadrant. If the there are fewer than three noisy pixels in the level2.evt file, extra rows are filled as -1
| Pixel properties | Quadrant properties | ||||||
|---|---|---|---|---|---|---|---|
| Quadrant | DetID | PixID | Counts | Sigma | Mean | Median | Sigma |
| A | 15 | 174 | 1858105 | 11855.37 | 804 | 791 | 156.7 |
| A | 10 | 234 | 18347 | 112.06 | 804 | 791 | 156.7 |
| A | 0 | 226 | 7217 | 41.02 | 804 | 791 | 156.7 |
| B | 15 | 35 | 193250 | 1269.99 | 829 | 811 | 151.5 |
| B | 0 | 197 | 45943 | 297.84 | 829 | 811 | 151.5 |
| B | 3 | 209 | 35207 | 226.99 | 829 | 811 | 151.5 |
| C | 0 | 207 | 170921 | 962.39 | 785 | 791 | 176.8 |
| C | 14 | 238 | 126448 | 710.81 | 785 | 791 | 176.8 |
| C | 3 | 233 | 13145 | 69.88 | 785 | 791 | 176.8 |
| D | 2 | 16 | 323141 | 1692.83 | 794 | 772 | 190.4 |
| D | 15 | 0 | 315534 | 1652.89 | 794 | 772 | 190.4 |
| D | 1 | 52 | 283181 | 1482.99 | 794 | 772 | 190.4 |
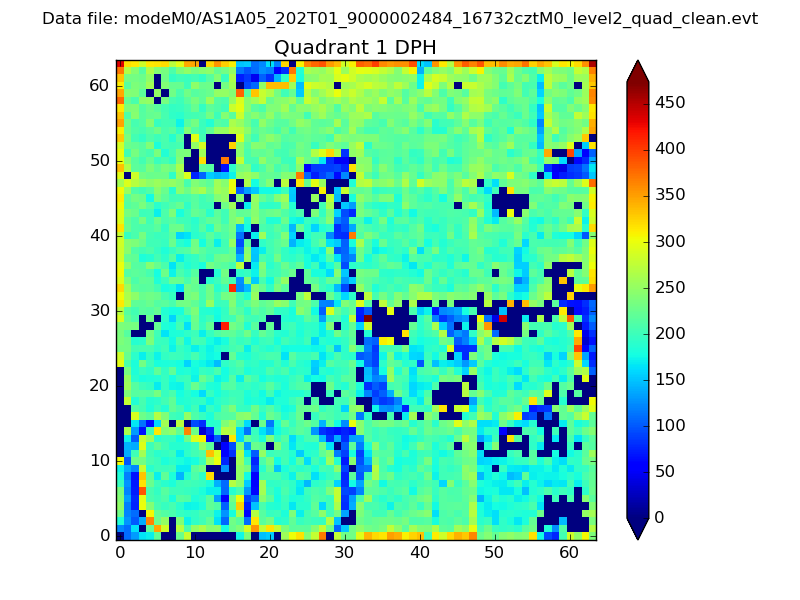
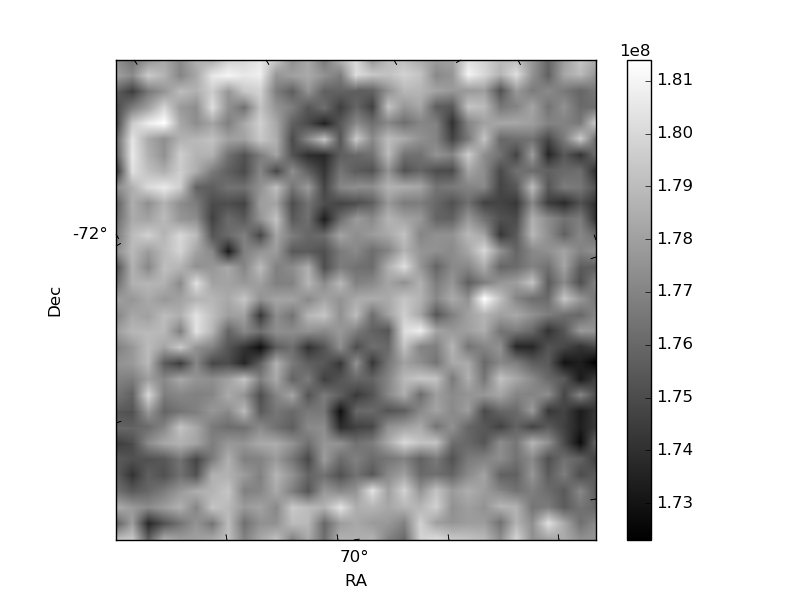
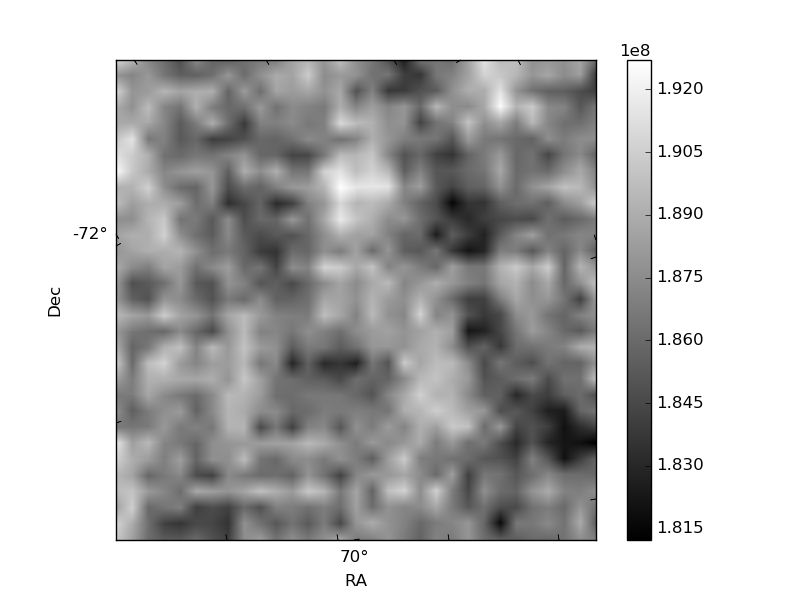
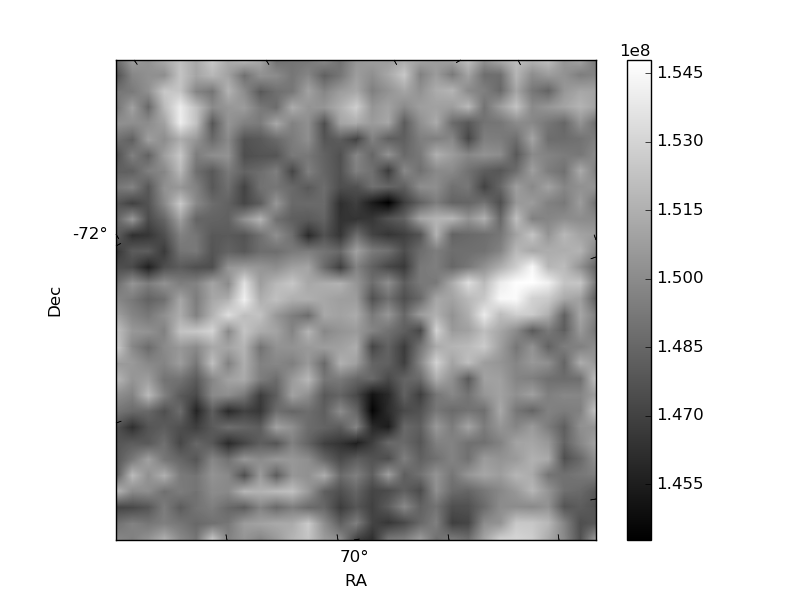
Histogram calculated using DETX and DETY for each event in the final _common_clean file
| Quadrant A |  |
 |
Quadrant B |
|---|---|---|---|
| Quadrant D | 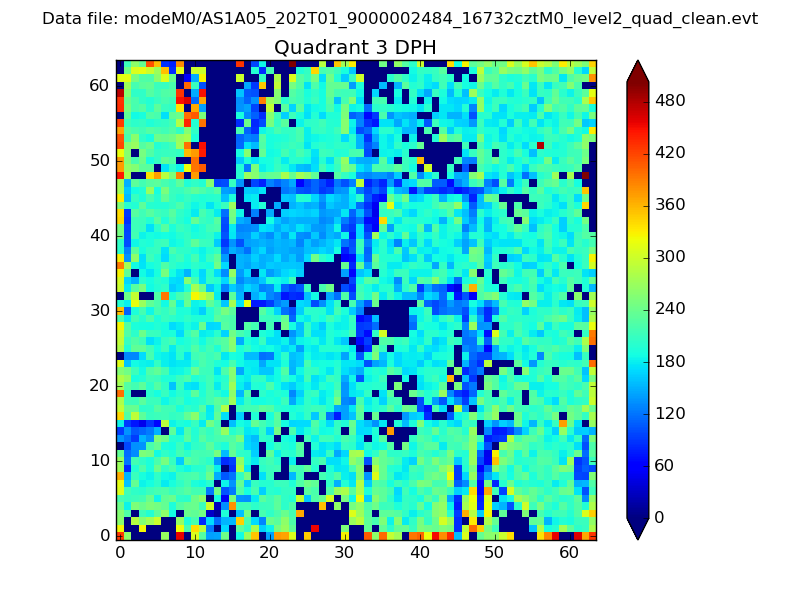 |
 |
Quadrant C |
| Plot type | Count rate plots | Images |
|---|---|---|
| Comparison with Poisson distribution Blue bars denote a histogram of data divided into 1 sec bins. Red curve is a Poisson curve with rate = median count rate of data. |
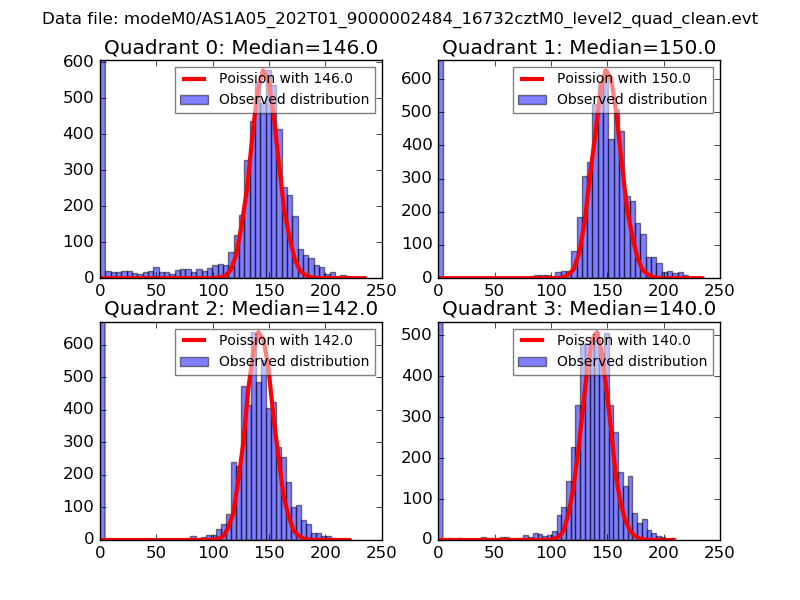 |
 |
| Quadrant-wise count rates Data is divided into 100 sec bins |
 |
|
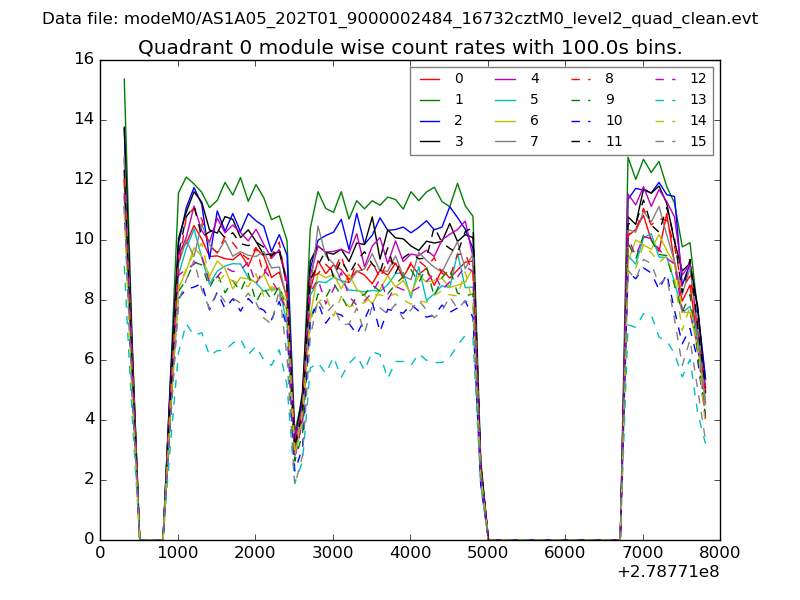
| Module-wise count rates for Quadrant A Data is divided into 100 sec bins |
 |
 |
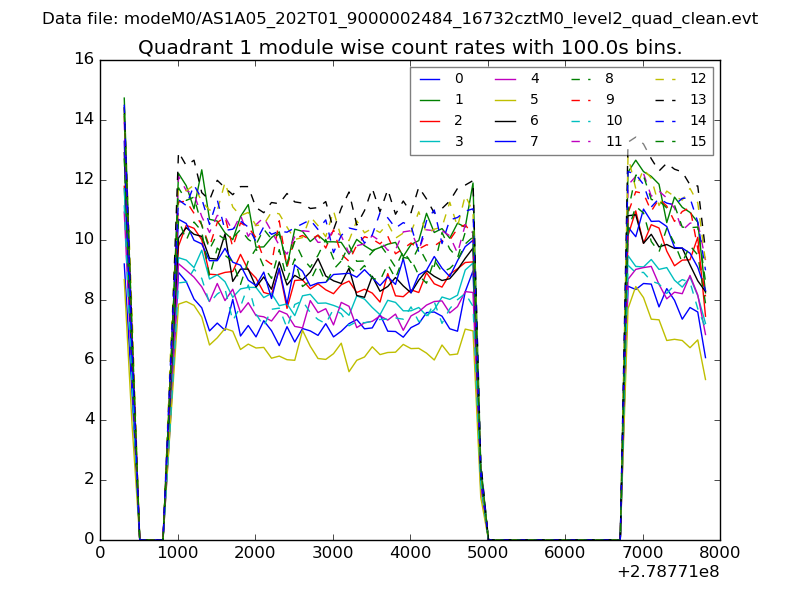
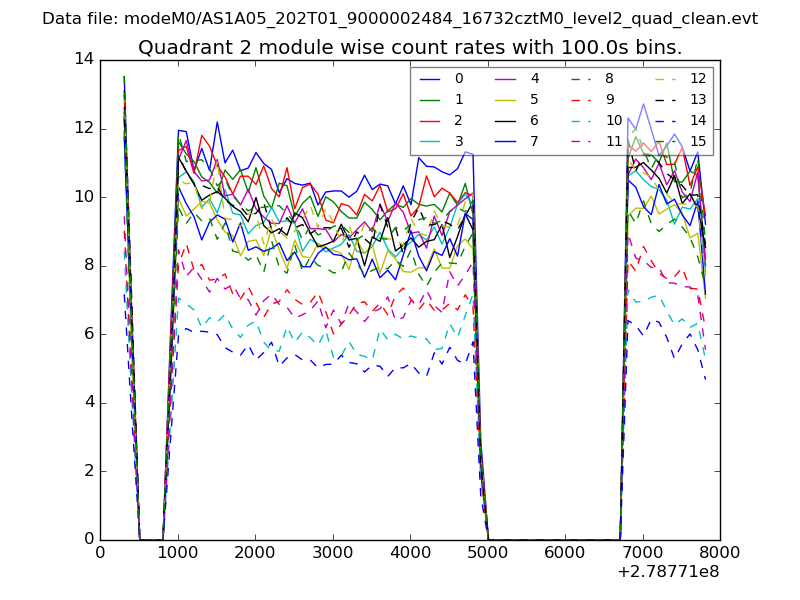
| Module-wise count rates for Quadrant B Data is divided into 100 sec bins |
 |
 |
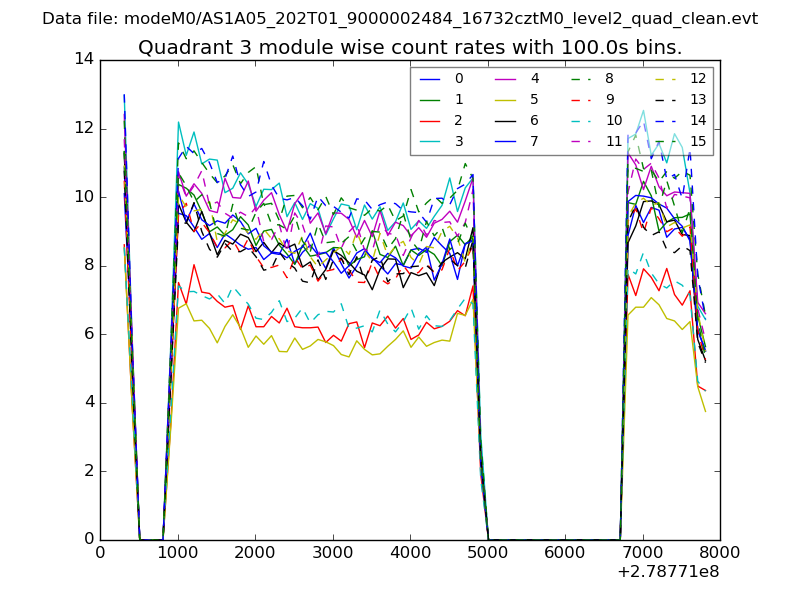
| Module-wise count rates for Quadrant C Data is divided into 100 sec bins |
 |
 |
| Module-wise count rates for Quadrant D Data is divided into 100 sec bins |
 |
 |
| Parameter | Plot |
|---|---|
| CZT HV Monitor | 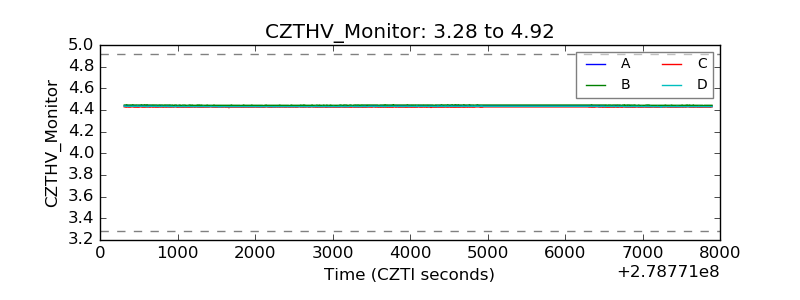 |
| D_VDD | 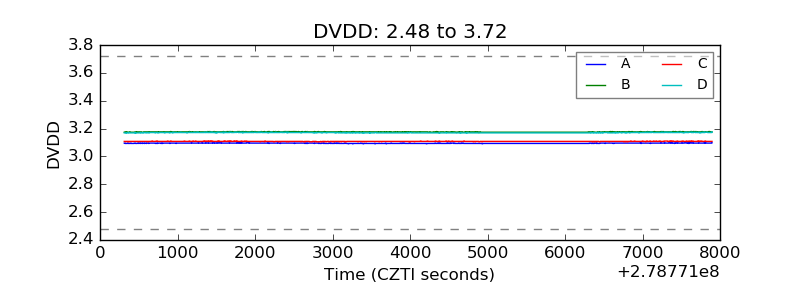 |
| Temperature 1 | 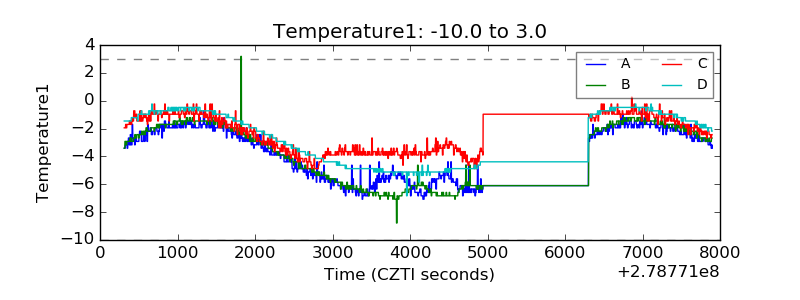 |
| Veto HV Monitor | 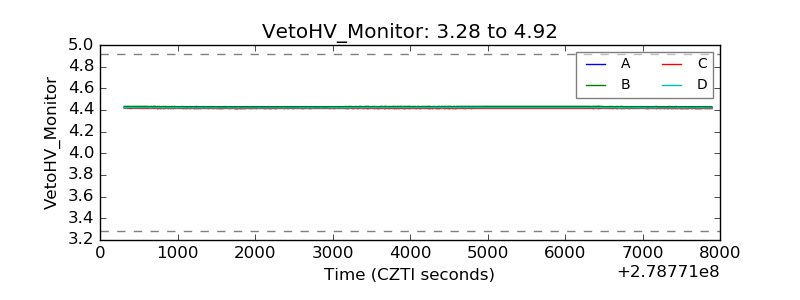 |
| Veto LLD | 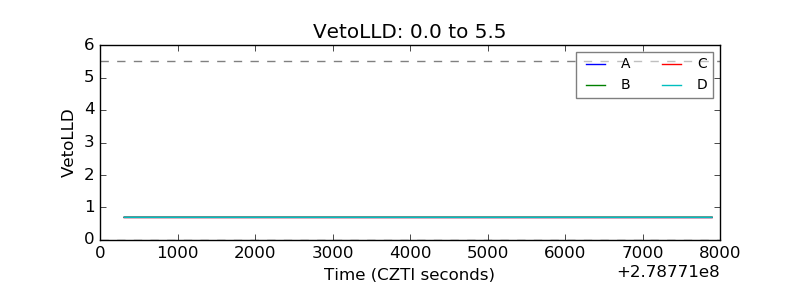 |
| Alpha Counter | 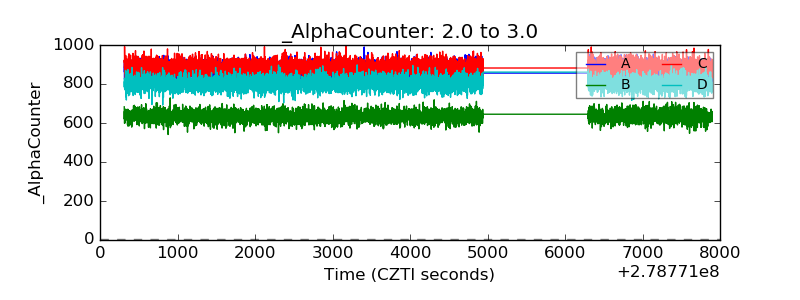 |
| _CPM_Rate | 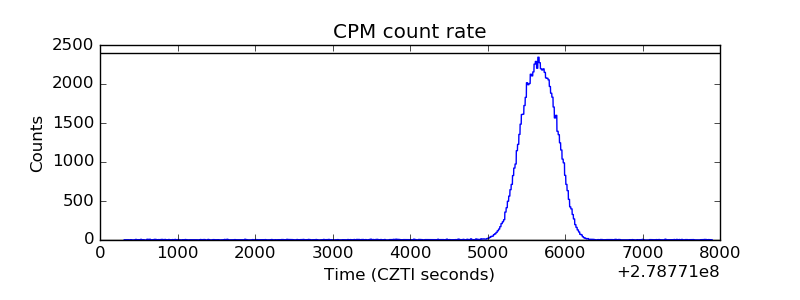 |
| CZT Counter | 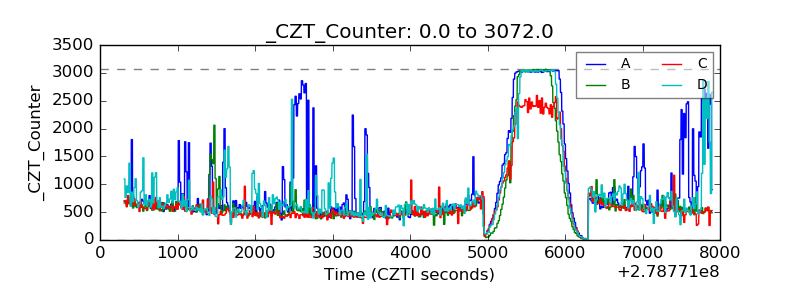 |
| +2.5 Volts monitor |  |
| +5 Volts monitor |  |
| _ROLL_ROT | 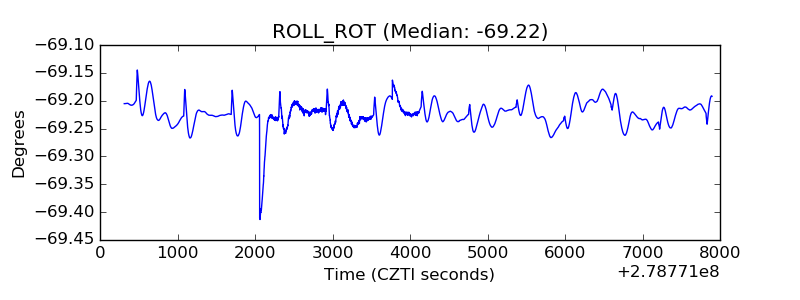 |
| _Roll_DEC | 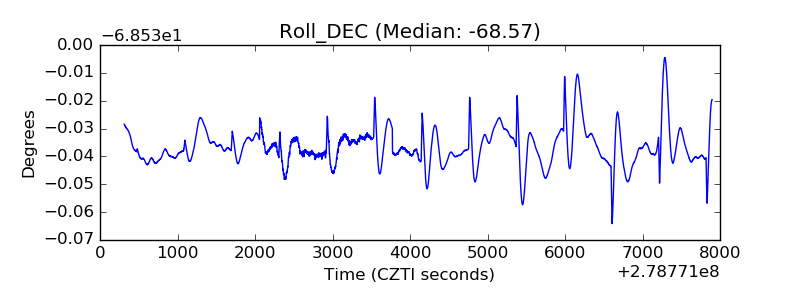 |
| _Roll_RA | 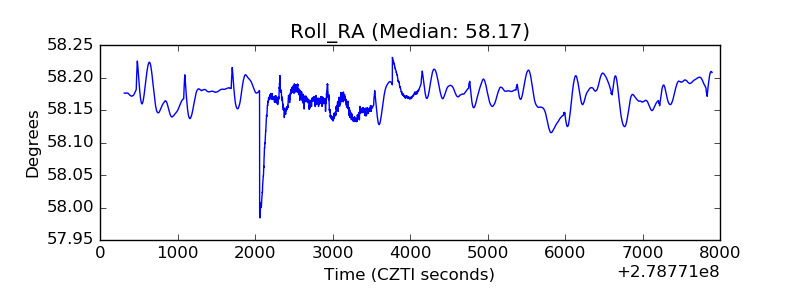 |
| Veto Counter | 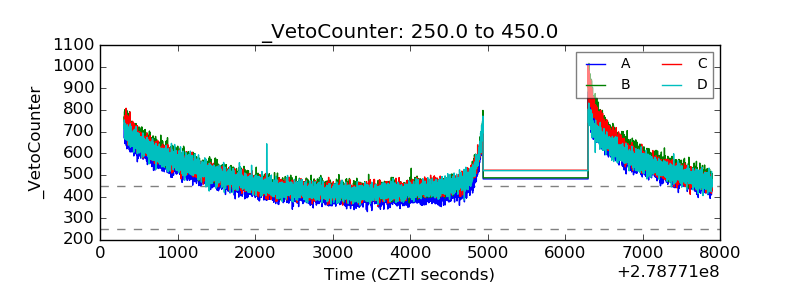 |