| Param | Original file | Final file |
|---|---|---|
| Filename | modeM0/AS1A05_202T01_9000002484_16733cztM0_level2.evt | modeM0/AS1A05_202T01_9000002484_16733cztM0_level2_quad_clean.evt |
| Size (bytes) | 578,517,120 | 121,556,160 |
| Size | 551.7 MB | 115.9 MB |
| Events in quadrant A | 5,389,790 | 799,511 |
| Events in quadrant B | 3,538,970 | 858,628 |
| Events in quadrant C | 3,303,456 | 811,201 |
| Events in quadrant D | 4,863,221 | 773,926 |
| Mode M0 | |||
|---|---|---|---|
| Quadrant | BADHDUFLAG | Total packets | Discarded packets |
| A | 0 | 20342 | 2 |
| B | 0 | 14601 | 1 |
| C | 0 | 13801 | 1 |
| D | 0 | 18719 | 1 |
| Mode M9 | |||
|---|---|---|---|
| Quadrant | BADHDUFLAG | Total packets | Discarded packets |
| A | 0 | 13 | 0 |
| B | 0 | 13 | 0 |
| C | 0 | 13 | 0 |
| D | 0 | 13 | 0 |
| Mode SS | |||
|---|---|---|---|
| Quadrant | BADHDUFLAG | Total packets | Discarded packets |
| A | 0 | 128 | 0 |
| B | 0 | 128 | 0 |
| C | 0 | 128 | 0 |
| D | 0 | 128 | 0 |
| Quadrant | Total seconds | Saturated seconds | Saturation percentage |
|---|---|---|---|
| A | 6273 | 798 | 12.721186% |
| B | 6273 | 117 | 1.865136% |
| C | 6273 | 113 | 1.801371% |
| D | 6273 | 368 | 5.866412% |
Noise dominated data is calculated using 1-second bins in cleaned event files. If a bin has >2000 counts, and if more than 50% of those come from <1% of pixels, then it is considered to be noise-dominated and hence unusable.
| Quadrant | # 1 sec bins | Bins with >0 counts | Bins with >2000 counts | High rate bins dominated by noise | Noise dominated (total time) | Noise dominated (detector-on time) | Marked lightcurve |
|---|---|---|---|---|---|---|---|
| A | 7624 | 6275 | 469 | 469 | 6.15% | 7.47% | 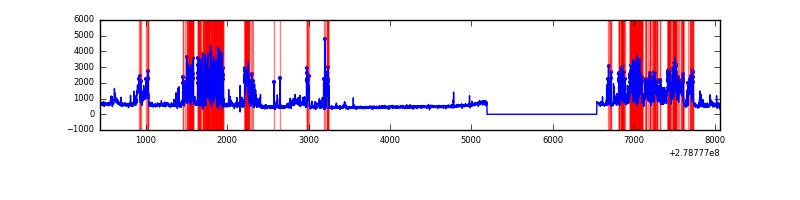 |
| B | 7624 | 6275 | 8 | 8 | 0.10% | 0.13% | 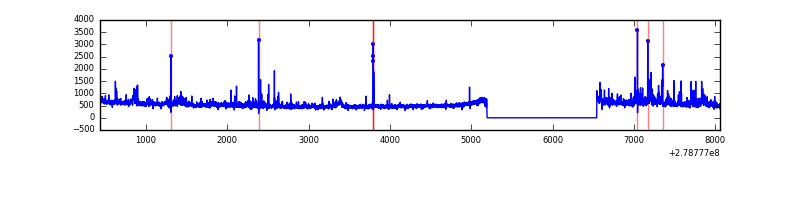 |
| C | 7624 | 6275 | 3 | 3 | 0.04% | 0.05% | 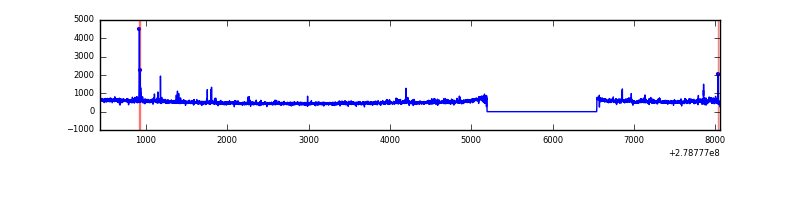 |
| D | 7624 | 6275 | 275 | 275 | 3.61% | 4.38% | 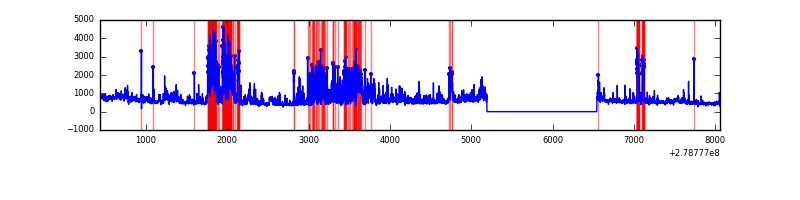 |
Top three noisy pixels from each quadrant. If the there are fewer than three noisy pixels in the level2.evt file, extra rows are filled as -1
| Pixel properties | Quadrant properties | ||||||
|---|---|---|---|---|---|---|---|
| Quadrant | DetID | PixID | Counts | Sigma | Mean | Median | Sigma |
| A | 15 | 174 | 2309183 | 14905.0 | 786 | 773 | 154.9 |
| A | 0 | 23 | 44788 | 284.2 | 786 | 773 | 154.9 |
| A | 3 | 1 | 10230 | 61.06 | 786 | 773 | 154.9 |
| B | 15 | 35 | 72885 | 482.32 | 816 | 798 | 149.5 |
| B | 3 | 209 | 56118 | 370.14 | 816 | 798 | 149.5 |
| B | 0 | 189 | 53199 | 350.61 | 816 | 798 | 149.5 |
| C | 14 | 238 | 124583 | 704.06 | 770 | 779 | 175.8 |
| C | 0 | 207 | 83953 | 473.0 | 770 | 779 | 175.8 |
| C | 3 | 233 | 72801 | 409.58 | 770 | 779 | 175.8 |
| D | 2 | 16 | 1057605 | 5745.21 | 768 | 748 | 184.0 |
| D | 15 | 0 | 673779 | 3658.68 | 768 | 748 | 184.0 |
| D | 1 | 52 | 62427 | 335.29 | 768 | 748 | 184.0 |
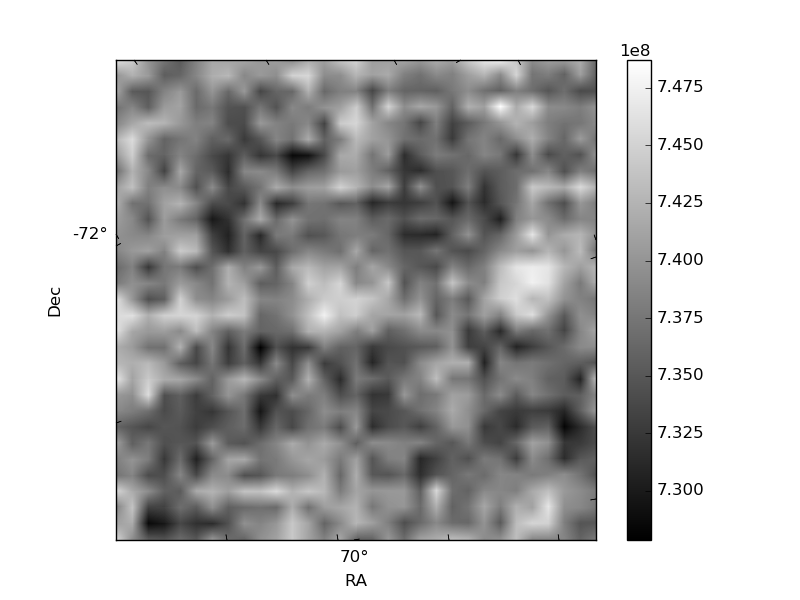
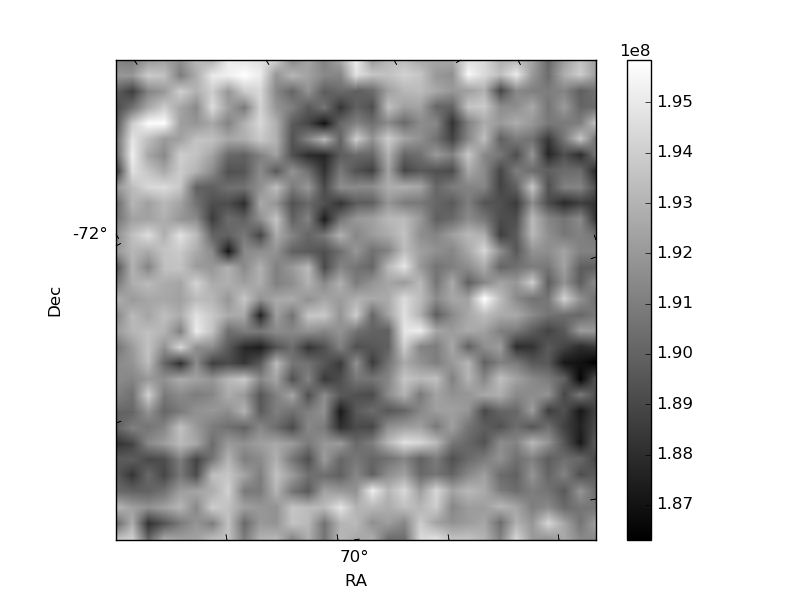
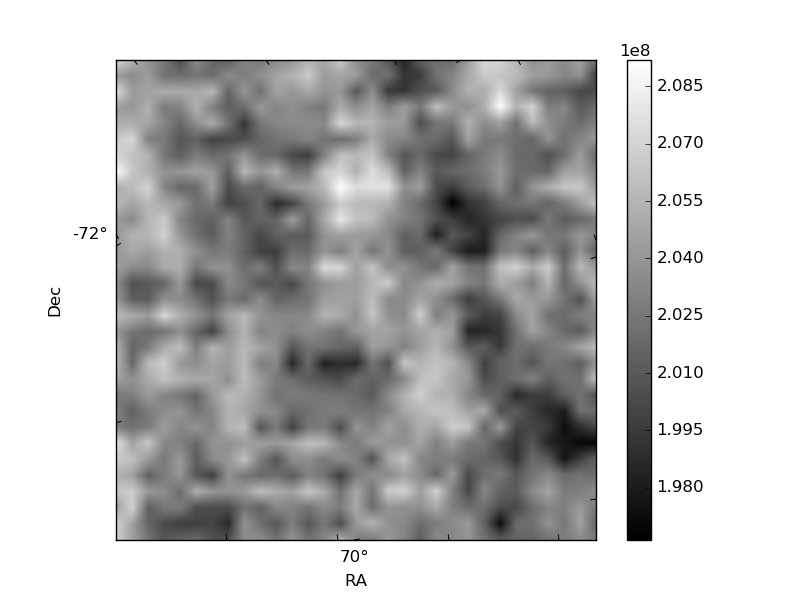
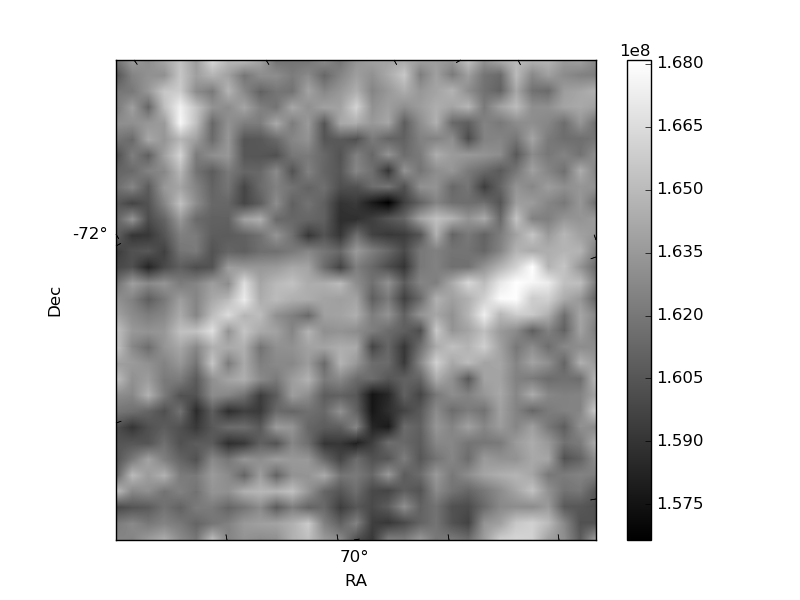
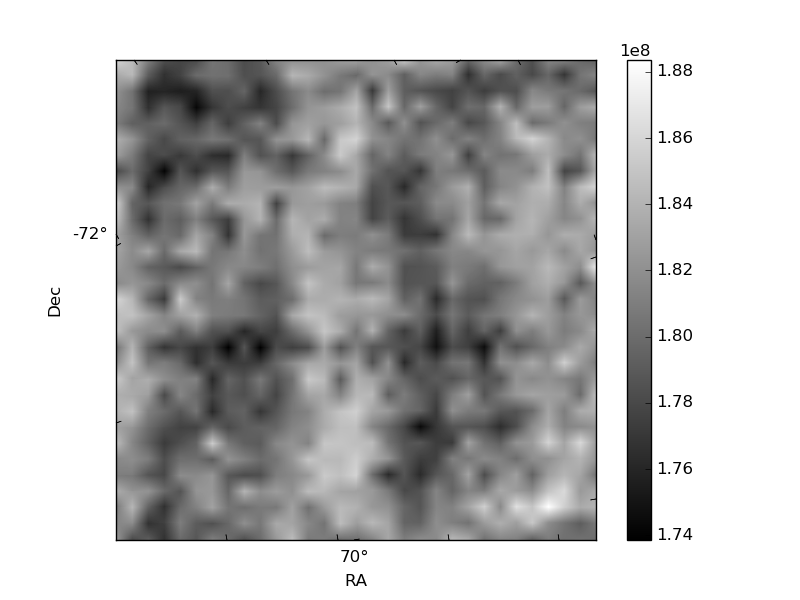
Histogram calculated using DETX and DETY for each event in the final _common_clean file
| Quadrant A | 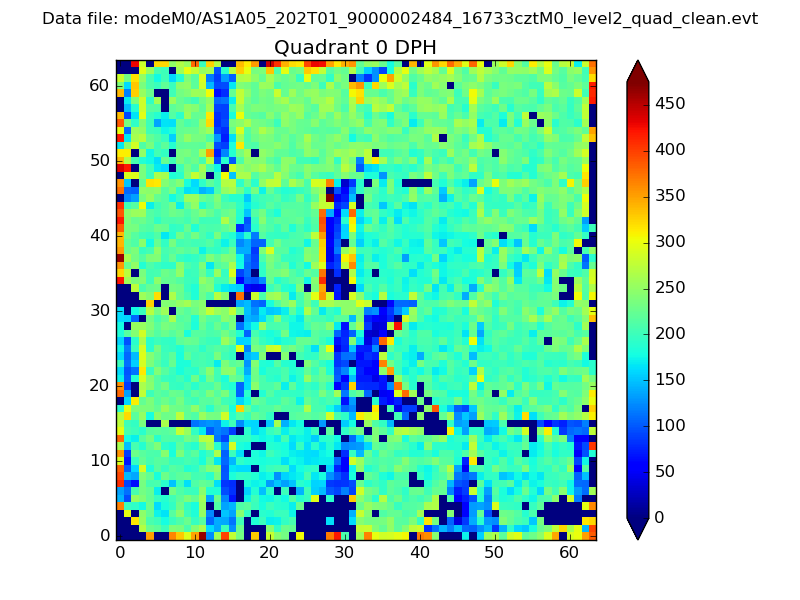 |
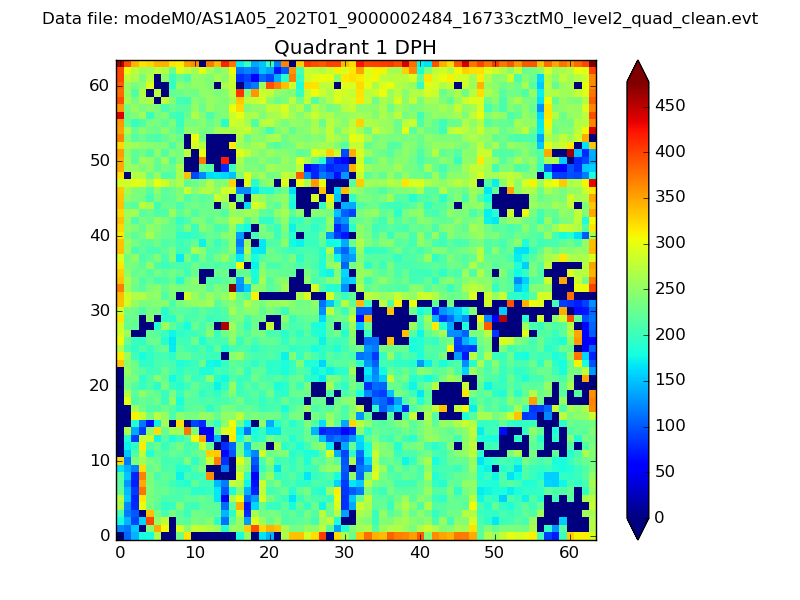 |
Quadrant B |
|---|---|---|---|
| Quadrant D | 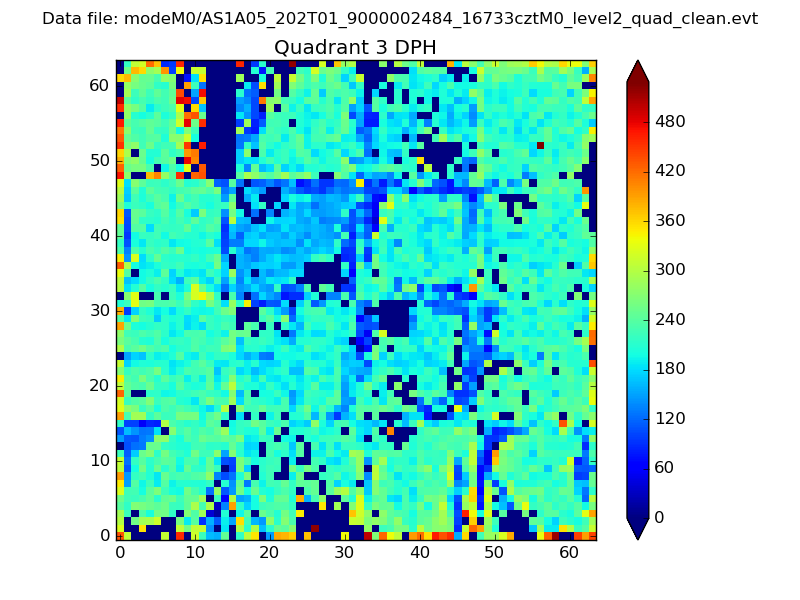 |
 |
Quadrant C |
| Plot type | Count rate plots | Images |
|---|---|---|
| Comparison with Poisson distribution Blue bars denote a histogram of data divided into 1 sec bins. Red curve is a Poisson curve with rate = median count rate of data. |
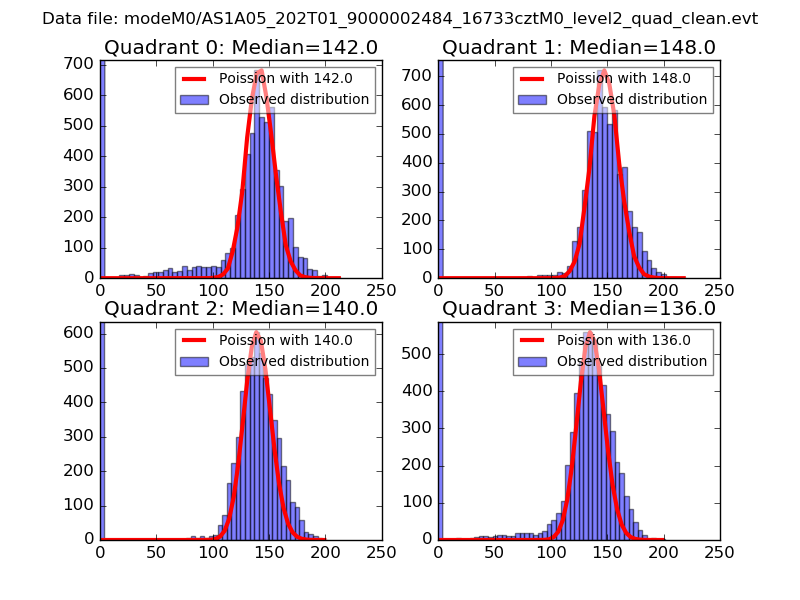 |
 |
| Quadrant-wise count rates Data is divided into 100 sec bins |
 |
|
| Module-wise count rates for Quadrant A Data is divided into 100 sec bins |
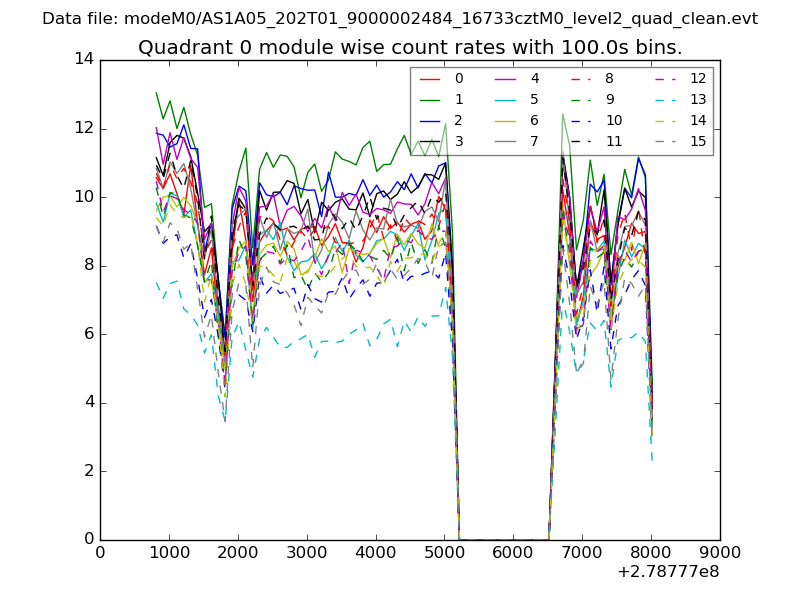 |
 |
| Module-wise count rates for Quadrant B Data is divided into 100 sec bins |
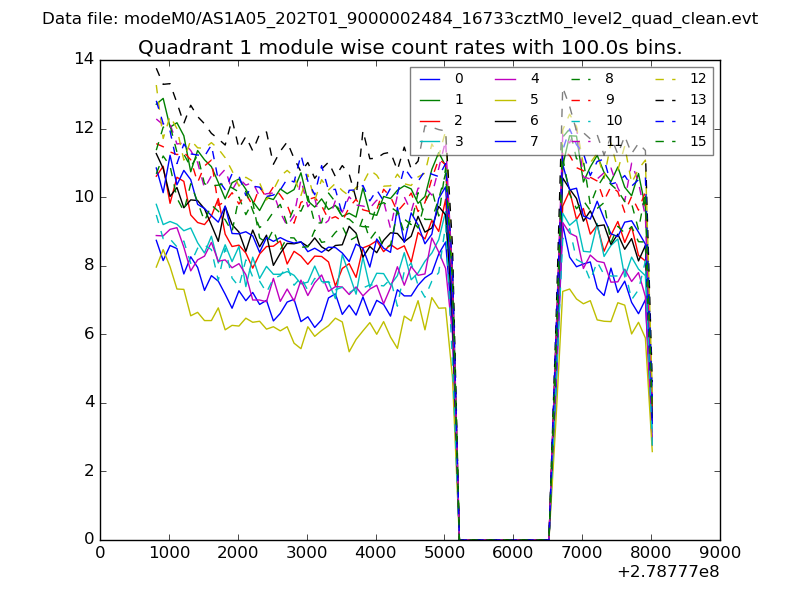 |
 |
| Module-wise count rates for Quadrant C Data is divided into 100 sec bins |
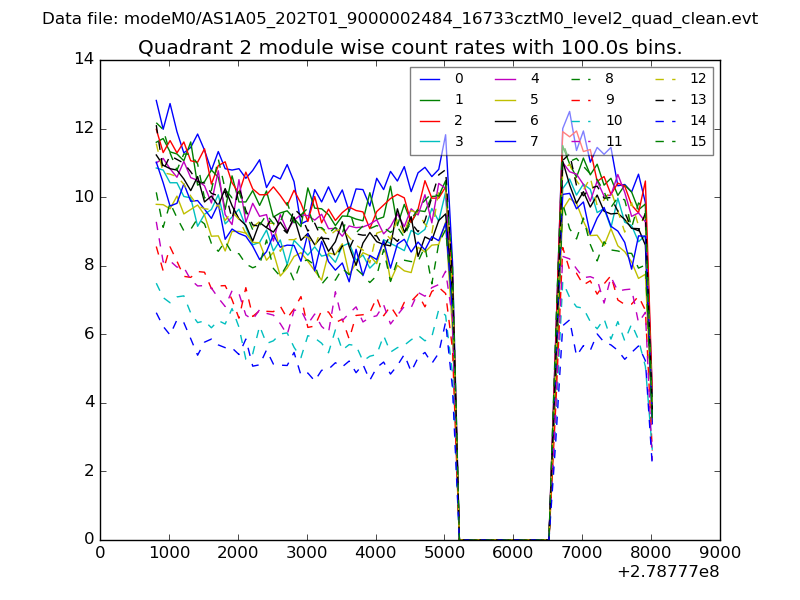 |
 |
| Module-wise count rates for Quadrant D Data is divided into 100 sec bins |
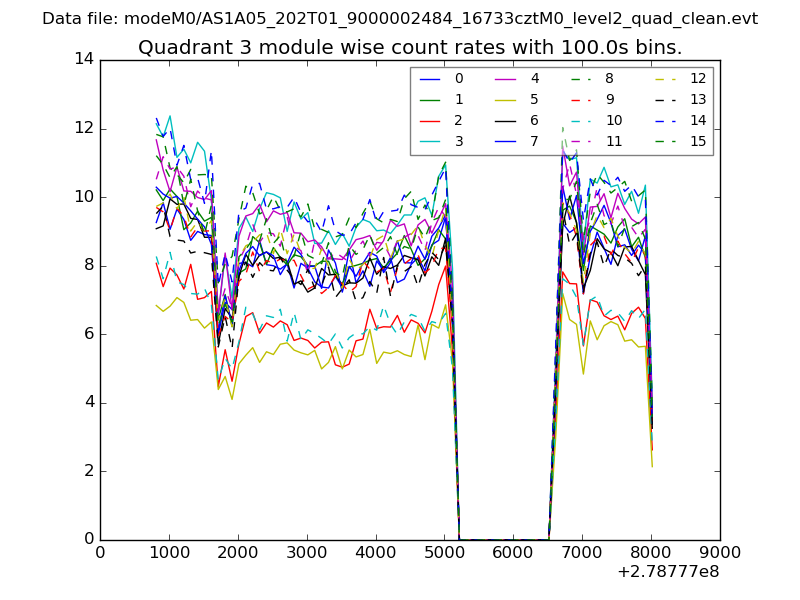 |
 |
| Parameter | Plot |
|---|---|
| CZT HV Monitor | 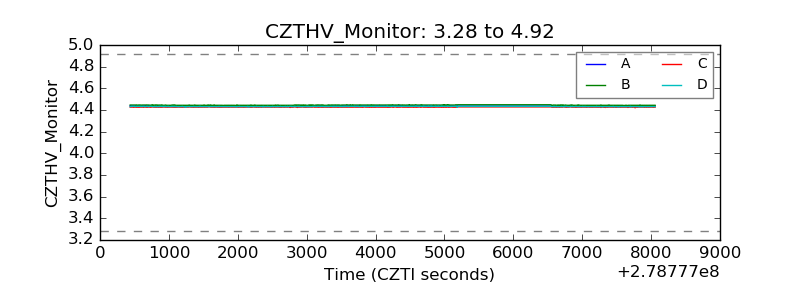 |
| D_VDD | 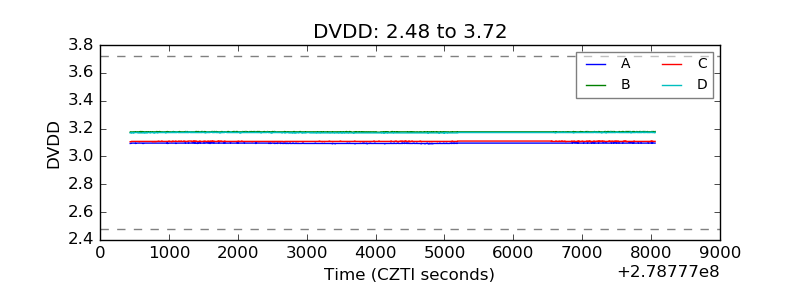 |
| Temperature 1 | 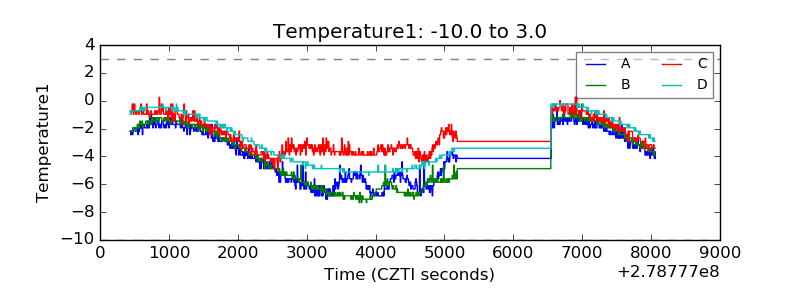 |
| Veto HV Monitor | 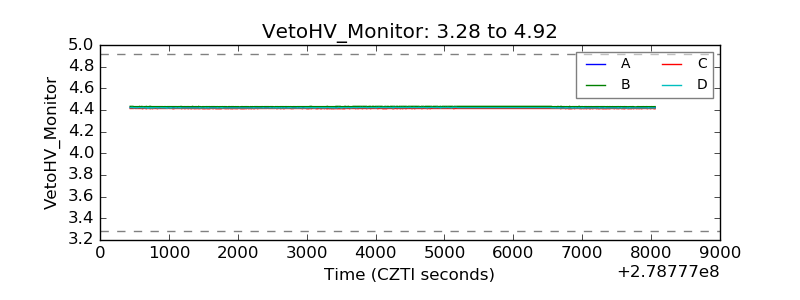 |
| Veto LLD | 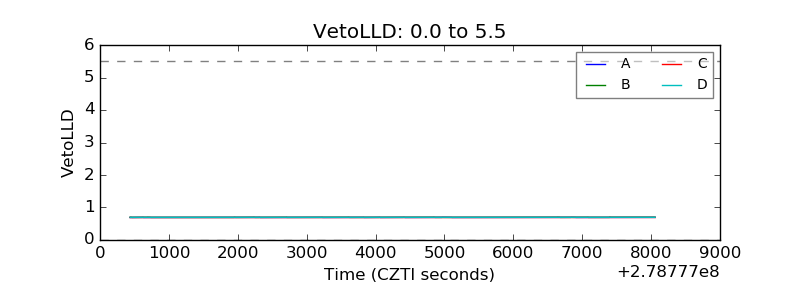 |
| Alpha Counter | 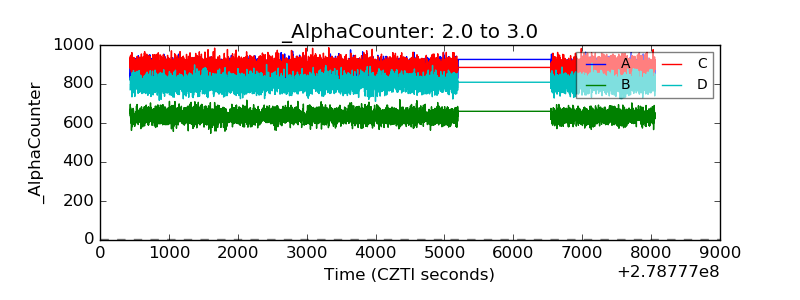 |
| _CPM_Rate | 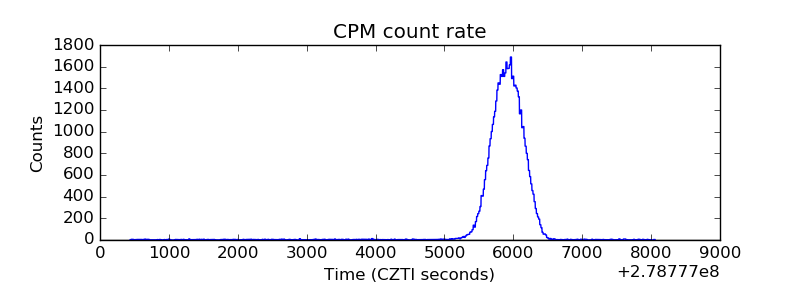 |
| CZT Counter |  |
| +2.5 Volts monitor |  |
| +5 Volts monitor |  |
| _ROLL_ROT | 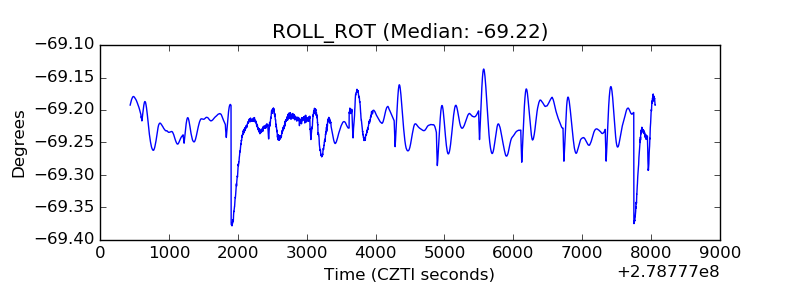 |
| _Roll_DEC | 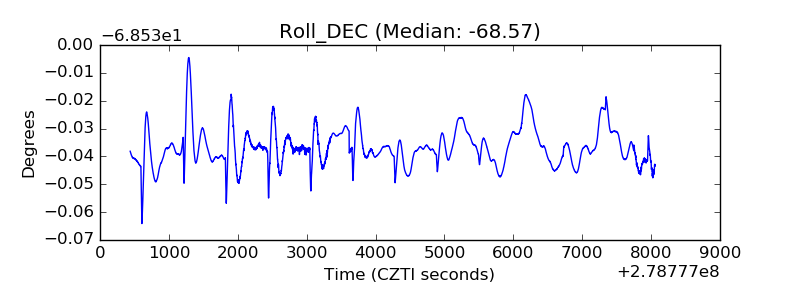 |
| _Roll_RA | 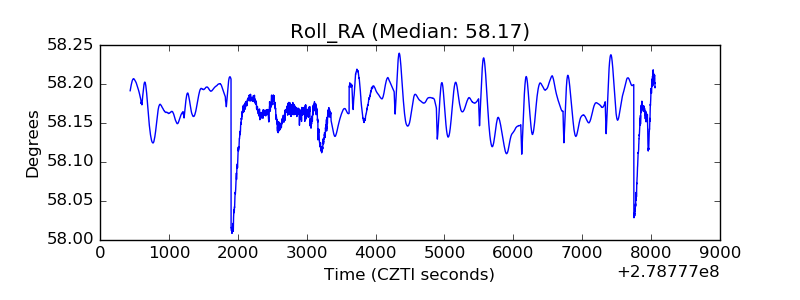 |
| Veto Counter | 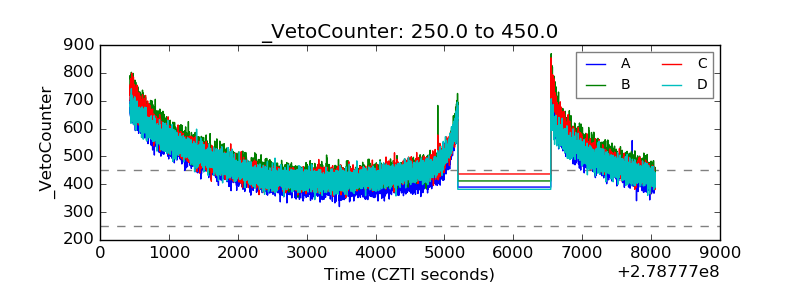 |