| Param | Original file | Final file |
|---|---|---|
| Filename | modeM0/AS1A05_202T01_9000002484_16734cztM0_level2.evt | modeM0/AS1A05_202T01_9000002484_16734cztM0_level2_quad_clean.evt |
| Size (bytes) | 625,155,840 | 127,293,120 |
| Size | 596.2 MB | 121.4 MB |
| Events in quadrant A | 6,438,796 | 836,615 |
| Events in quadrant B | 3,655,451 | 902,055 |
| Events in quadrant C | 3,302,973 | 856,159 |
| Events in quadrant D | 5,094,886 | 805,678 |
| Mode M0 | |||
|---|---|---|---|
| Quadrant | BADHDUFLAG | Total packets | Discarded packets |
| A | 0 | 23518 | 3 |
| B | 0 | 15127 | 2 |
| C | 0 | 13977 | 2 |
| D | 0 | 19574 | 2 |
| Mode M9 | |||
|---|---|---|---|
| Quadrant | BADHDUFLAG | Total packets | Discarded packets |
| A | 0 | 11 | 0 |
| B | 0 | 11 | 0 |
| C | 0 | 11 | 0 |
| D | 0 | 11 | 0 |
| Mode SS | |||
|---|---|---|---|
| Quadrant | BADHDUFLAG | Total packets | Discarded packets |
| A | 0 | 134 | 0 |
| B | 0 | 134 | 0 |
| C | 0 | 134 | 0 |
| D | 0 | 134 | 0 |
| Quadrant | Total seconds | Saturated seconds | Saturation percentage |
|---|---|---|---|
| A | 6506 | 990 | 15.216723% |
| B | 6506 | 135 | 2.075008% |
| C | 6506 | 85 | 1.306486% |
| D | 6507 | 496 | 7.622560% |
Noise dominated data is calculated using 1-second bins in cleaned event files. If a bin has >2000 counts, and if more than 50% of those come from <1% of pixels, then it is considered to be noise-dominated and hence unusable.
| Quadrant | # 1 sec bins | Bins with >0 counts | Bins with >2000 counts | High rate bins dominated by noise | Noise dominated (total time) | Noise dominated (detector-on time) | Marked lightcurve |
|---|---|---|---|---|---|---|---|
| A | 7677 | 6508 | 607 | 607 | 7.91% | 9.33% | 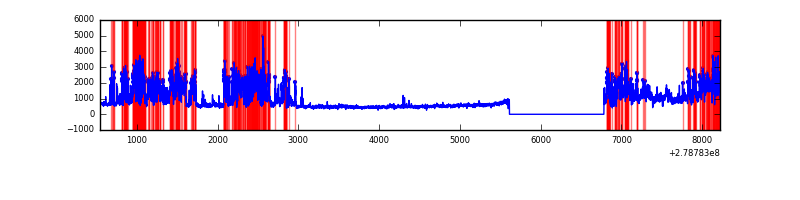 |
| B | 7677 | 6508 | 21 | 21 | 0.27% | 0.32% | 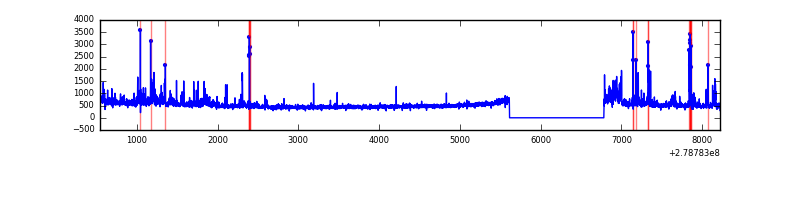 |
| C | 7677 | 6508 | 1 | 1 | 0.01% | 0.02% | 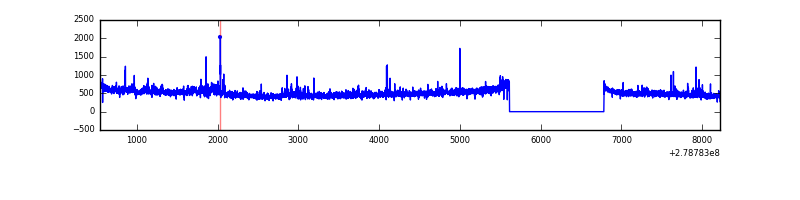 |
| D | 7678 | 6509 | 352 | 352 | 4.58% | 5.41% | 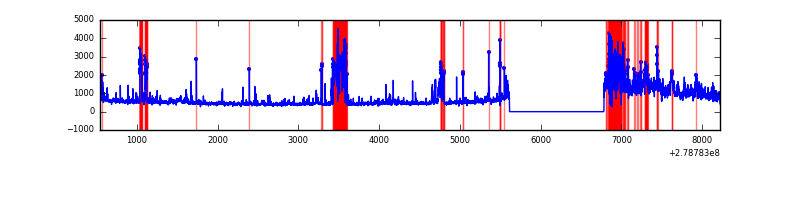 |
Top three noisy pixels from each quadrant. If the there are fewer than three noisy pixels in the level2.evt file, extra rows are filled as -1
| Pixel properties | Quadrant properties | ||||||
|---|---|---|---|---|---|---|---|
| Quadrant | DetID | PixID | Counts | Sigma | Mean | Median | Sigma |
| A | 15 | 174 | 2327033 | 14994.83 | 779 | 763 | 155.1 |
| A | 0 | 23 | 975800 | 6284.96 | 779 | 763 | 155.1 |
| A | 10 | 234 | 68885 | 439.11 | 779 | 763 | 155.1 |
| B | 7 | 220 | 122101 | 812.6 | 811 | 792 | 149.3 |
| B | 15 | 35 | 69859 | 462.65 | 811 | 792 | 149.3 |
| B | 5 | 236 | 66570 | 440.62 | 811 | 792 | 149.3 |
| C | 14 | 238 | 122111 | 689.83 | 769 | 774 | 175.9 |
| C | 0 | 207 | 85443 | 481.36 | 769 | 774 | 175.9 |
| C | 3 | 233 | 48288 | 270.13 | 769 | 774 | 175.9 |
| D | 2 | 16 | 870545 | 4810.62 | 753 | 731 | 180.8 |
| D | 15 | 0 | 510199 | 2817.68 | 753 | 731 | 180.8 |
| D | 5 | 222 | 477519 | 2636.94 | 753 | 731 | 180.8 |
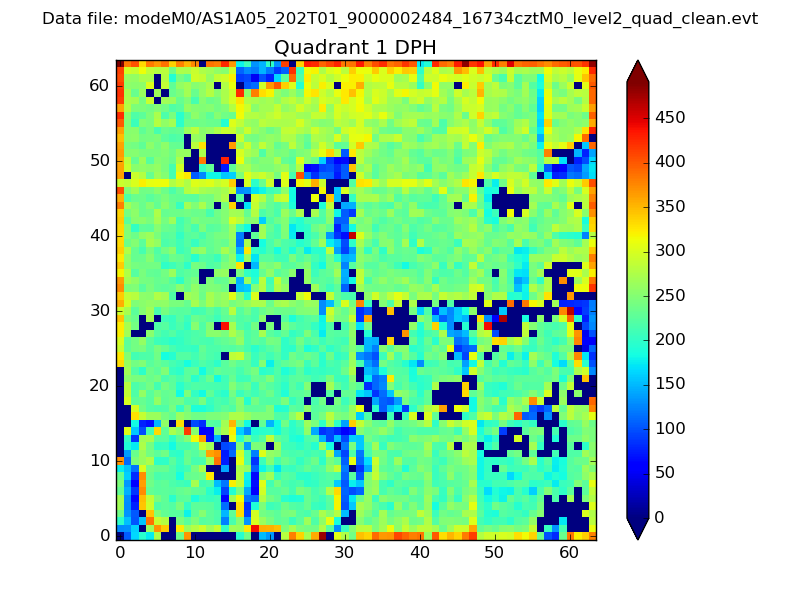
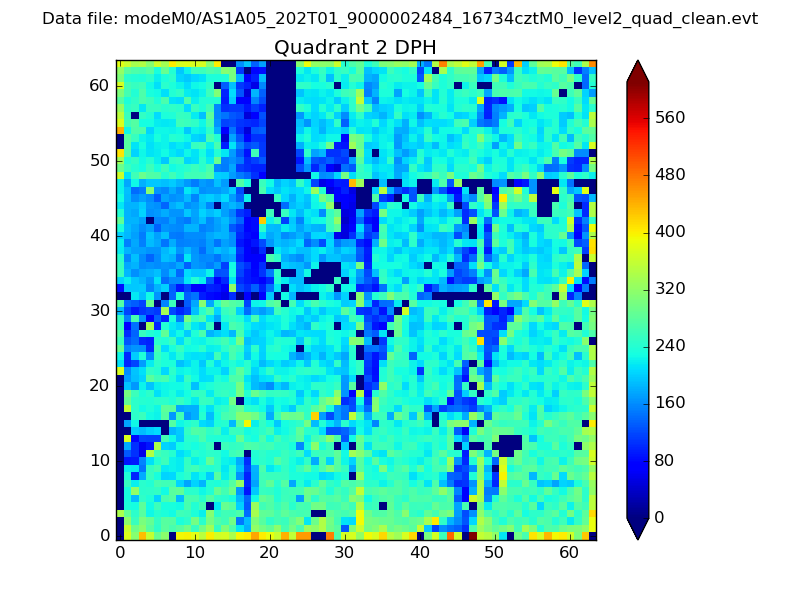
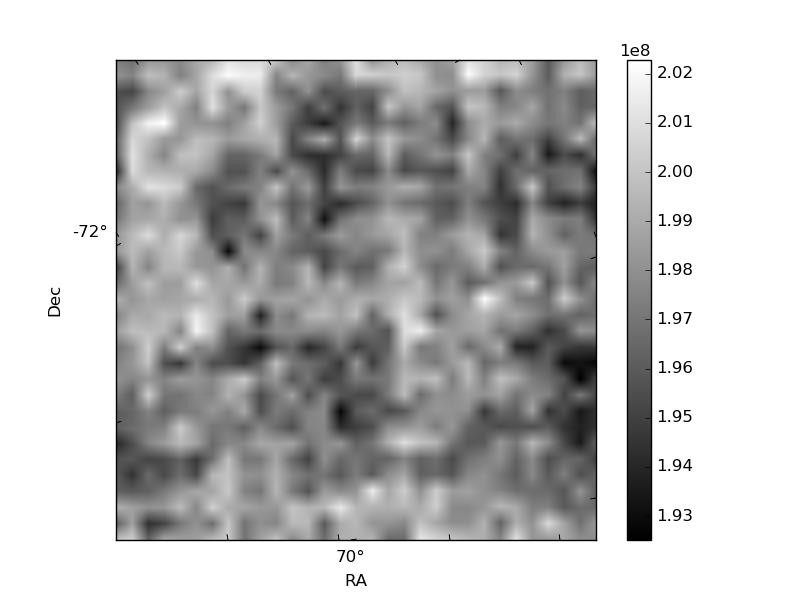
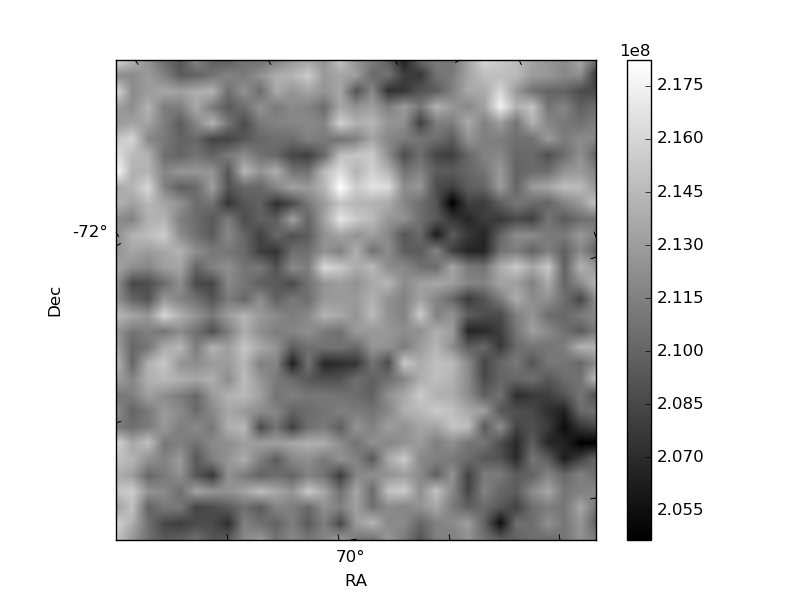
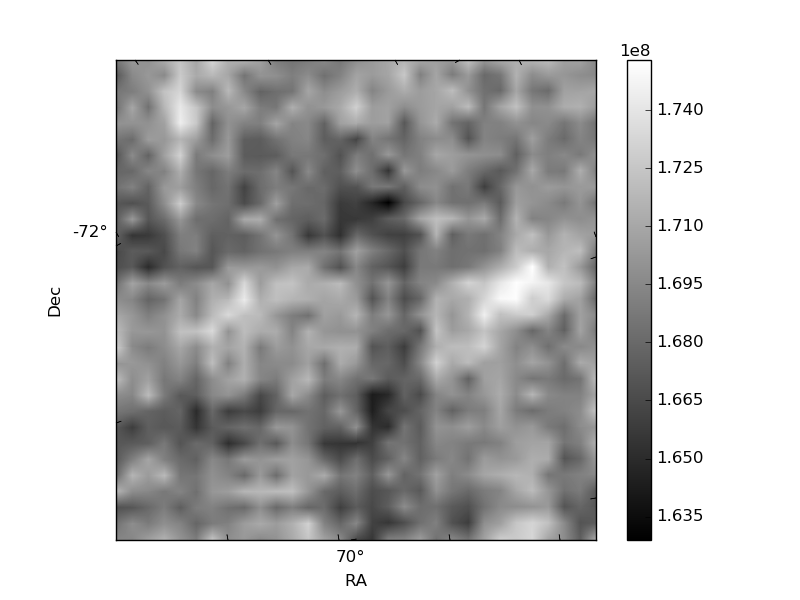
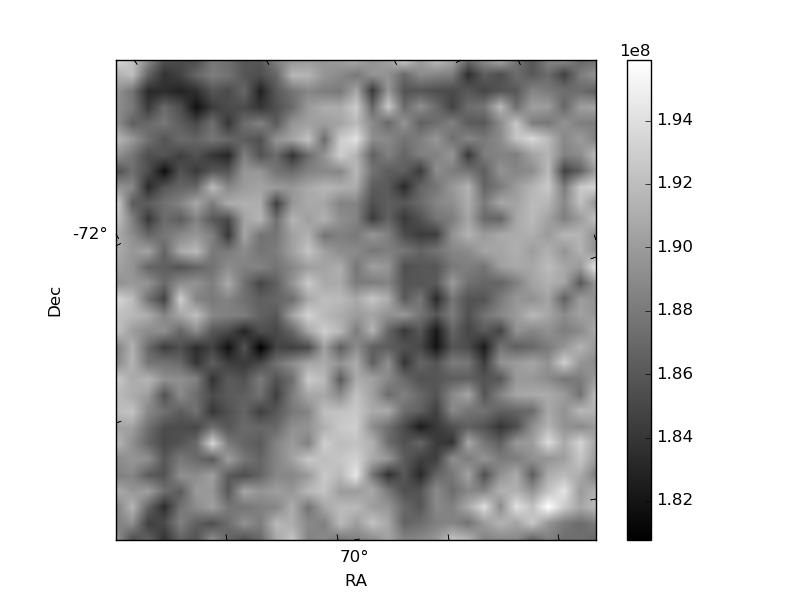
Histogram calculated using DETX and DETY for each event in the final _common_clean file
| Quadrant A |  |
 |
Quadrant B |
|---|---|---|---|
| Quadrant D | 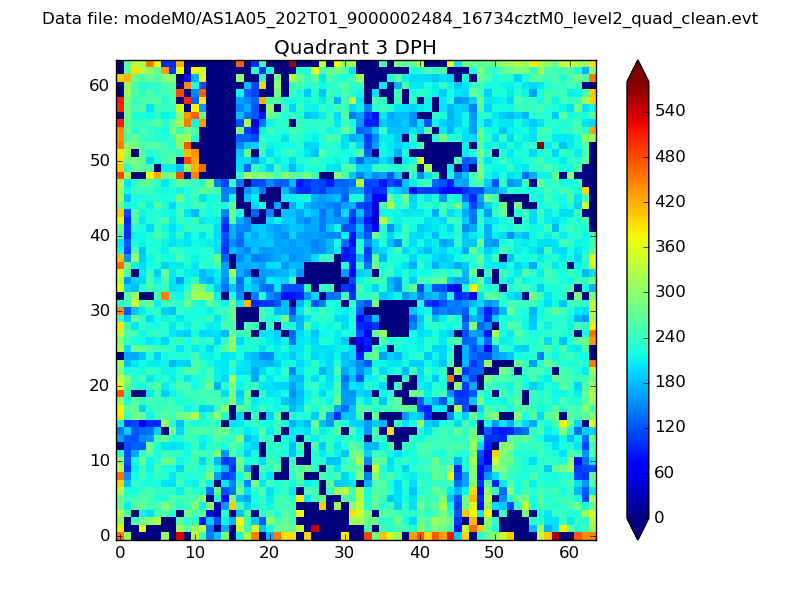 |
 |
Quadrant C |
| Plot type | Count rate plots | Images |
|---|---|---|
| Comparison with Poisson distribution Blue bars denote a histogram of data divided into 1 sec bins. Red curve is a Poisson curve with rate = median count rate of data. |
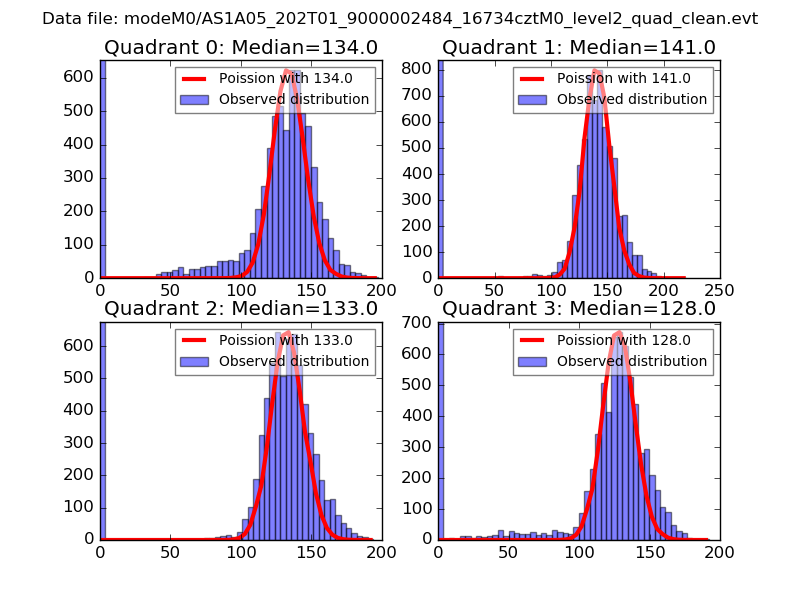 |
 |
| Quadrant-wise count rates Data is divided into 100 sec bins |
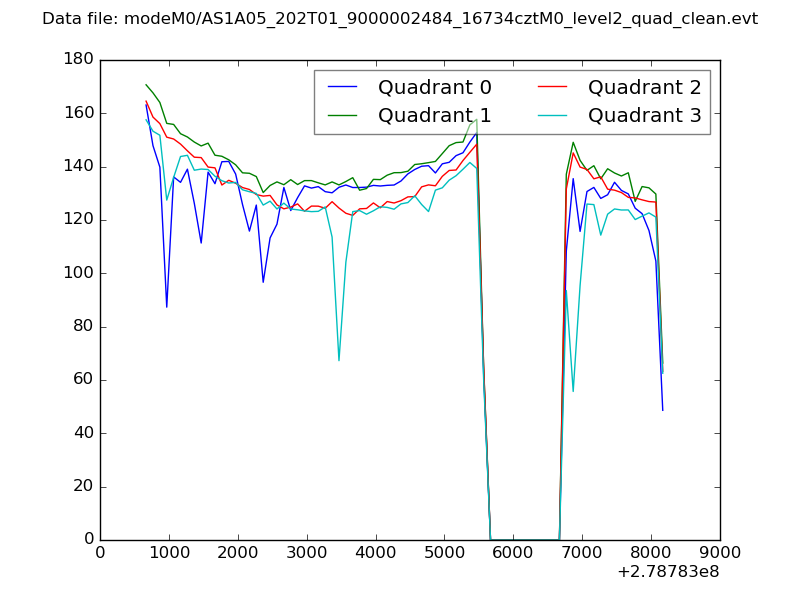 |
|
| Module-wise count rates for Quadrant A Data is divided into 100 sec bins |
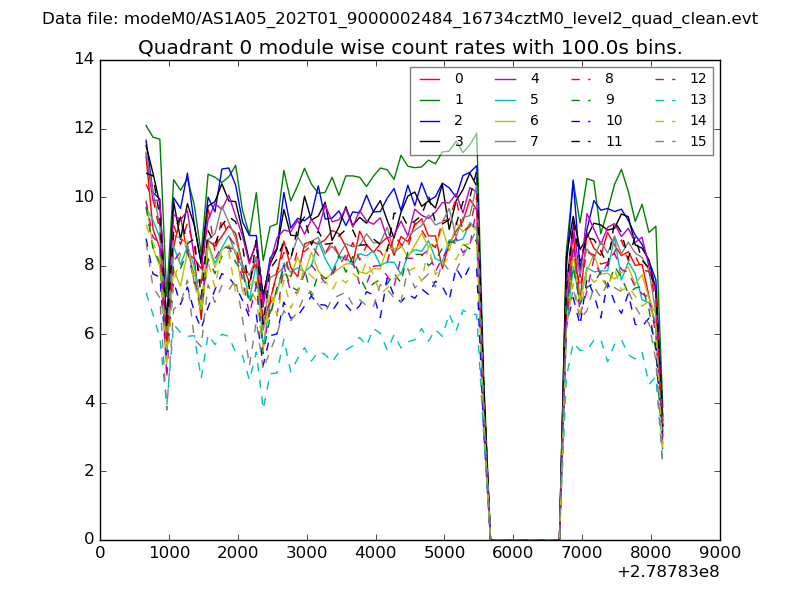 |
 |
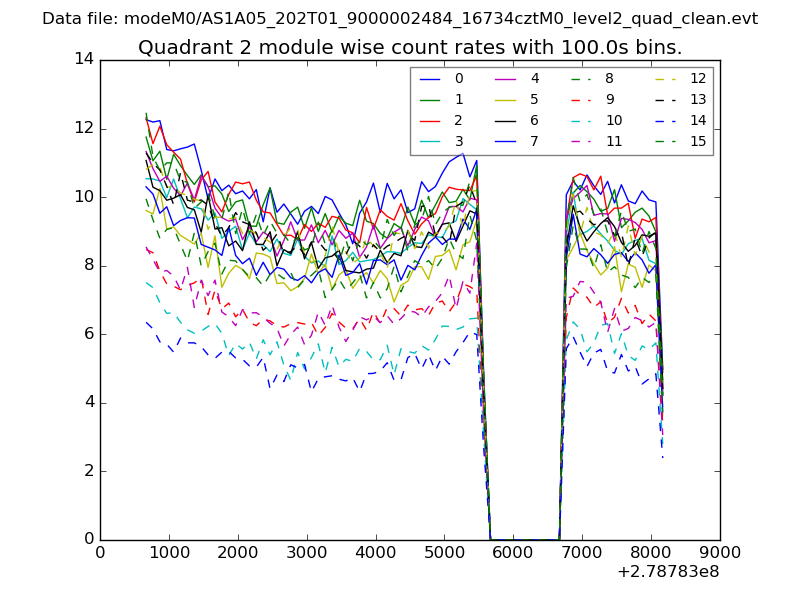
| Module-wise count rates for Quadrant B Data is divided into 100 sec bins |
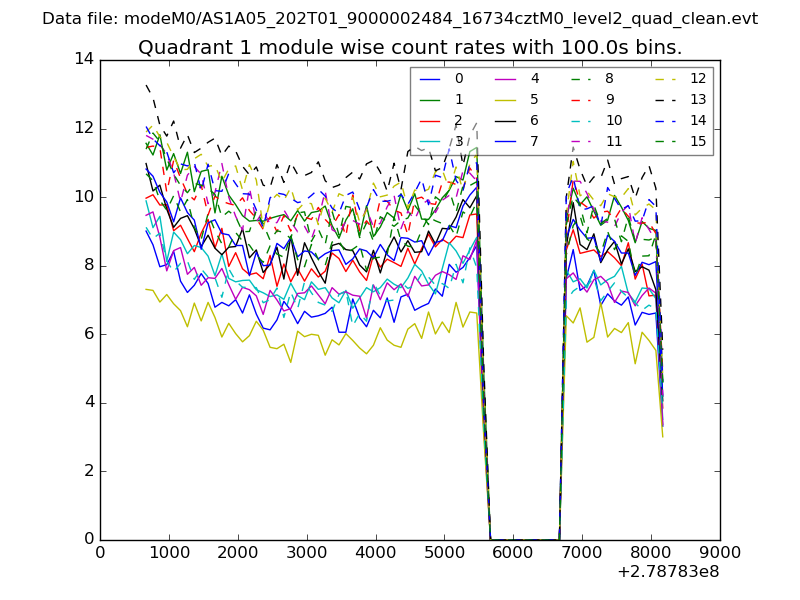 |
 |
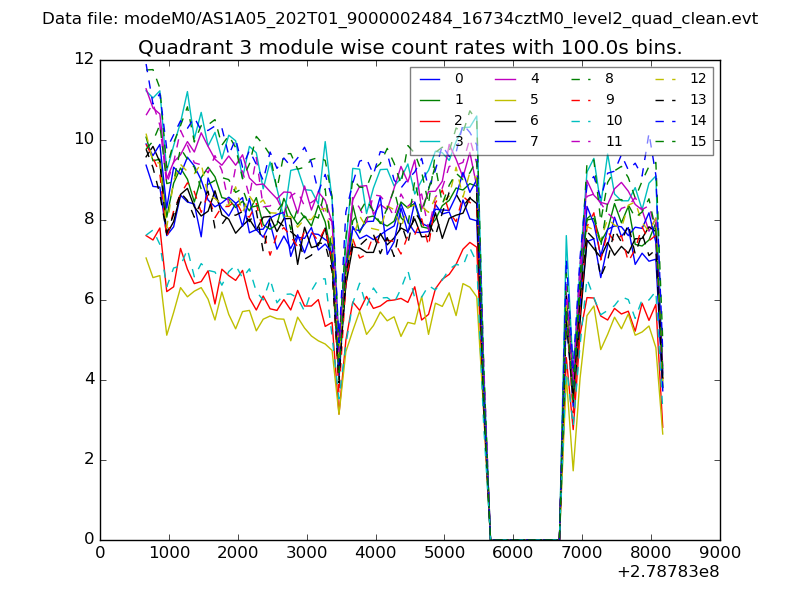
| Module-wise count rates for Quadrant C Data is divided into 100 sec bins |
 |
 |
| Module-wise count rates for Quadrant D Data is divided into 100 sec bins |
 |
 |
| Parameter | Plot |
|---|---|
| CZT HV Monitor | 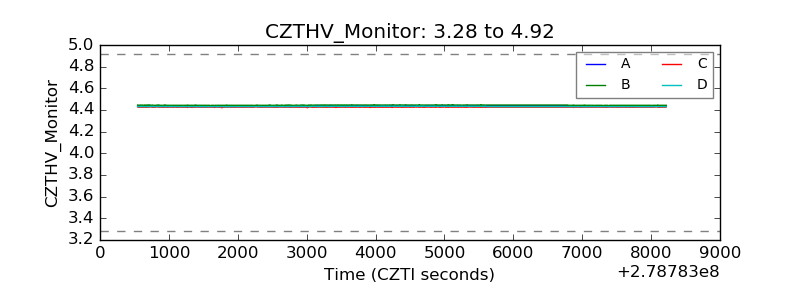 |
| D_VDD | 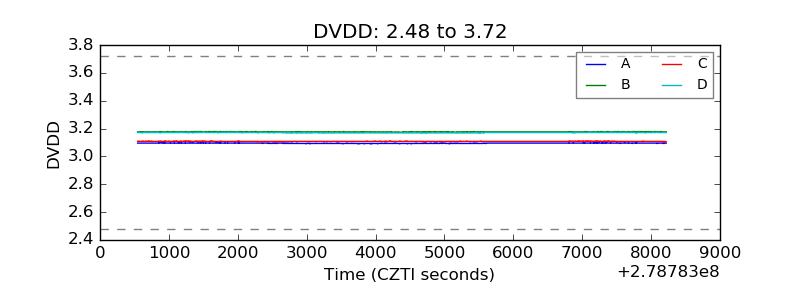 |
| Temperature 1 | 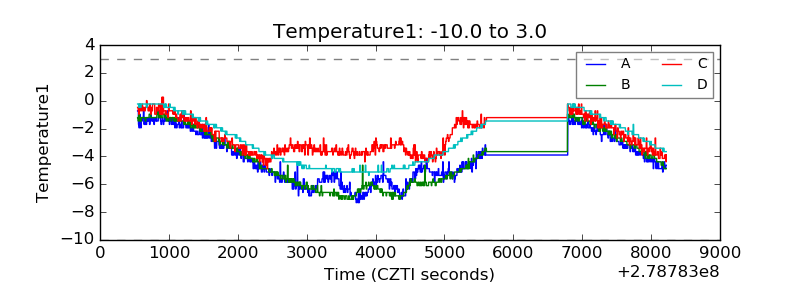 |
| Veto HV Monitor | 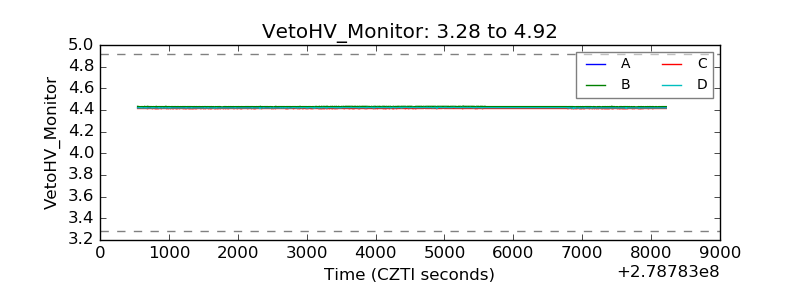 |
| Veto LLD |  |
| Alpha Counter | 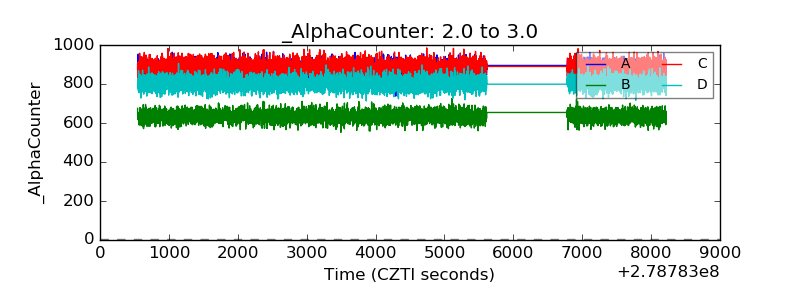 |
| _CPM_Rate | 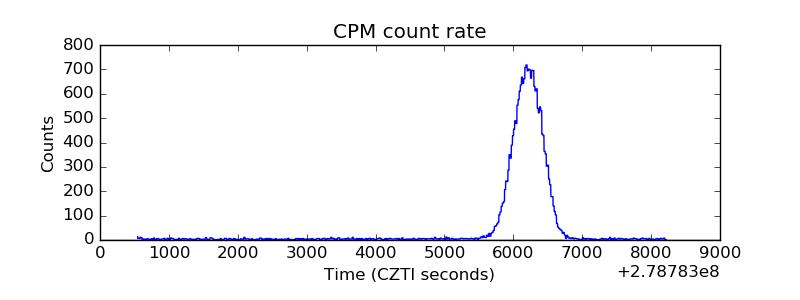 |
| CZT Counter | 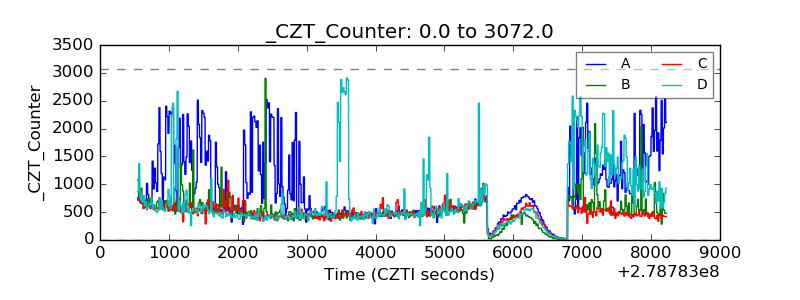 |
| +2.5 Volts monitor |  |
| +5 Volts monitor |  |
| _ROLL_ROT | 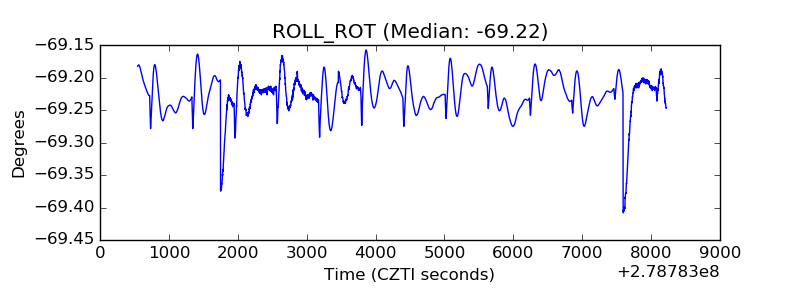 |
| _Roll_DEC | 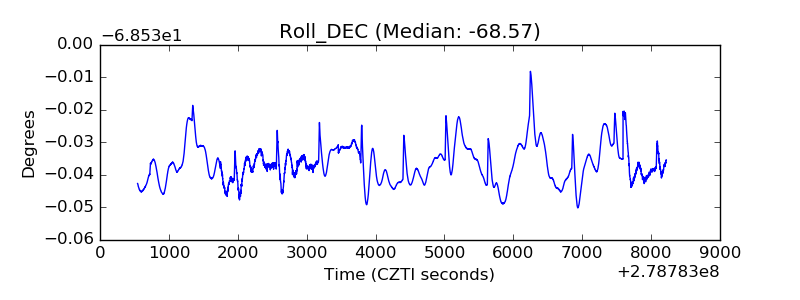 |
| _Roll_RA | 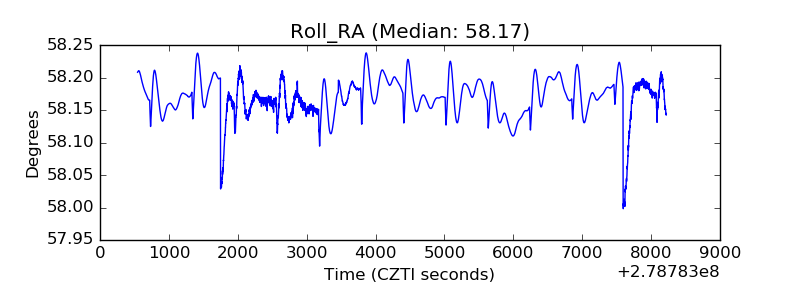 |
| Veto Counter | 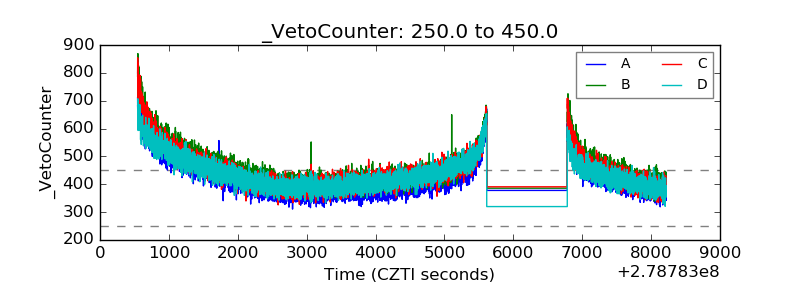 |