| Param | Original file | Final file |
|---|---|---|
| Filename | modeM0/AS1A05_202T01_9000002484_16735cztM0_level2.evt | modeM0/AS1A05_202T01_9000002484_16735cztM0_level2_quad_clean.evt |
| Size (bytes) | 779,811,840 | 118,195,200 |
| Size | 743.7 MB | 112.7 MB |
| Events in quadrant A | 7,252,656 | 777,332 |
| Events in quadrant B | 3,577,854 | 835,792 |
| Events in quadrant C | 3,183,465 | 800,064 |
| Events in quadrant D | 9,152,064 | 699,792 |
| Mode M0 | |||
|---|---|---|---|
| Quadrant | BADHDUFLAG | Total packets | Discarded packets |
| A | 0 | 26258 | 3 |
| B | 0 | 14997 | 2 |
| C | 0 | 13841 | 2 |
| D | 0 | 31937 | 2 |
| Mode M9 | |||
|---|---|---|---|
| Quadrant | BADHDUFLAG | Total packets | Discarded packets |
| A | 0 | 10 | 0 |
| B | 0 | 10 | 0 |
| C | 0 | 10 | 0 |
| D | 0 | 11 | 0 |
| Mode SS | |||
|---|---|---|---|
| Quadrant | BADHDUFLAG | Total packets | Discarded packets |
| A | 0 | 136 | 0 |
| B | 0 | 136 | 0 |
| C | 0 | 136 | 0 |
| D | 0 | 136 | 0 |
| Quadrant | Total seconds | Saturated seconds | Saturation percentage |
|---|---|---|---|
| A | 6683 | 949 | 14.200209% |
| B | 6683 | 102 | 1.526261% |
| C | 6683 | 58 | 0.867874% |
| D | 6683 | 1558 | 23.312883% |
Noise dominated data is calculated using 1-second bins in cleaned event files. If a bin has >2000 counts, and if more than 50% of those come from <1% of pixels, then it is considered to be noise-dominated and hence unusable.
| Quadrant | # 1 sec bins | Bins with >0 counts | Bins with >2000 counts | High rate bins dominated by noise | Noise dominated (total time) | Noise dominated (detector-on time) | Marked lightcurve |
|---|---|---|---|---|---|---|---|
| A | 7509 | 6685 | 569 | 569 | 7.58% | 8.51% | 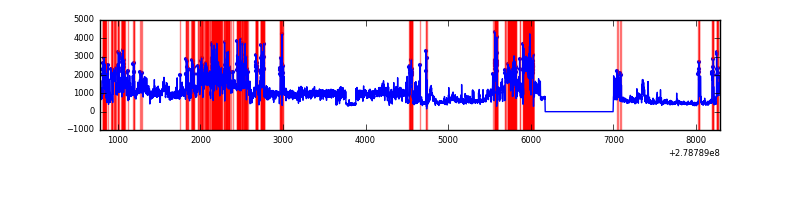 |
| B | 7509 | 6685 | 20 | 20 | 0.27% | 0.30% | 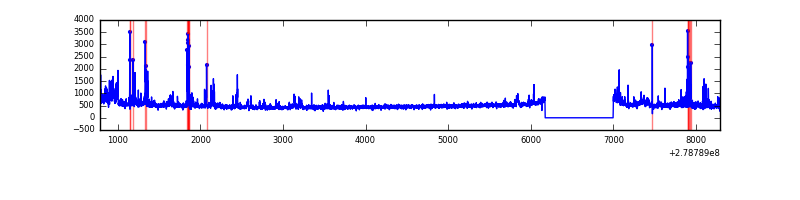 |
| C | 7509 | 6685 | 1 | 1 | 0.01% | 0.01% | 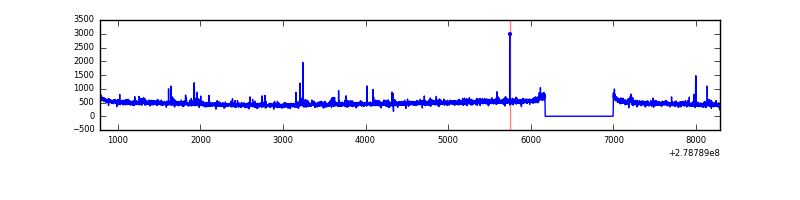 |
| D | 7509 | 6685 | 1156 | 1156 | 15.39% | 17.29% | 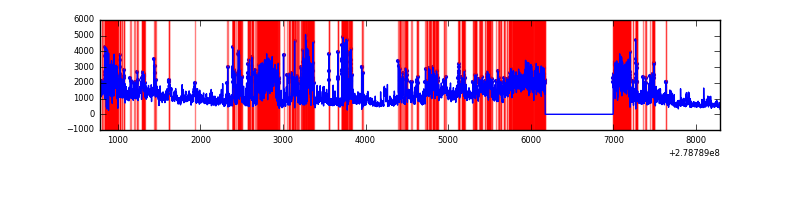 |
Top three noisy pixels from each quadrant. If the there are fewer than three noisy pixels in the level2.evt file, extra rows are filled as -1
| Pixel properties | Quadrant properties | ||||||
|---|---|---|---|---|---|---|---|
| Quadrant | DetID | PixID | Counts | Sigma | Mean | Median | Sigma |
| A | 15 | 174 | 2067724 | 13568.95 | 760 | 745 | 152.3 |
| A | 0 | 23 | 1948316 | 12785.08 | 760 | 745 | 152.3 |
| A | 10 | 234 | 186581 | 1219.94 | 760 | 745 | 152.3 |
| B | 15 | 35 | 122194 | 813.7 | 801 | 782 | 149.2 |
| B | 7 | 220 | 92993 | 618.0 | 801 | 782 | 149.2 |
| B | 4 | 216 | 57837 | 382.38 | 801 | 782 | 149.2 |
| C | 14 | 238 | 120915 | 682.01 | 763 | 766 | 176.2 |
| C | 0 | 207 | 75344 | 423.33 | 763 | 766 | 176.2 |
| C | 3 | 233 | 9969 | 52.24 | 763 | 766 | 176.2 |
| D | 1 | 52 | 3588994 | 21037.95 | 698 | 674 | 170.6 |
| D | 2 | 16 | 1578642 | 9251.47 | 698 | 674 | 170.6 |
| D | 5 | 222 | 625047 | 3660.64 | 698 | 674 | 170.6 |
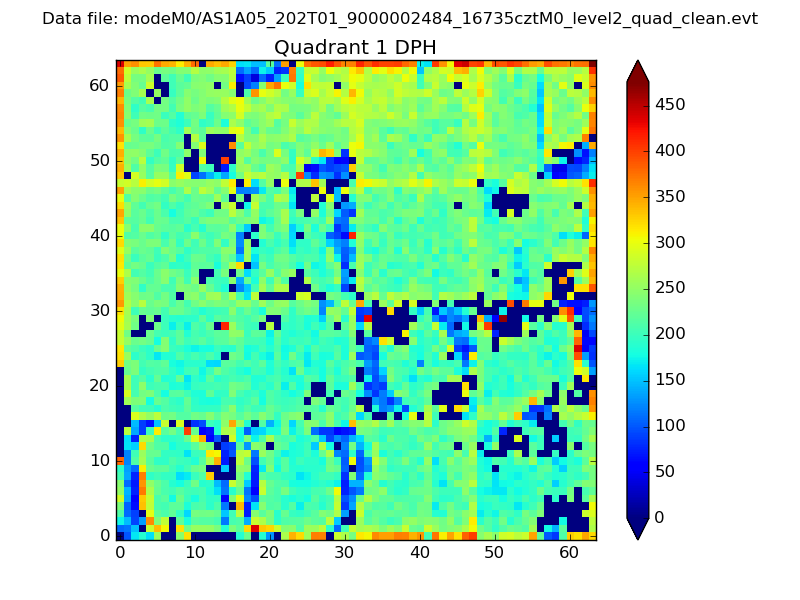
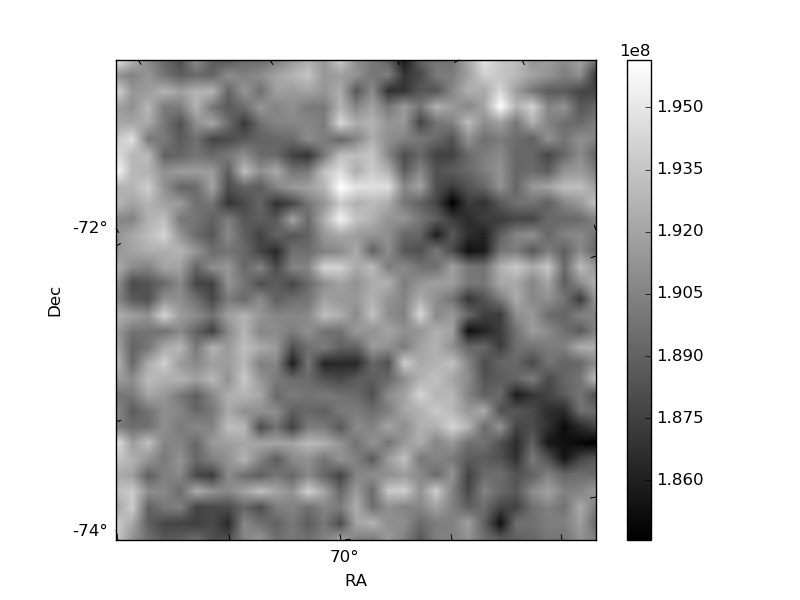
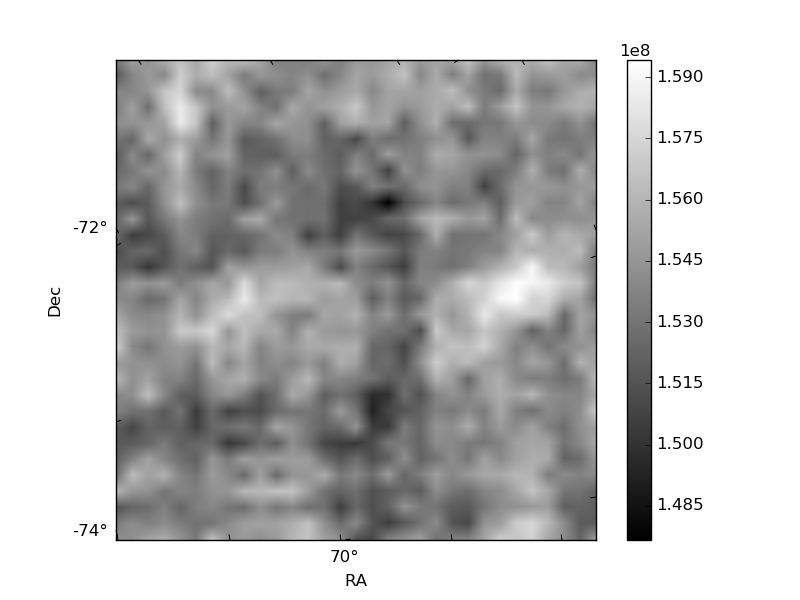
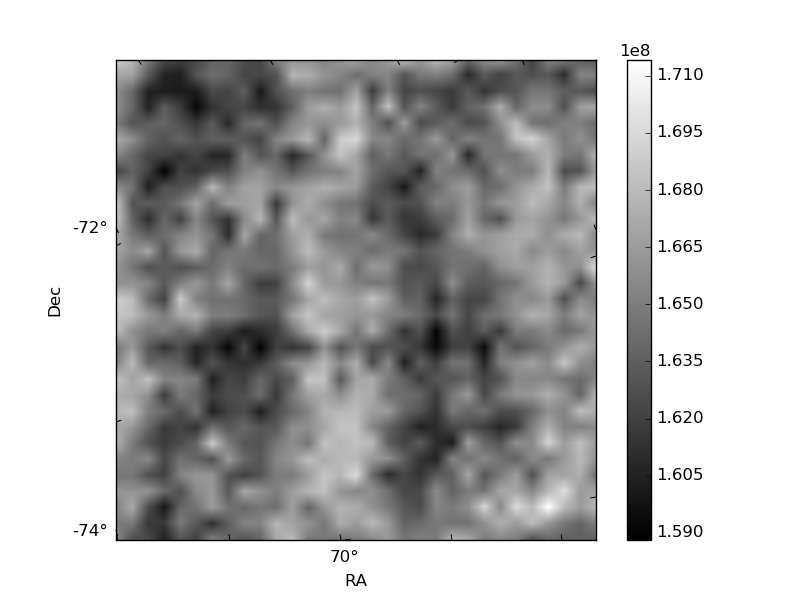
Histogram calculated using DETX and DETY for each event in the final _common_clean file
| Quadrant A |  |
 |
Quadrant B |
|---|---|---|---|
| Quadrant D | 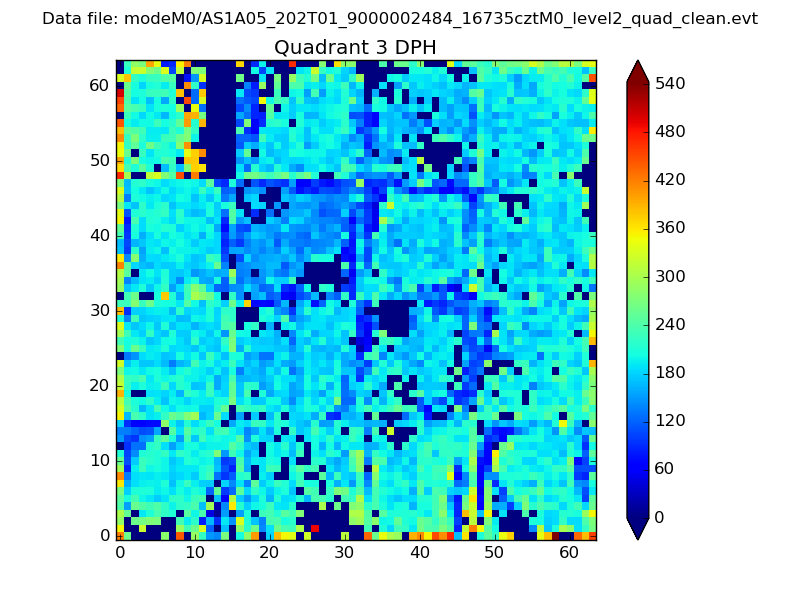 |
 |
Quadrant C |
| Plot type | Count rate plots | Images |
|---|---|---|
| Comparison with Poisson distribution Blue bars denote a histogram of data divided into 1 sec bins. Red curve is a Poisson curve with rate = median count rate of data. |
 |
 |
| Quadrant-wise count rates Data is divided into 100 sec bins |
 |
|
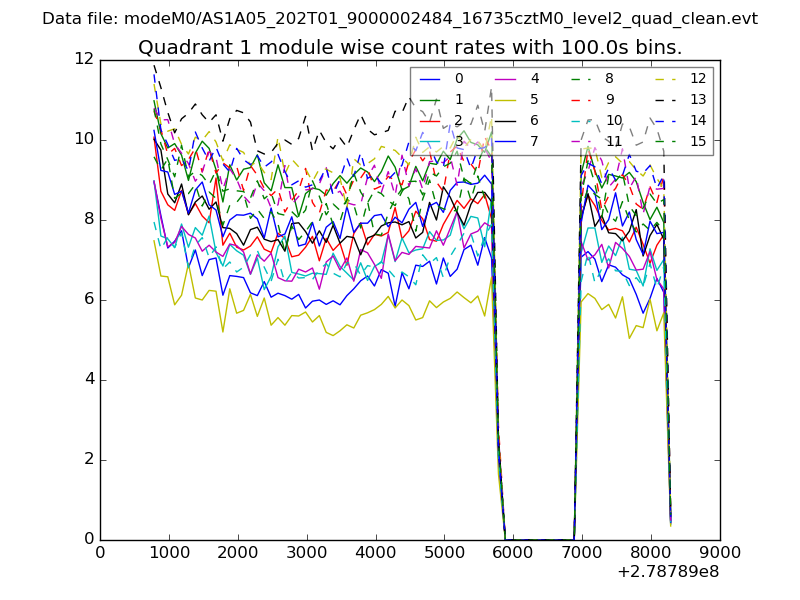
| Module-wise count rates for Quadrant A Data is divided into 100 sec bins |
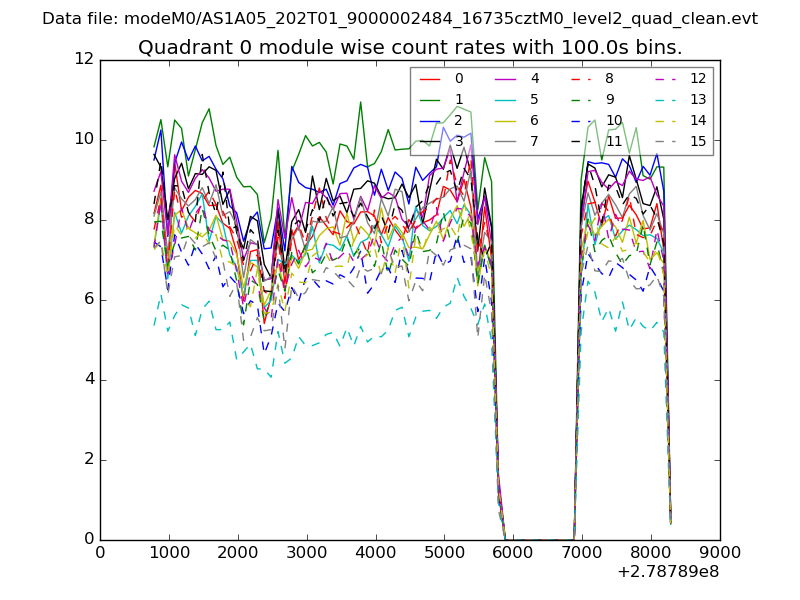 |
 |
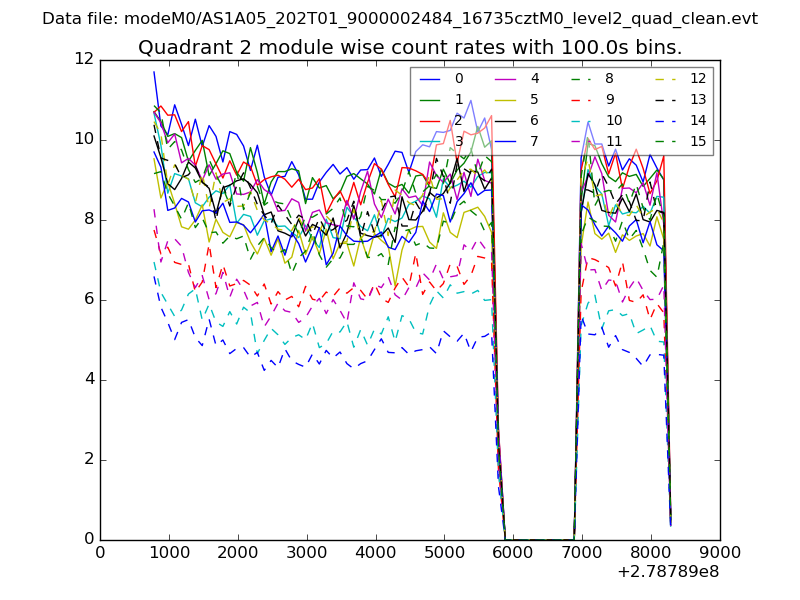
| Module-wise count rates for Quadrant B Data is divided into 100 sec bins |
 |
 |
| Module-wise count rates for Quadrant C Data is divided into 100 sec bins |
 |
 |
| Module-wise count rates for Quadrant D Data is divided into 100 sec bins |
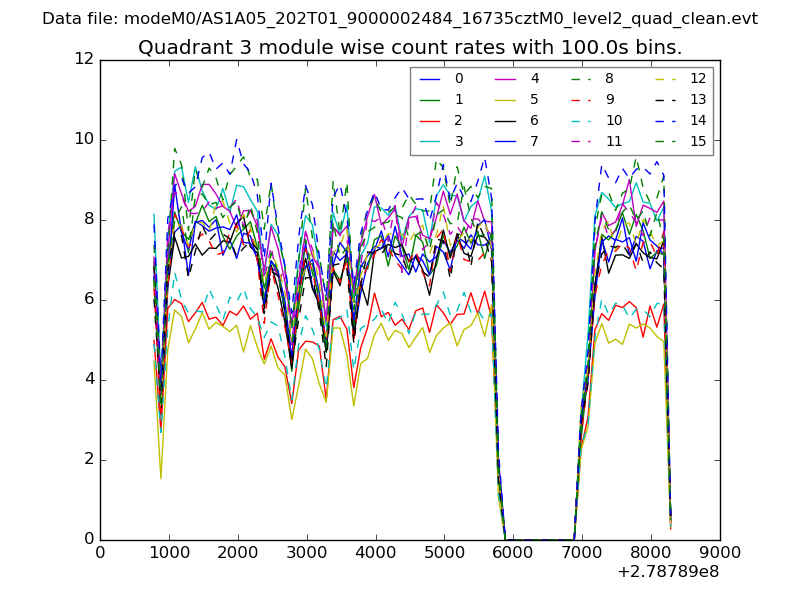 |
 |
| Parameter | Plot |
|---|---|
| CZT HV Monitor | 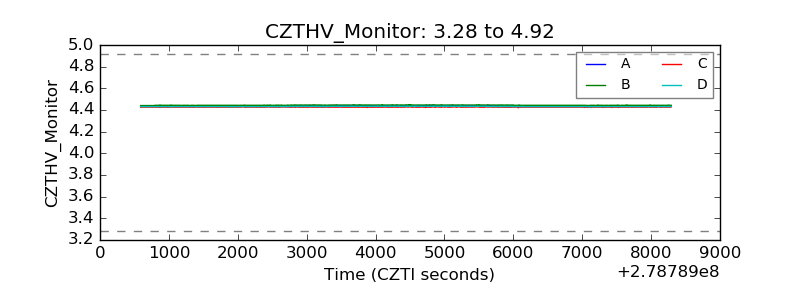 |
| D_VDD | 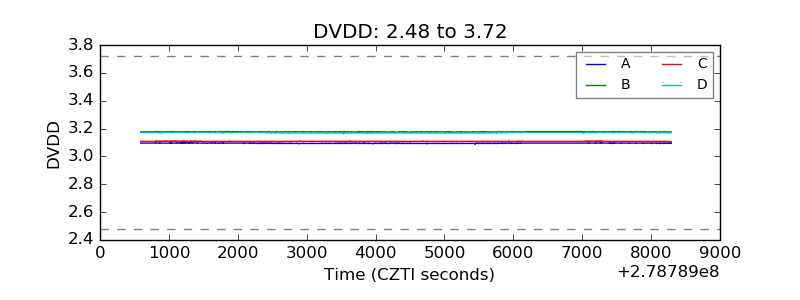 |
| Temperature 1 | 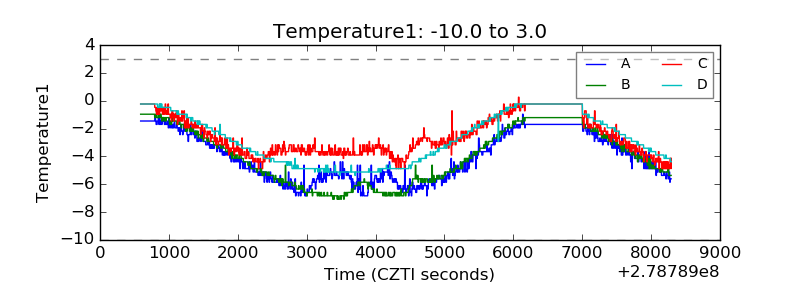 |
| Veto HV Monitor | 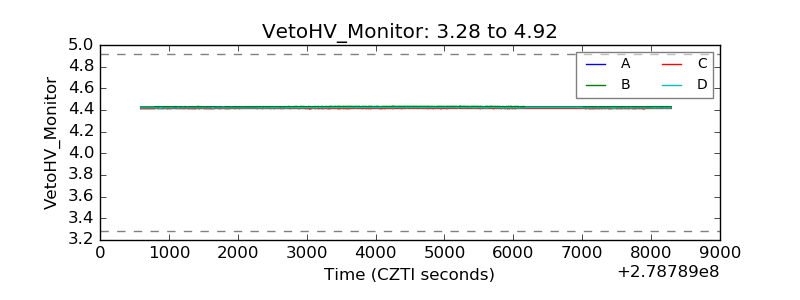 |
| Veto LLD | 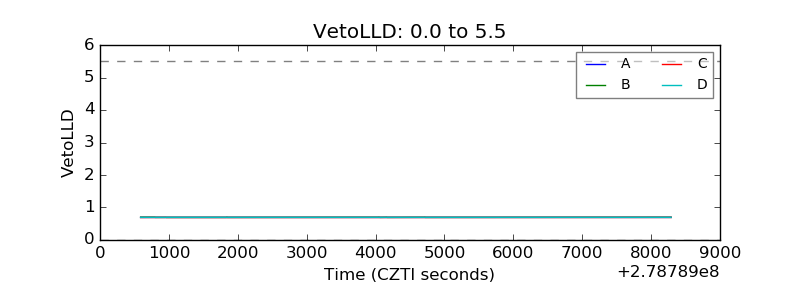 |
| Alpha Counter |  |
| _CPM_Rate | 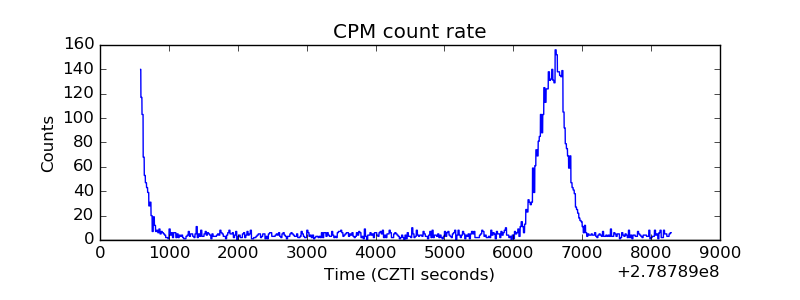 |
| CZT Counter | 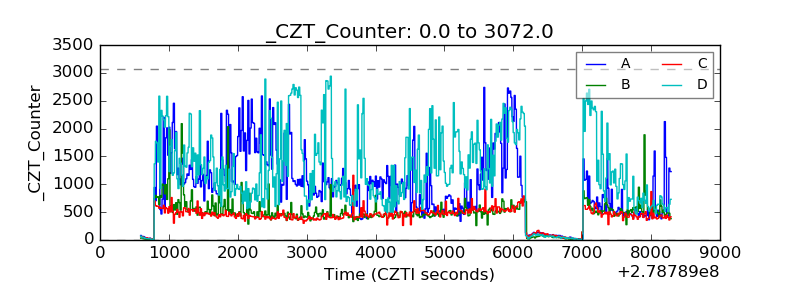 |
| +2.5 Volts monitor |  |
| +5 Volts monitor |  |
| _ROLL_ROT | 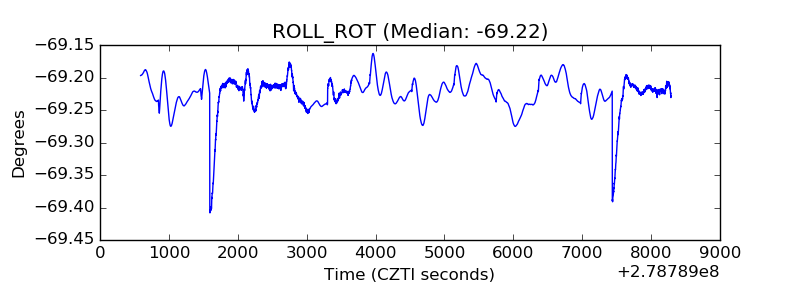 |
| _Roll_DEC | 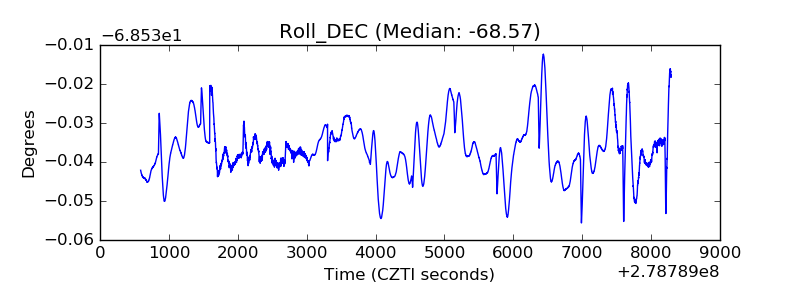 |
| _Roll_RA |  |
| Veto Counter | 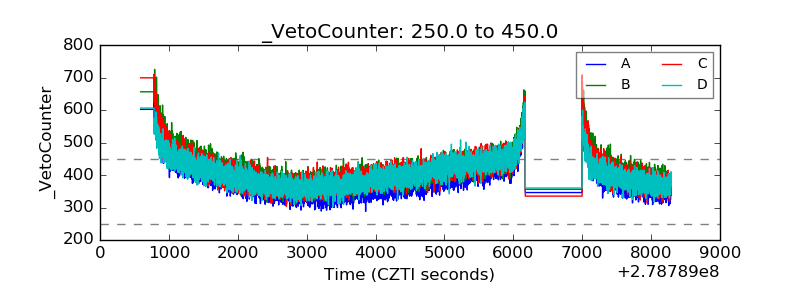 |