| Param | Original file | Final file |
|---|---|---|
| Filename | modeM0/AS1A05_202T01_9000002484_16736cztM0_level2.evt | modeM0/AS1A05_202T01_9000002484_16736cztM0_level2_quad_clean.evt |
| Size (bytes) | 616,668,480 | 125,328,960 |
| Size | 588.1 MB | 119.5 MB |
| Events in quadrant A | 5,259,853 | 810,739 |
| Events in quadrant B | 3,827,158 | 862,006 |
| Events in quadrant C | 3,431,091 | 824,579 |
| Events in quadrant D | 5,660,834 | 787,573 |
| Mode M0 | |||
|---|---|---|---|
| Quadrant | BADHDUFLAG | Total packets | Discarded packets |
| A | 0 | 20739 | 3 |
| B | 0 | 16196 | 2 |
| C | 0 | 15146 | 2 |
| D | 0 | 21983 | 2 |
| Mode M9 | |||
|---|---|---|---|
| Quadrant | BADHDUFLAG | Total packets | Discarded packets |
| A | 0 | 4 | 0 |
| B | 0 | 4 | 0 |
| C | 0 | 4 | 0 |
| D | 0 | 5 | 0 |
| Mode SS | |||
|---|---|---|---|
| Quadrant | BADHDUFLAG | Total packets | Discarded packets |
| A | 0 | 146 | 0 |
| B | 0 | 146 | 0 |
| C | 0 | 146 | 0 |
| D | 0 | 146 | 0 |
| Quadrant | Total seconds | Saturated seconds | Saturation percentage |
|---|---|---|---|
| A | 7337 | 647 | 8.818318% |
| B | 7337 | 121 | 1.649175% |
| C | 7337 | 81 | 1.103993% |
| D | 7337 | 451 | 6.146927% |
Noise dominated data is calculated using 1-second bins in cleaned event files. If a bin has >2000 counts, and if more than 50% of those come from <1% of pixels, then it is considered to be noise-dominated and hence unusable.
| Quadrant | # 1 sec bins | Bins with >0 counts | Bins with >2000 counts | High rate bins dominated by noise | Noise dominated (total time) | Noise dominated (detector-on time) | Marked lightcurve |
|---|---|---|---|---|---|---|---|
| A | 7688 | 7339 | 434 | 434 | 5.65% | 5.91% | 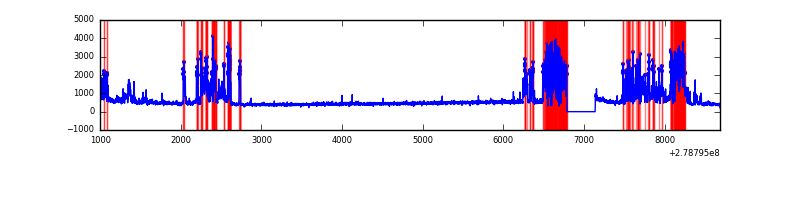 |
| B | 7688 | 7339 | 17 | 17 | 0.22% | 0.23% | 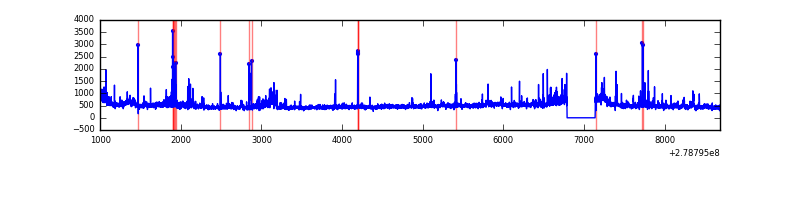 |
| C | 7688 | 7339 | 0 | 0 | 0.00% | 0.00% | 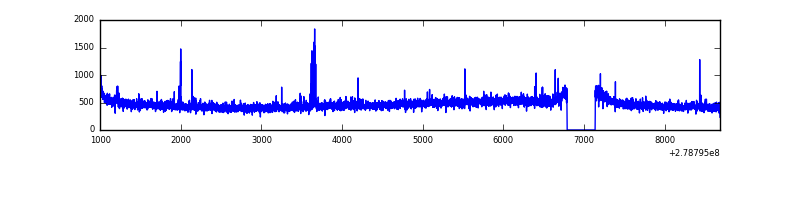 |
| D | 7688 | 7339 | 274 | 274 | 3.56% | 3.73% | 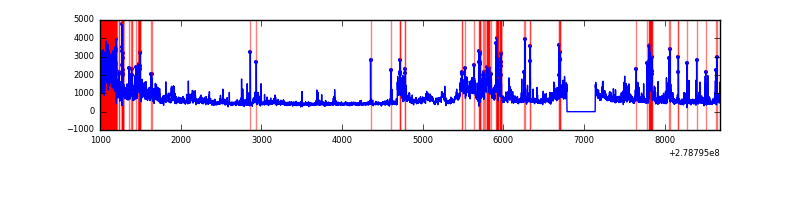 |
Top three noisy pixels from each quadrant. If the there are fewer than three noisy pixels in the level2.evt file, extra rows are filled as -1
| Pixel properties | Quadrant properties | ||||||
|---|---|---|---|---|---|---|---|
| Quadrant | DetID | PixID | Counts | Sigma | Mean | Median | Sigma |
| A | 15 | 174 | 1935411 | 11465.08 | 831 | 812 | 168.7 |
| A | 10 | 234 | 119088 | 700.94 | 831 | 812 | 168.7 |
| A | 3 | 1 | 11213 | 61.64 | 831 | 812 | 168.7 |
| B | 15 | 35 | 169791 | 1035.55 | 867 | 845 | 163.1 |
| B | 10 | 16 | 62831 | 379.94 | 867 | 845 | 163.1 |
| B | 7 | 220 | 44353 | 266.68 | 867 | 845 | 163.1 |
| C | 14 | 238 | 129505 | 670.15 | 827 | 829 | 192.0 |
| C | 0 | 207 | 59933 | 307.82 | 827 | 829 | 192.0 |
| C | 3 | 233 | 11027 | 53.11 | 827 | 829 | 192.0 |
| D | 1 | 52 | 1195281 | 6025.96 | 815 | 790 | 198.2 |
| D | 11 | 176 | 690498 | 3479.43 | 815 | 790 | 198.2 |
| D | 2 | 16 | 395822 | 1992.85 | 815 | 790 | 198.2 |
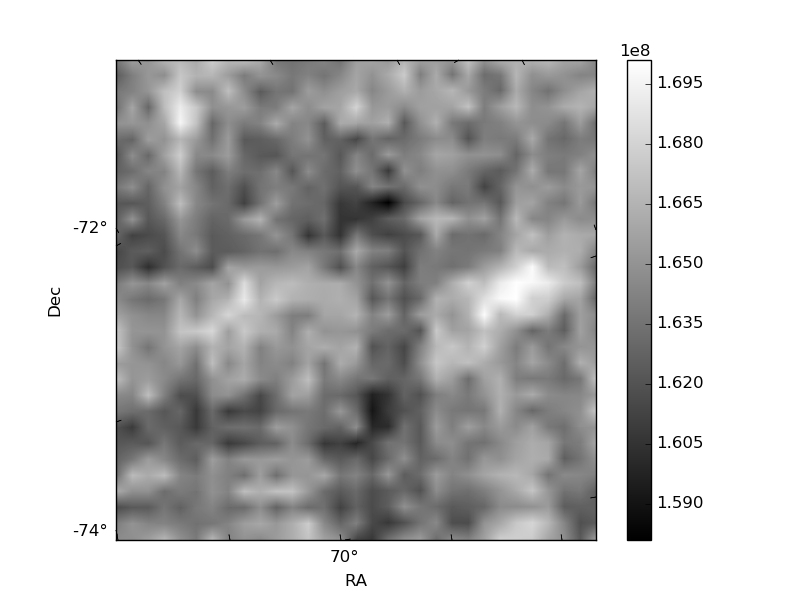
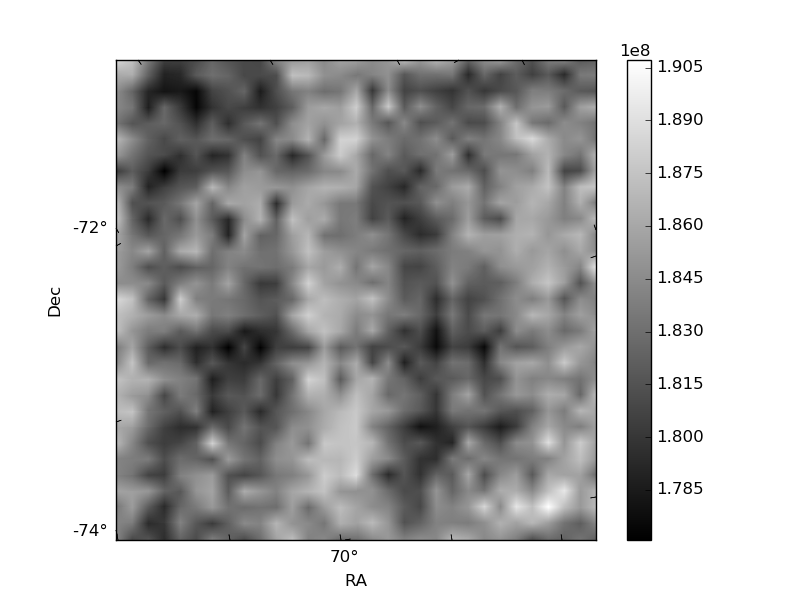
Histogram calculated using DETX and DETY for each event in the final _common_clean file
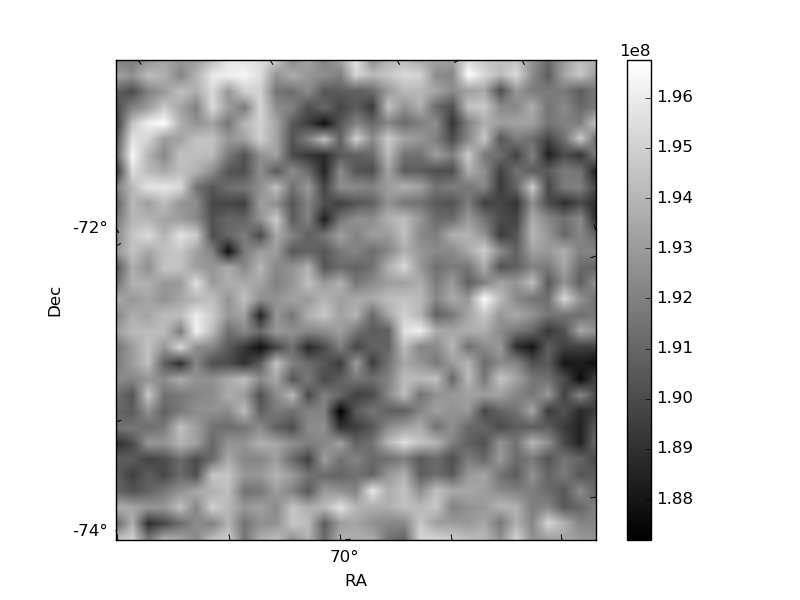
| Quadrant A |  |
 |
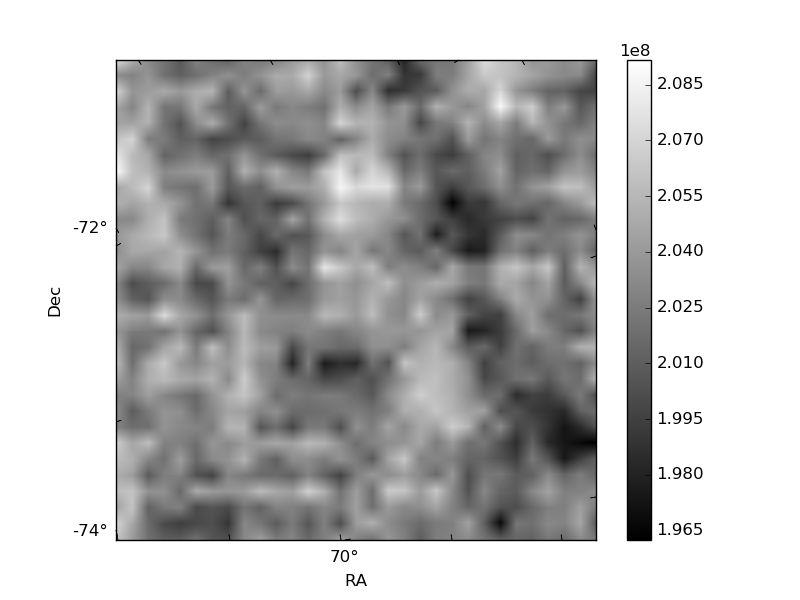
Quadrant B |
|---|---|---|---|
| Quadrant D | 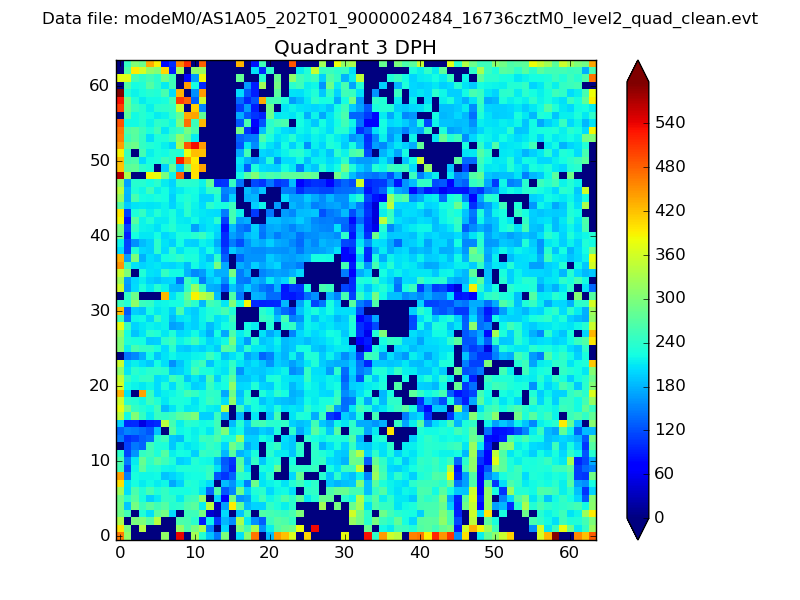 |
 |
Quadrant C |
| Plot type | Count rate plots | Images |
|---|---|---|
| Comparison with Poisson distribution Blue bars denote a histogram of data divided into 1 sec bins. Red curve is a Poisson curve with rate = median count rate of data. |
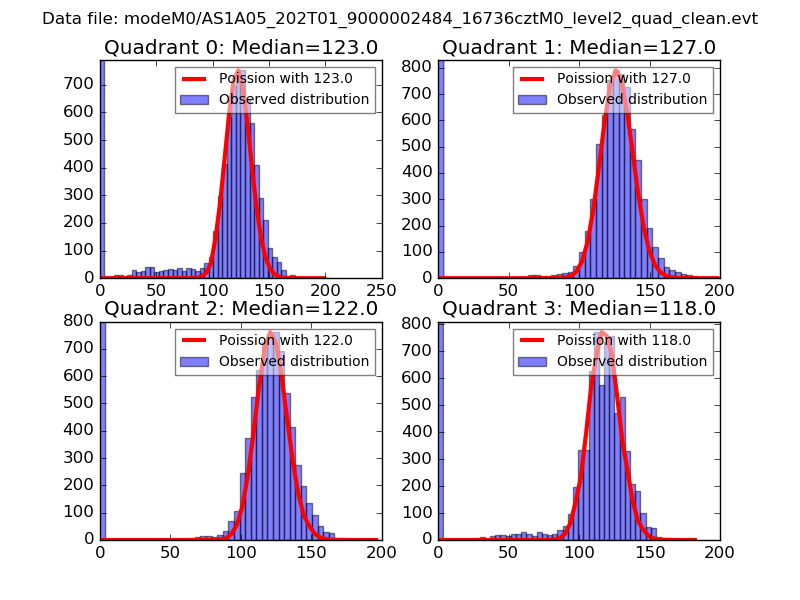 |
 |
| Quadrant-wise count rates Data is divided into 100 sec bins |
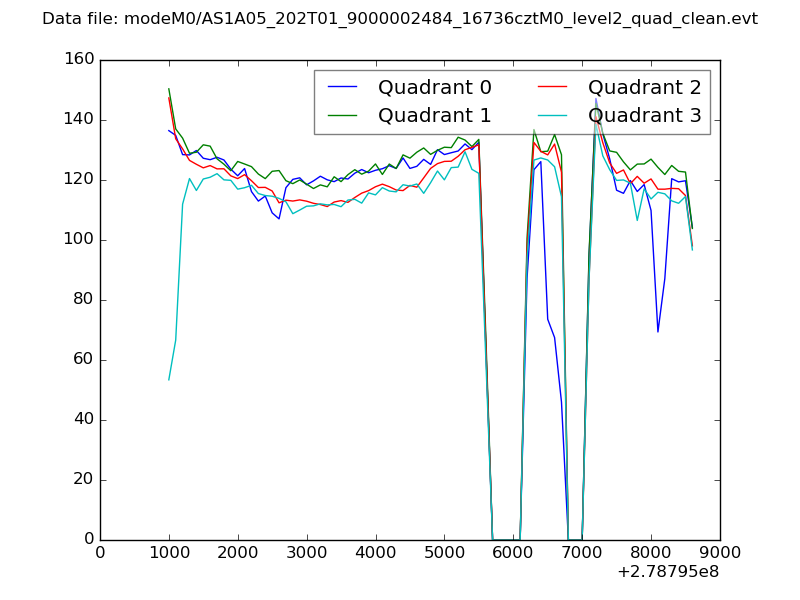 |
|
| Module-wise count rates for Quadrant A Data is divided into 100 sec bins |
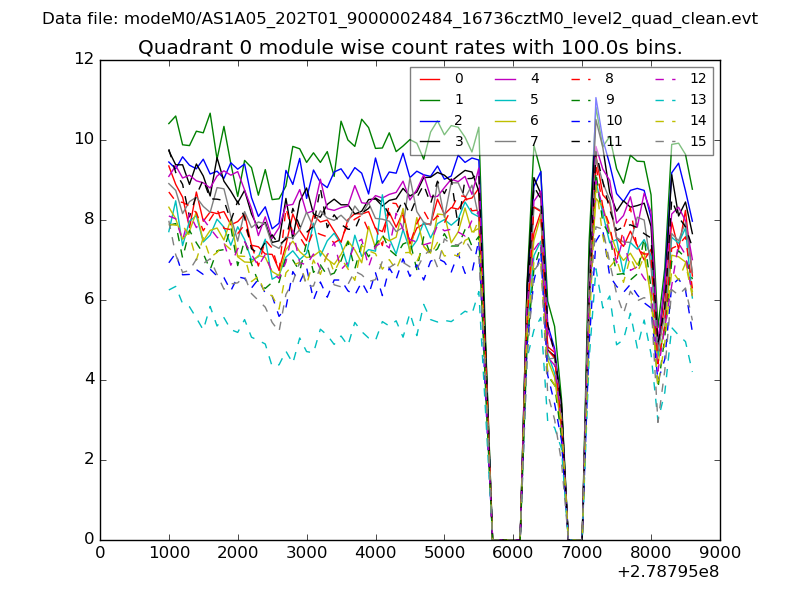 |
 |
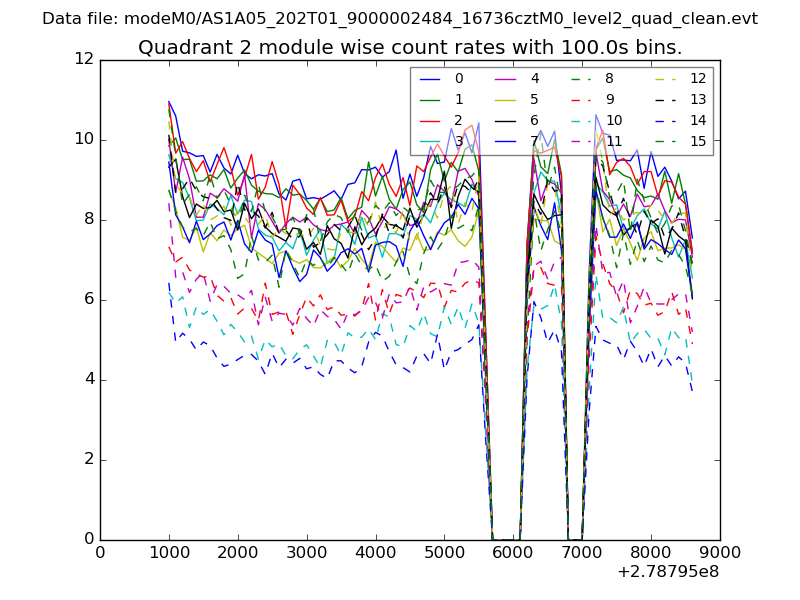
| Module-wise count rates for Quadrant B Data is divided into 100 sec bins |
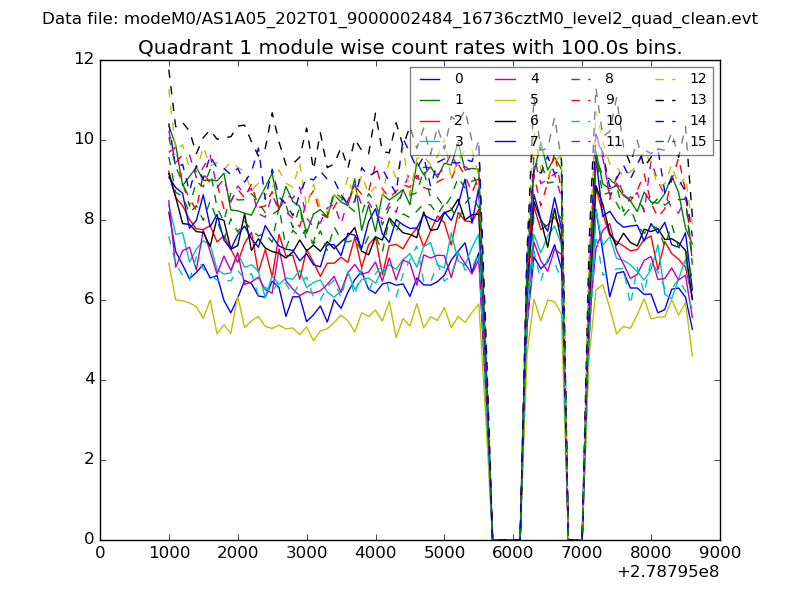 |
 |
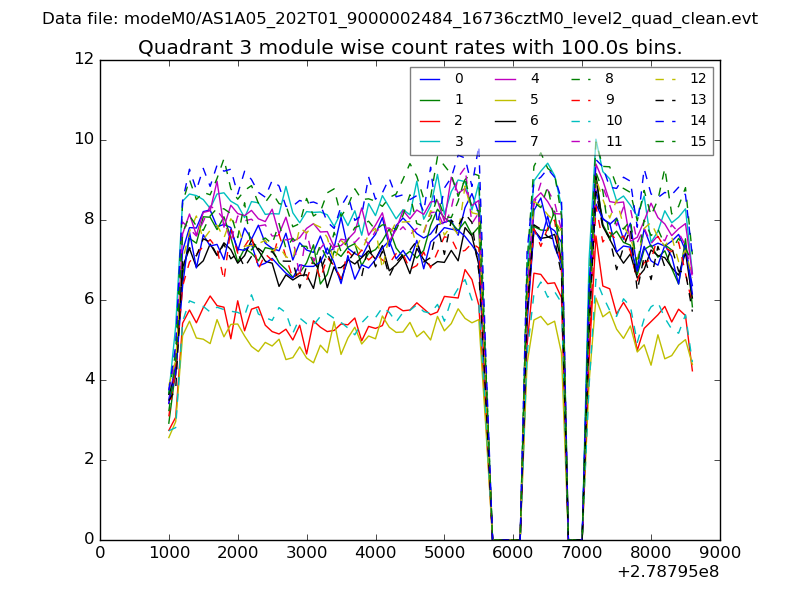
| Module-wise count rates for Quadrant C Data is divided into 100 sec bins |
 |
 |
| Module-wise count rates for Quadrant D Data is divided into 100 sec bins |
 |
 |
| Parameter | Plot |
|---|---|
| CZT HV Monitor | 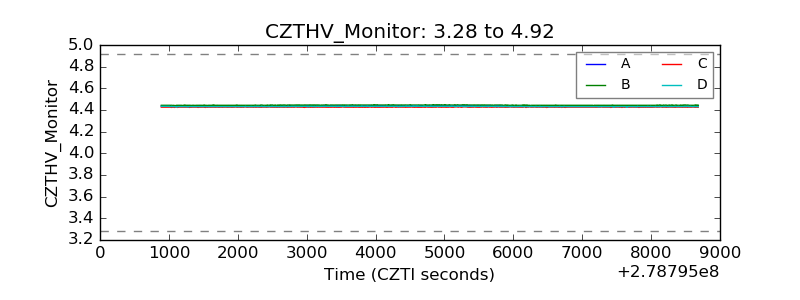 |
| D_VDD | 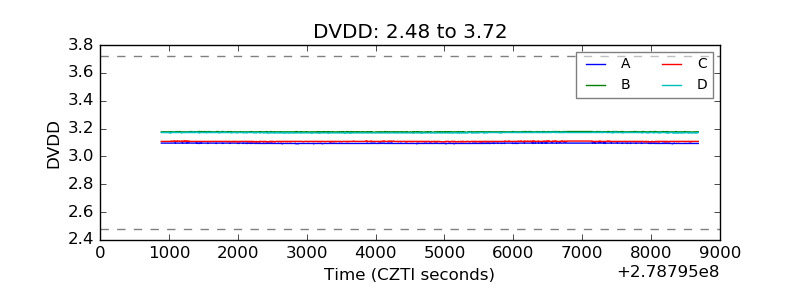 |
| Temperature 1 | 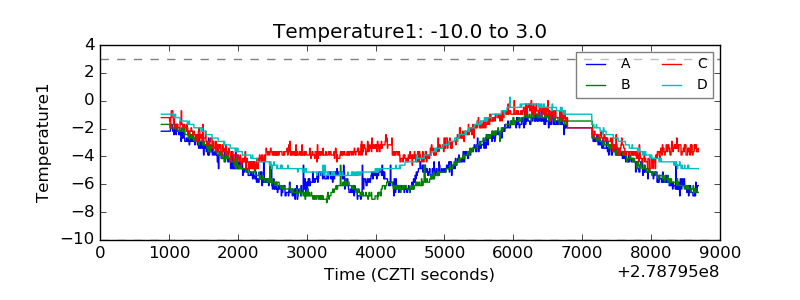 |
| Veto HV Monitor | 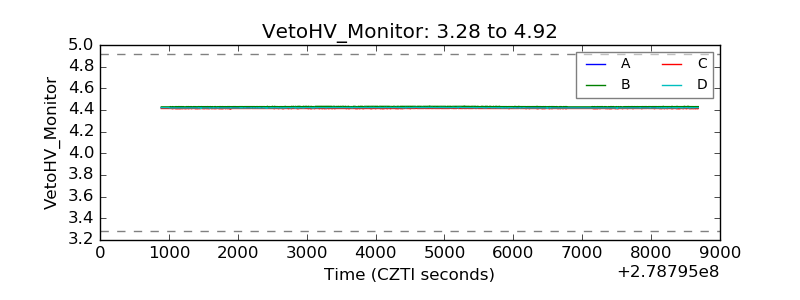 |
| Veto LLD |  |
| Alpha Counter |  |
| _CPM_Rate | 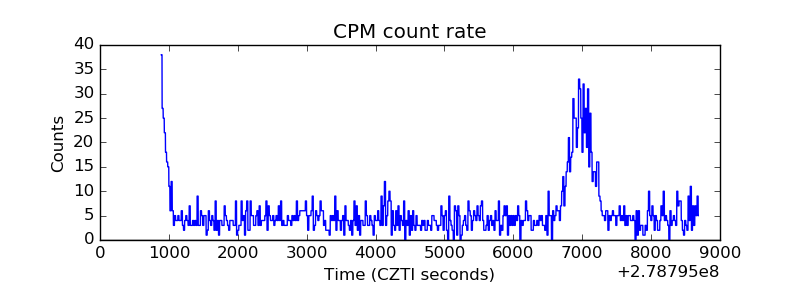 |
| CZT Counter | 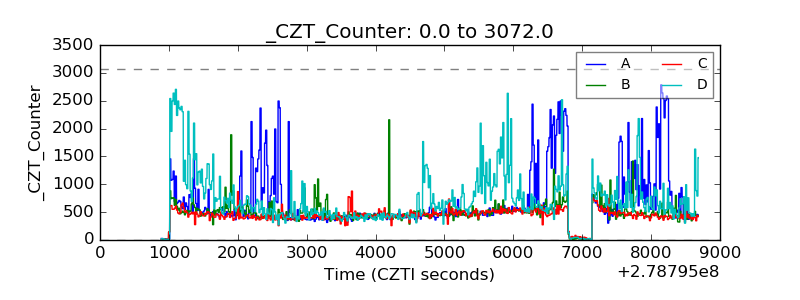 |
| +2.5 Volts monitor |  |
| +5 Volts monitor |  |
| _ROLL_ROT | 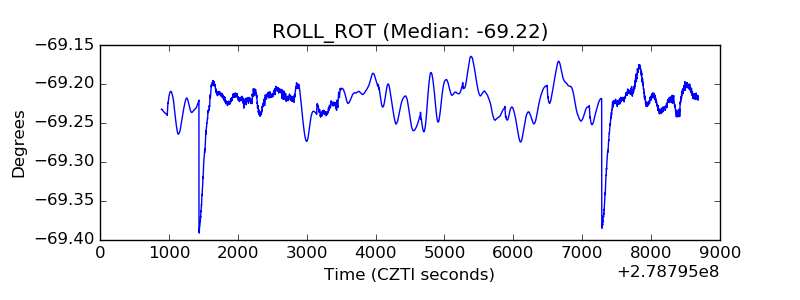 |
| _Roll_DEC | 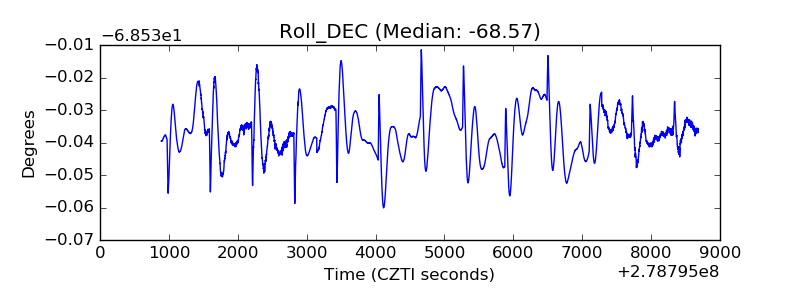 |
| _Roll_RA | 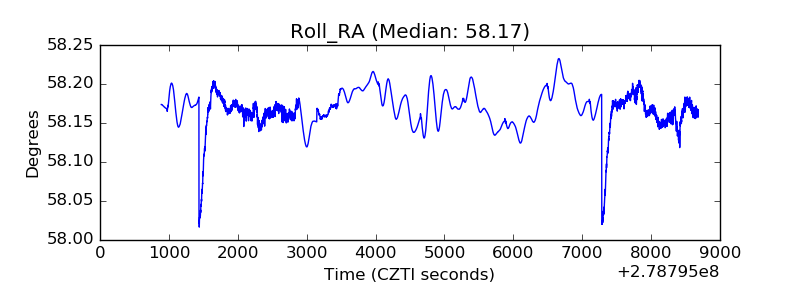 |
| Veto Counter | 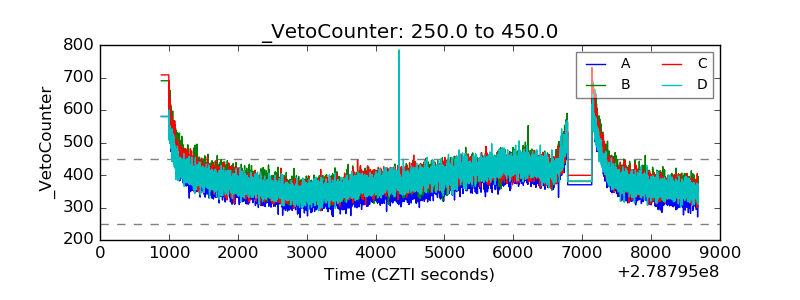 |