| Param | Original file | Final file |
|---|---|---|
| Filename | modeM0/AS1A05_202T01_9000002484_16737cztM0_level2.evt | modeM0/AS1A05_202T01_9000002484_16737cztM0_level2_quad_clean.evt |
| Size (bytes) | 664,948,800 | 133,496,640 |
| Size | 634.1 MB | 127.3 MB |
| Events in quadrant A | 5,750,140 | 852,333 |
| Events in quadrant B | 4,091,505 | 917,202 |
| Events in quadrant C | 3,781,004 | 876,352 |
| Events in quadrant D | 5,980,674 | 848,126 |
| Mode M0 | |||
|---|---|---|---|
| Quadrant | BADHDUFLAG | Total packets | Discarded packets |
| A | 0 | 22759 | 3 |
| B | 0 | 17487 | 2 |
| C | 0 | 16518 | 2 |
| D | 0 | 23223 | 2 |
| Mode M9 | |||
|---|---|---|---|
| Quadrant | BADHDUFLAG | Total packets | Discarded packets |
| A | 0 | 5 | 0 |
| B | 0 | 5 | 0 |
| C | 0 | 5 | 0 |
| D | 0 | 5 | 0 |
| Mode SS | |||
|---|---|---|---|
| Quadrant | BADHDUFLAG | Total packets | Discarded packets |
| A | 0 | 160 | 0 |
| B | 0 | 160 | 0 |
| C | 0 | 160 | 0 |
| D | 0 | 160 | 0 |
| Quadrant | Total seconds | Saturated seconds | Saturation percentage |
|---|---|---|---|
| A | 7892 | 889 | 11.264572% |
| B | 7892 | 146 | 1.849975% |
| C | 7892 | 129 | 1.634567% |
| D | 7892 | 310 | 3.928028% |
Noise dominated data is calculated using 1-second bins in cleaned event files. If a bin has >2000 counts, and if more than 50% of those come from <1% of pixels, then it is considered to be noise-dominated and hence unusable.
| Quadrant | # 1 sec bins | Bins with >0 counts | Bins with >2000 counts | High rate bins dominated by noise | Noise dominated (total time) | Noise dominated (detector-on time) | Marked lightcurve |
|---|---|---|---|---|---|---|---|
| A | 8438 | 7895 | 496 | 496 | 5.88% | 6.28% | 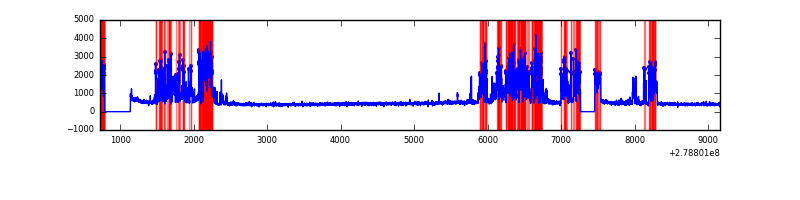 |
| B | 8438 | 7895 | 33 | 33 | 0.39% | 0.42% | 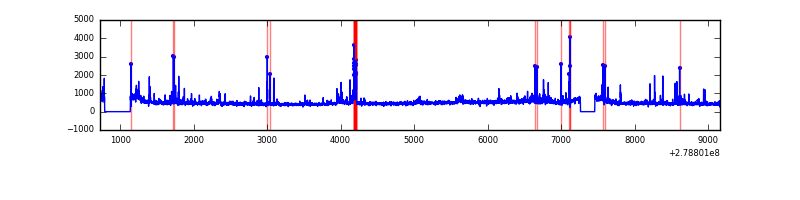 |
| C | 8438 | 7895 | 13 | 13 | 0.15% | 0.16% | 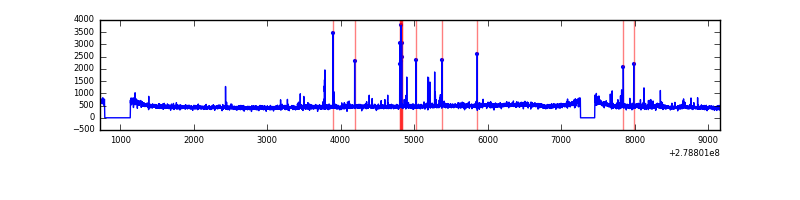 |
| D | 8438 | 7895 | 181 | 181 | 2.15% | 2.29% | 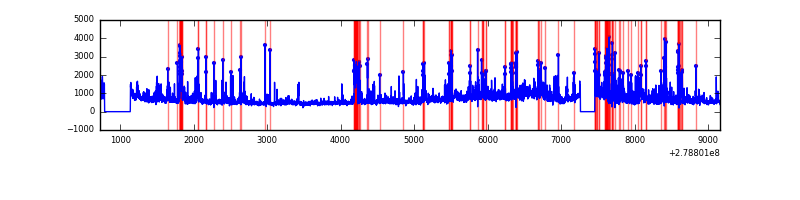 |
Top three noisy pixels from each quadrant. If the there are fewer than three noisy pixels in the level2.evt file, extra rows are filled as -1
| Pixel properties | Quadrant properties | ||||||
|---|---|---|---|---|---|---|---|
| Quadrant | DetID | PixID | Counts | Sigma | Mean | Median | Sigma |
| A | 15 | 174 | 2244424 | 12645.53 | 878 | 859 | 177.4 |
| A | 0 | 23 | 112414 | 628.76 | 878 | 859 | 177.4 |
| A | 0 | 226 | 13958 | 73.83 | 878 | 859 | 177.4 |
| B | 10 | 16 | 200511 | 1130.97 | 930 | 905 | 176.5 |
| B | 15 | 35 | 86154 | 483.02 | 930 | 905 | 176.5 |
| B | 7 | 220 | 47387 | 263.37 | 930 | 905 | 176.5 |
| C | 14 | 238 | 138588 | 669.22 | 884 | 886 | 205.8 |
| C | 0 | 207 | 117424 | 566.37 | 884 | 886 | 205.8 |
| C | 3 | 233 | 58201 | 278.55 | 884 | 886 | 205.8 |
| D | 1 | 52 | 1651810 | 7650.9 | 886 | 860 | 215.8 |
| D | 2 | 16 | 458058 | 2118.76 | 886 | 860 | 215.8 |
| D | 10 | 70 | 237524 | 1096.76 | 886 | 860 | 215.8 |
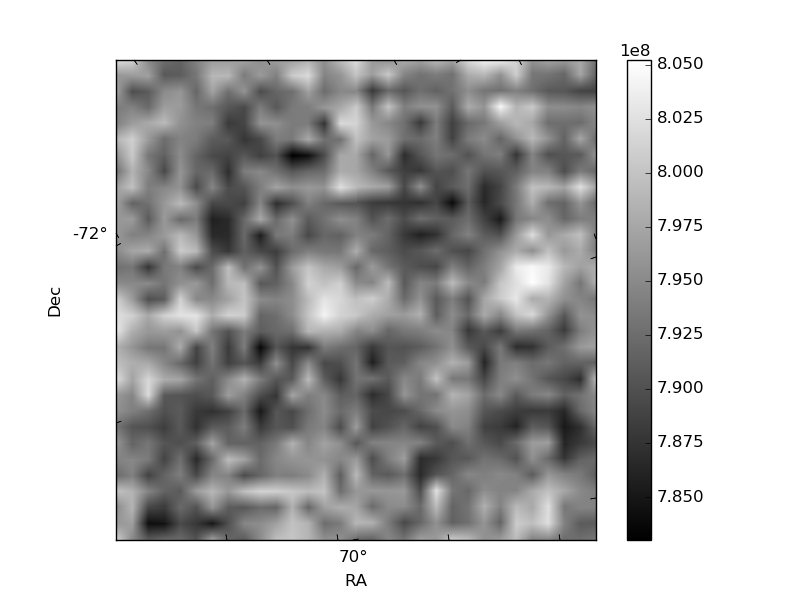
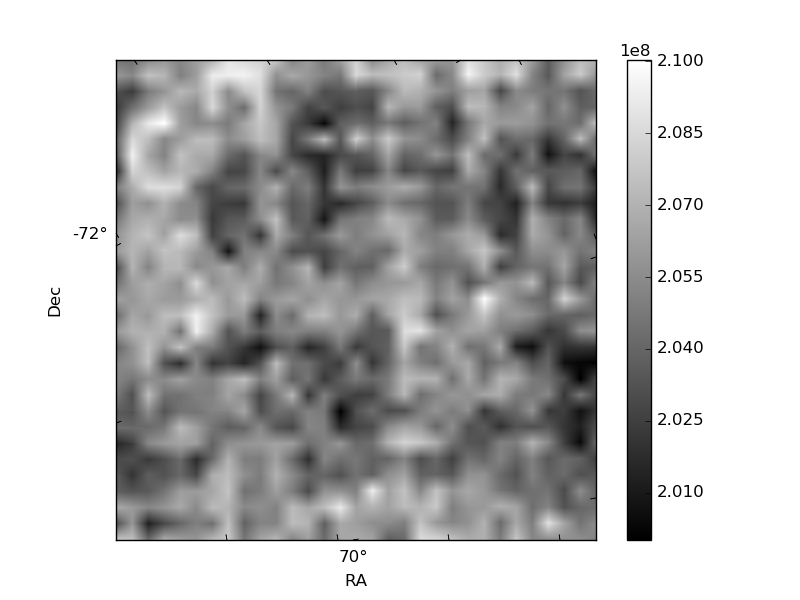
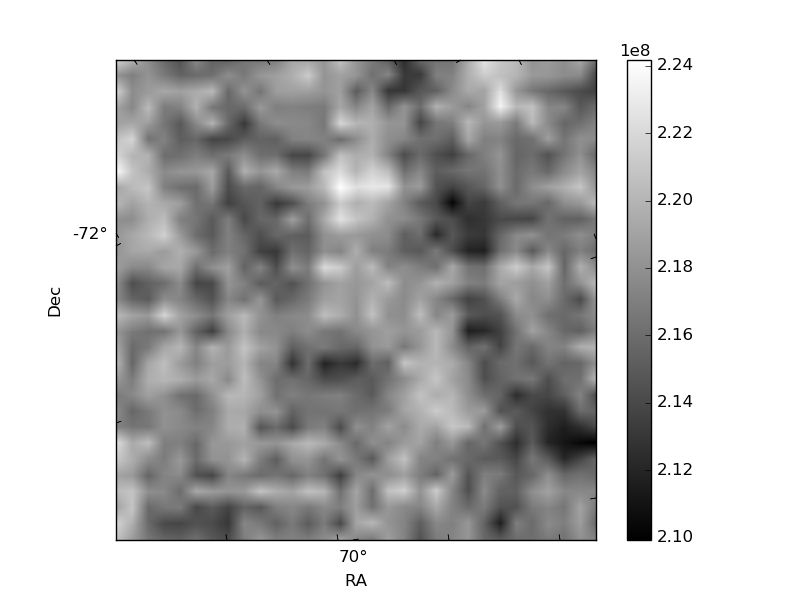
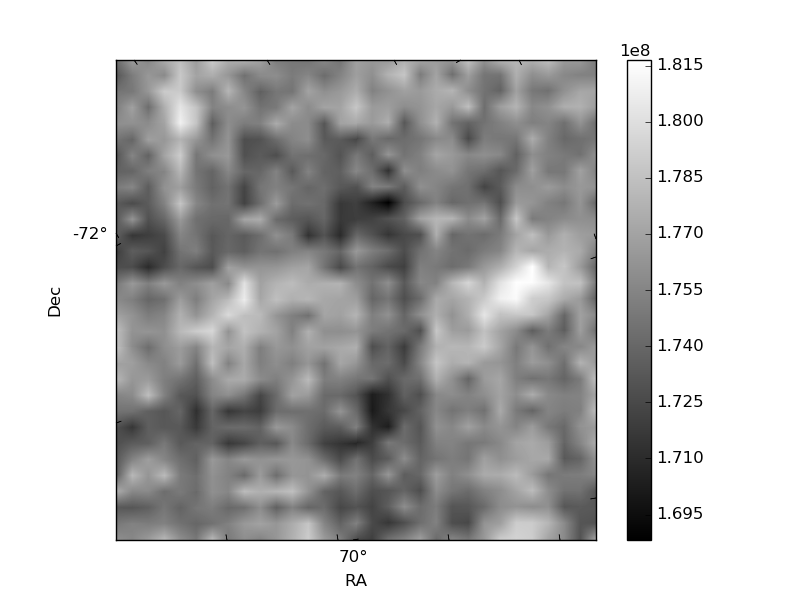
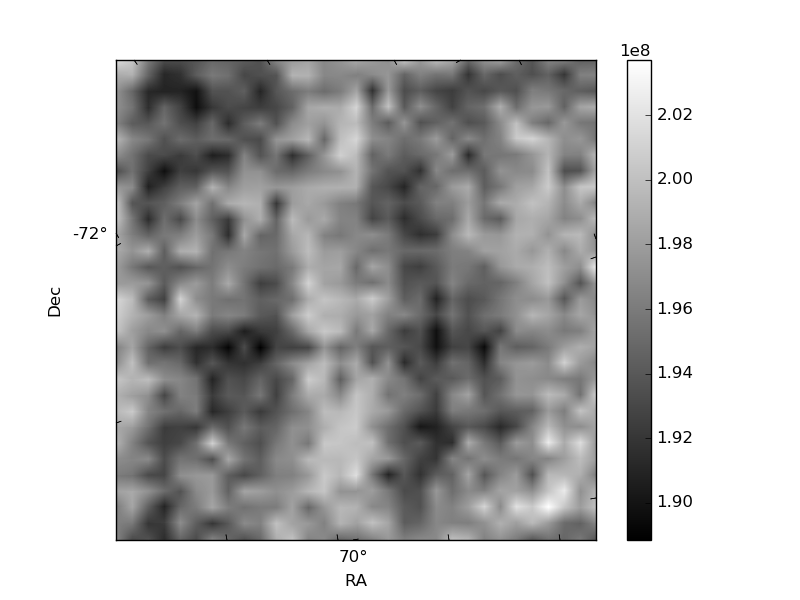
Histogram calculated using DETX and DETY for each event in the final _common_clean file
| Quadrant A | 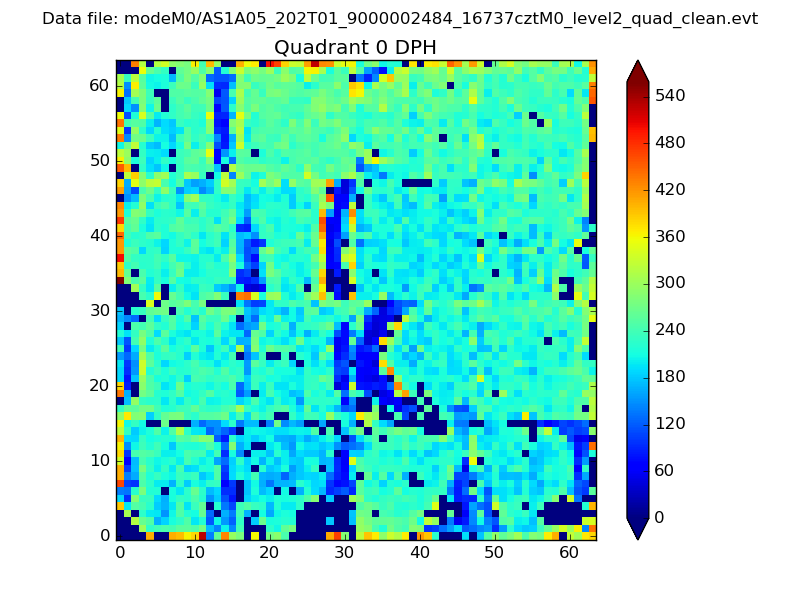 |
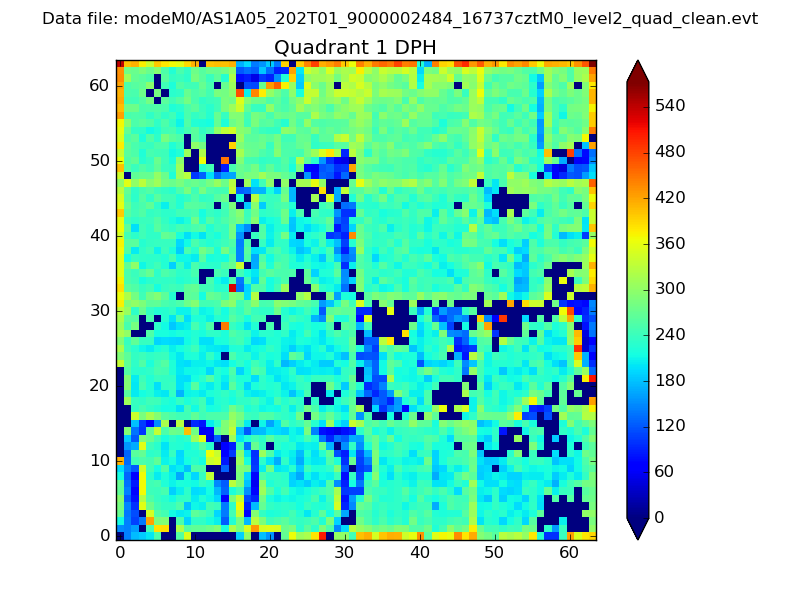 |
Quadrant B |
|---|---|---|---|
| Quadrant D | 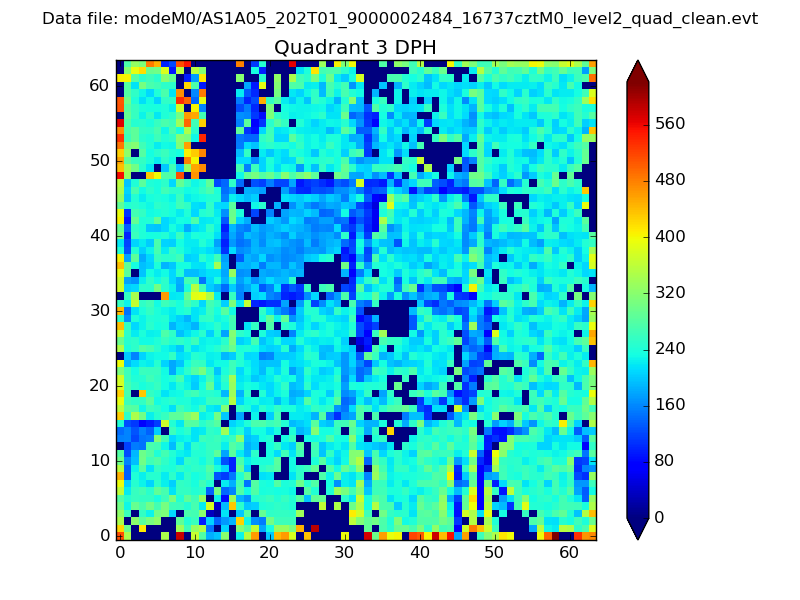 |
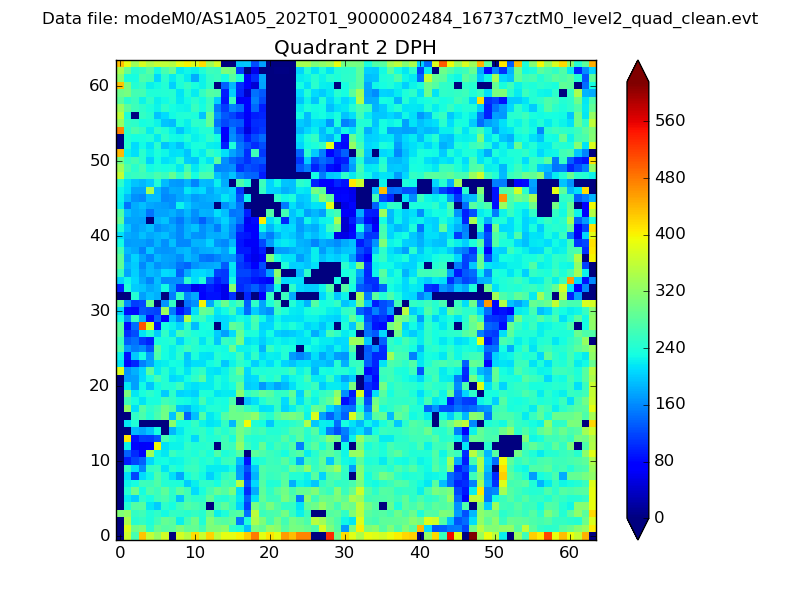 |
Quadrant C |
| Plot type | Count rate plots | Images |
|---|---|---|
| Comparison with Poisson distribution Blue bars denote a histogram of data divided into 1 sec bins. Red curve is a Poisson curve with rate = median count rate of data. |
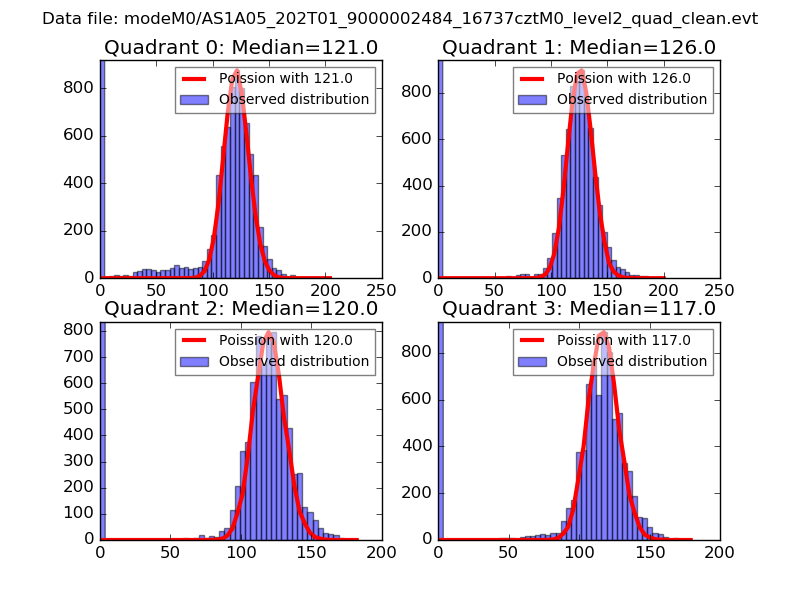 |
 |
| Quadrant-wise count rates Data is divided into 100 sec bins |
 |
|
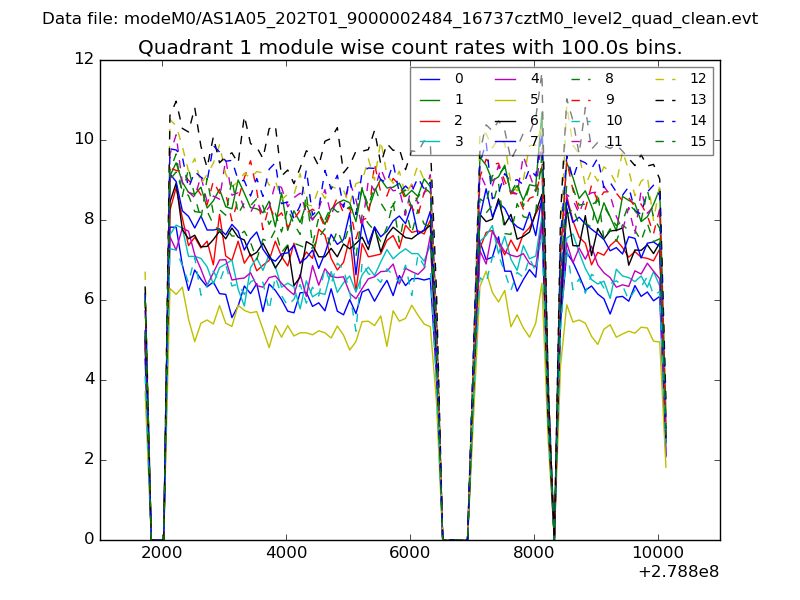
| Module-wise count rates for Quadrant A Data is divided into 100 sec bins |
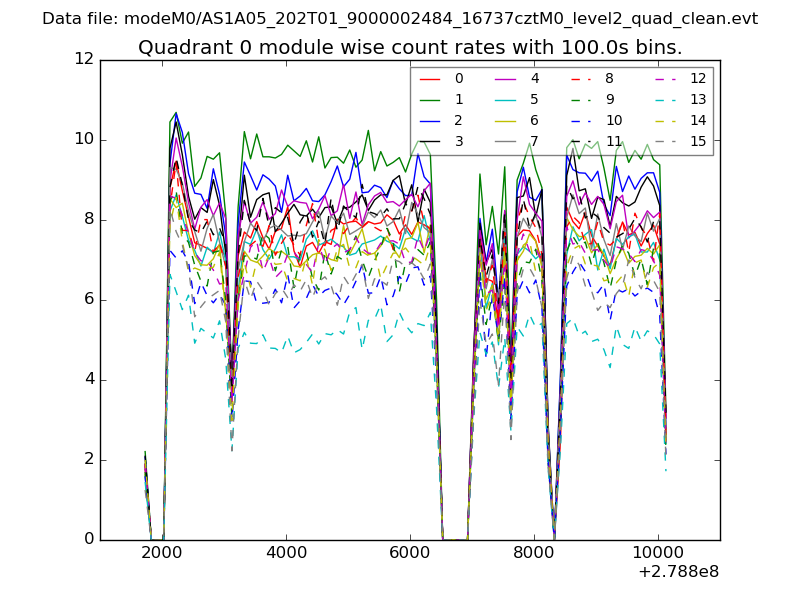 |
 |
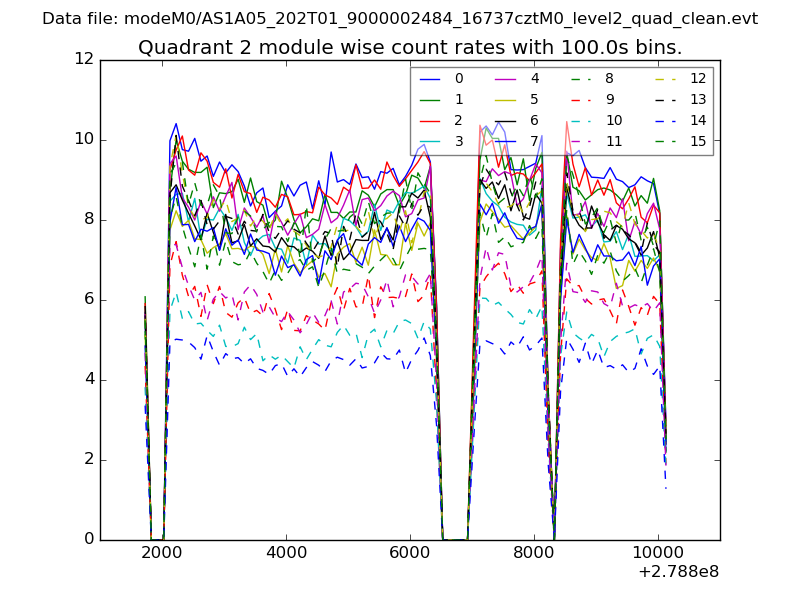
| Module-wise count rates for Quadrant B Data is divided into 100 sec bins |
 |
 |
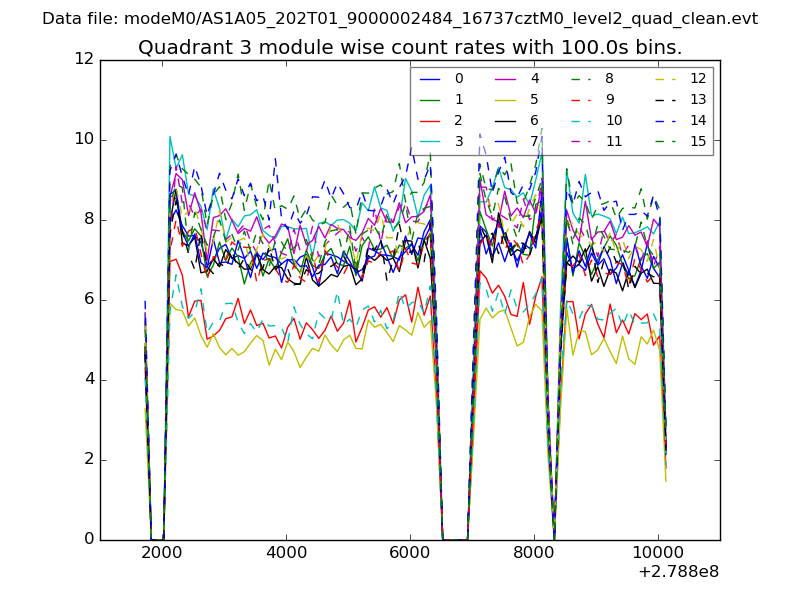
| Module-wise count rates for Quadrant C Data is divided into 100 sec bins |
 |
 |
| Module-wise count rates for Quadrant D Data is divided into 100 sec bins |
 |
 |
| Parameter | Plot |
|---|---|
| CZT HV Monitor | 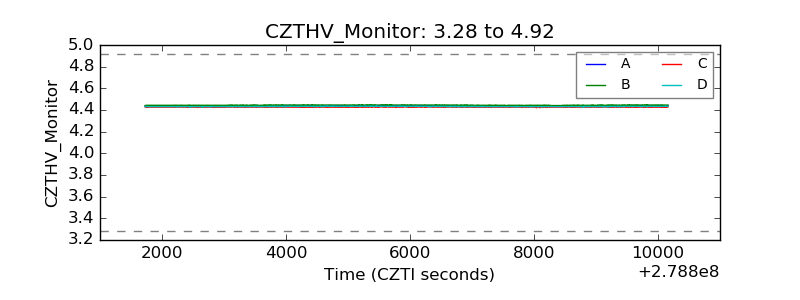 |
| D_VDD | 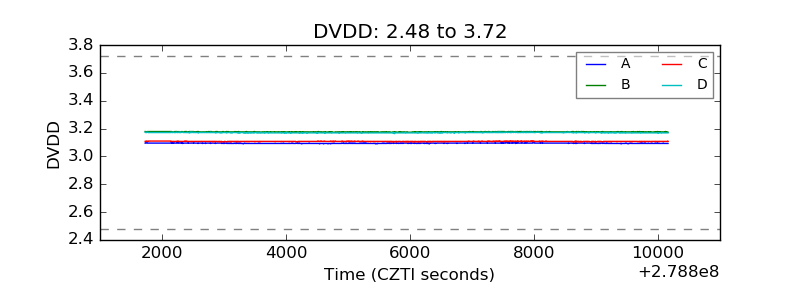 |
| Temperature 1 | 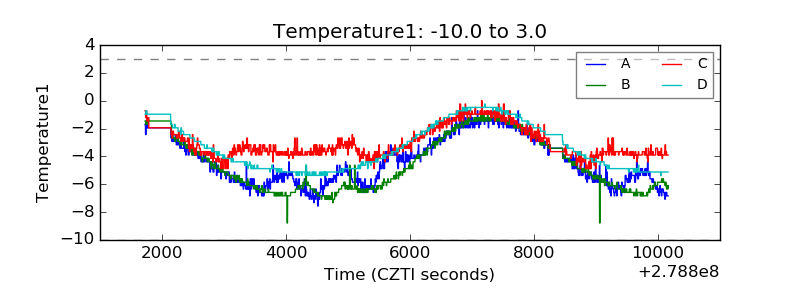 |
| Veto HV Monitor |  |
| Veto LLD | 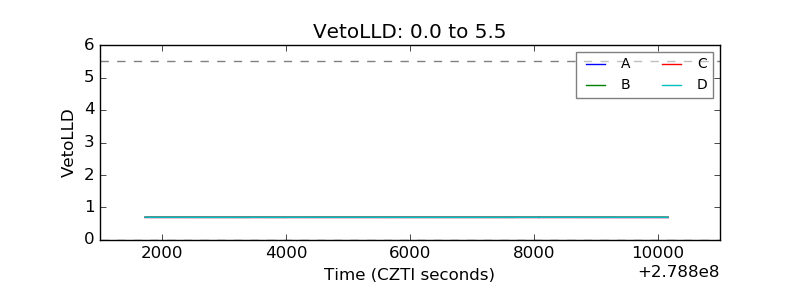 |
| Alpha Counter |  |
| _CPM_Rate | 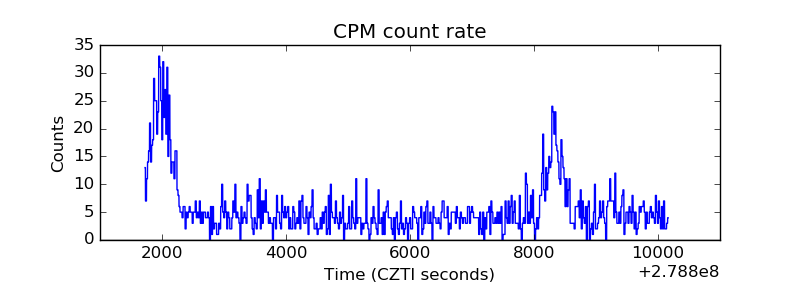 |
| CZT Counter | 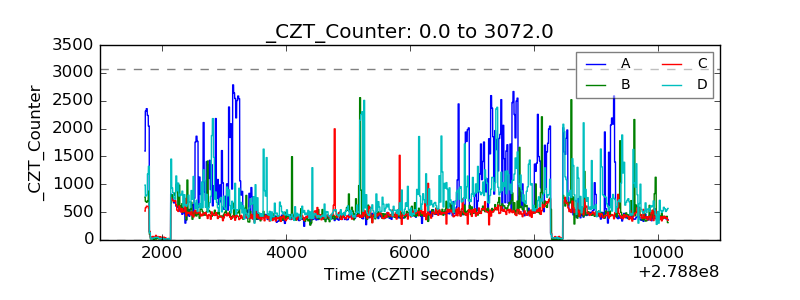 |
| +2.5 Volts monitor | 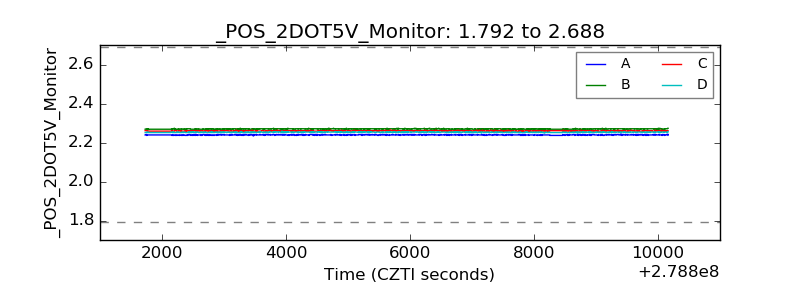 |
| +5 Volts monitor |  |
| _ROLL_ROT | 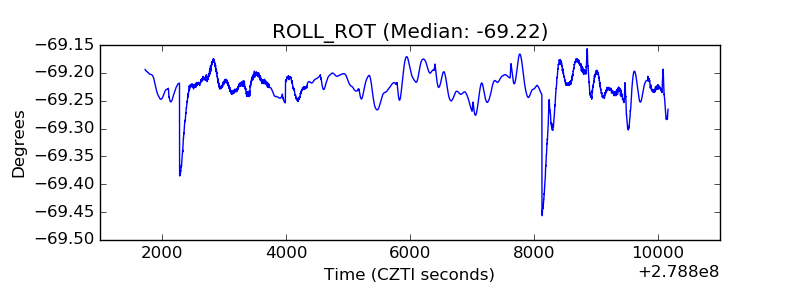 |
| _Roll_DEC | 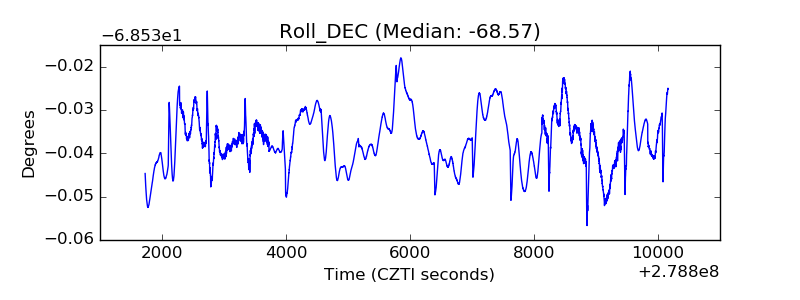 |
| _Roll_RA |  |
| Veto Counter | 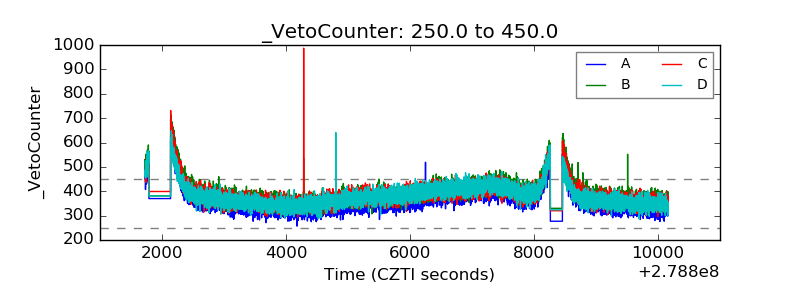 |