| Param | Original file | Final file |
|---|---|---|
| Filename | modeM0/AS1A05_202T01_9000002484_16738cztM0_level2.evt | modeM0/AS1A05_202T01_9000002484_16738cztM0_level2_quad_clean.evt |
| Size (bytes) | 704,649,600 | 138,879,360 |
| Size | 672.0 MB | 132.4 MB |
| Events in quadrant A | 6,764,238 | 876,585 |
| Events in quadrant B | 4,237,706 | 953,206 |
| Events in quadrant C | 4,009,050 | 913,381 |
| Events in quadrant D | 5,768,743 | 887,317 |
| Mode M0 | |||
|---|---|---|---|
| Quadrant | BADHDUFLAG | Total packets | Discarded packets |
| A | 0 | 25846 | 3 |
| B | 0 | 18153 | 2 |
| C | 0 | 17285 | 2 |
| D | 0 | 22785 | 2 |
| Mode M9 | |||
|---|---|---|---|
| Quadrant | BADHDUFLAG | Total packets | Discarded packets |
| A | 0 | 5 | 0 |
| B | 0 | 5 | 0 |
| C | 0 | 5 | 0 |
| D | 0 | 5 | 0 |
| Mode SS | |||
|---|---|---|---|
| Quadrant | BADHDUFLAG | Total packets | Discarded packets |
| A | 0 | 170 | 0 |
| B | 0 | 170 | 0 |
| C | 0 | 170 | 0 |
| D | 0 | 170 | 0 |
| Quadrant | Total seconds | Saturated seconds | Saturation percentage |
|---|---|---|---|
| A | 8277 | 1100 | 13.289839% |
| B | 8277 | 145 | 1.751842% |
| C | 8277 | 122 | 1.473964% |
| D | 8277 | 279 | 3.370787% |
Noise dominated data is calculated using 1-second bins in cleaned event files. If a bin has >2000 counts, and if more than 50% of those come from <1% of pixels, then it is considered to be noise-dominated and hence unusable.
| Quadrant | # 1 sec bins | Bins with >0 counts | Bins with >2000 counts | High rate bins dominated by noise | Noise dominated (total time) | Noise dominated (detector-on time) | Marked lightcurve |
|---|---|---|---|---|---|---|---|
| A | 8793 | 8281 | 698 | 698 | 7.94% | 8.43% | 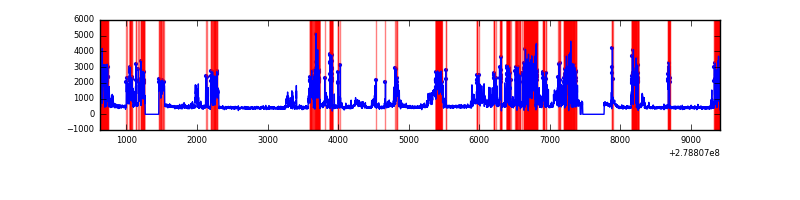 |
| B | 8793 | 8281 | 25 | 25 | 0.28% | 0.30% | 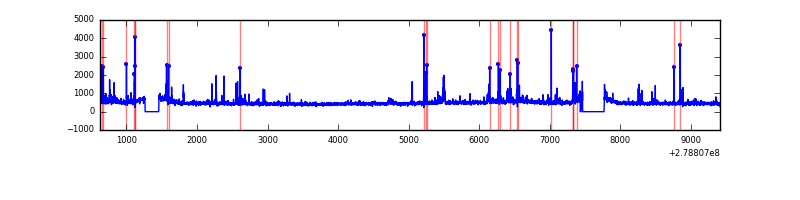 |
| C | 8793 | 8281 | 10 | 10 | 0.11% | 0.12% | 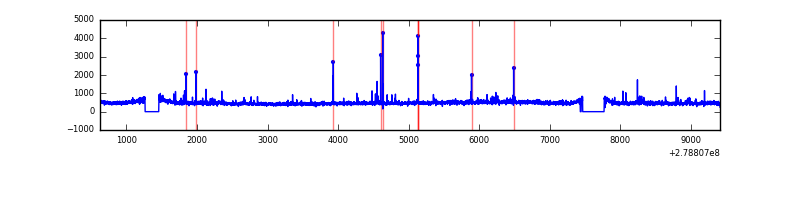 |
| D | 8793 | 8281 | 148 | 148 | 1.68% | 1.79% | 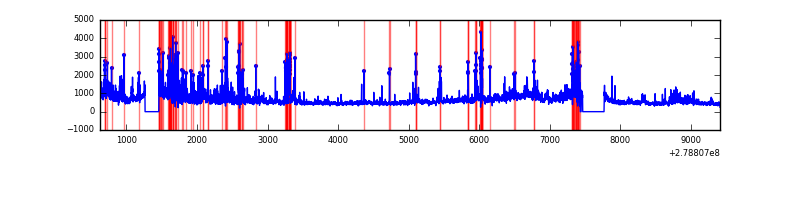 |
Top three noisy pixels from each quadrant. If the there are fewer than three noisy pixels in the level2.evt file, extra rows are filled as -1
| Pixel properties | Quadrant properties | ||||||
|---|---|---|---|---|---|---|---|
| Quadrant | DetID | PixID | Counts | Sigma | Mean | Median | Sigma |
| A | 15 | 174 | 3130422 | 17026.21 | 911 | 890 | 183.8 |
| A | 0 | 23 | 112381 | 606.57 | 911 | 890 | 183.8 |
| A | 0 | 226 | 14355 | 73.26 | 911 | 890 | 183.8 |
| B | 10 | 16 | 162817 | 876.8 | 974 | 949 | 184.6 |
| B | 15 | 35 | 115755 | 621.87 | 974 | 949 | 184.6 |
| B | 7 | 220 | 40990 | 216.89 | 974 | 949 | 184.6 |
| C | 0 | 207 | 171017 | 779.59 | 929 | 931 | 218.2 |
| C | 14 | 238 | 146392 | 666.72 | 929 | 931 | 218.2 |
| C | 3 | 233 | 48298 | 217.1 | 929 | 931 | 218.2 |
| D | 1 | 52 | 1308302 | 5769.26 | 928 | 900 | 226.6 |
| D | 2 | 16 | 397248 | 1748.99 | 928 | 900 | 226.6 |
| D | 10 | 70 | 296661 | 1305.12 | 928 | 900 | 226.6 |
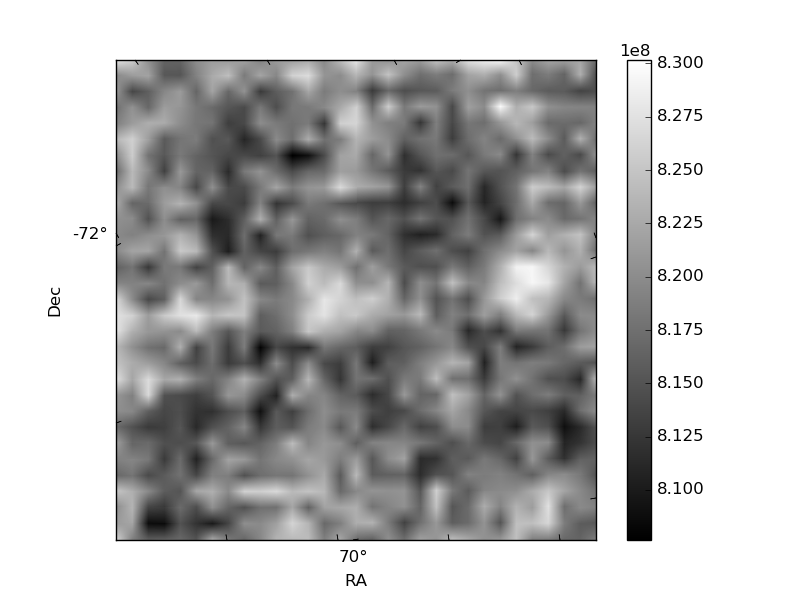
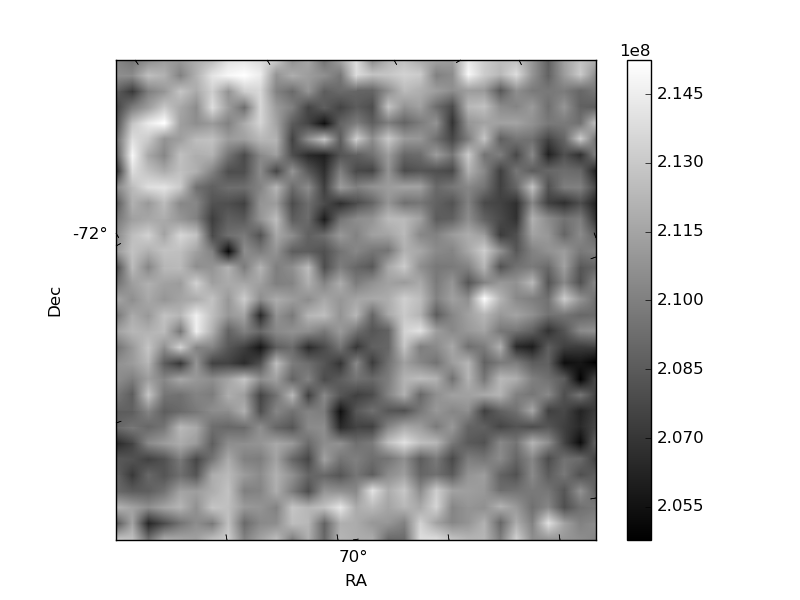
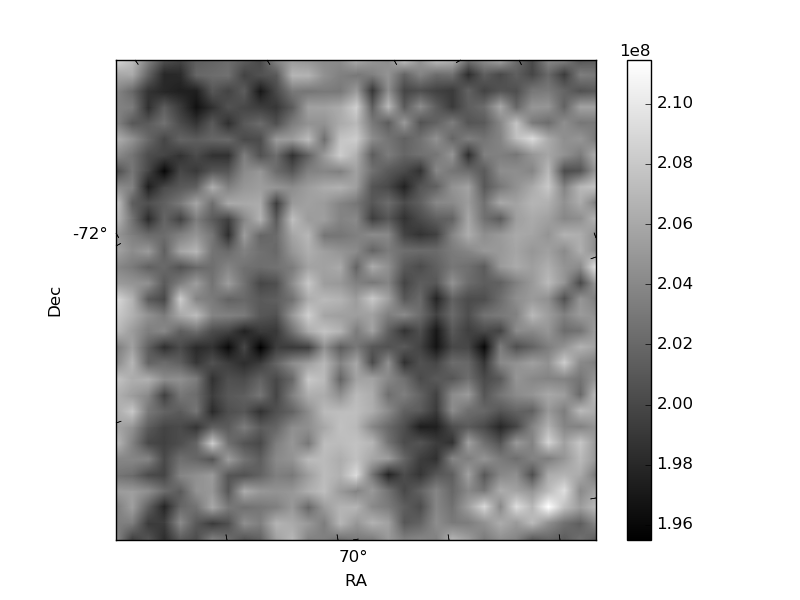
Histogram calculated using DETX and DETY for each event in the final _common_clean file
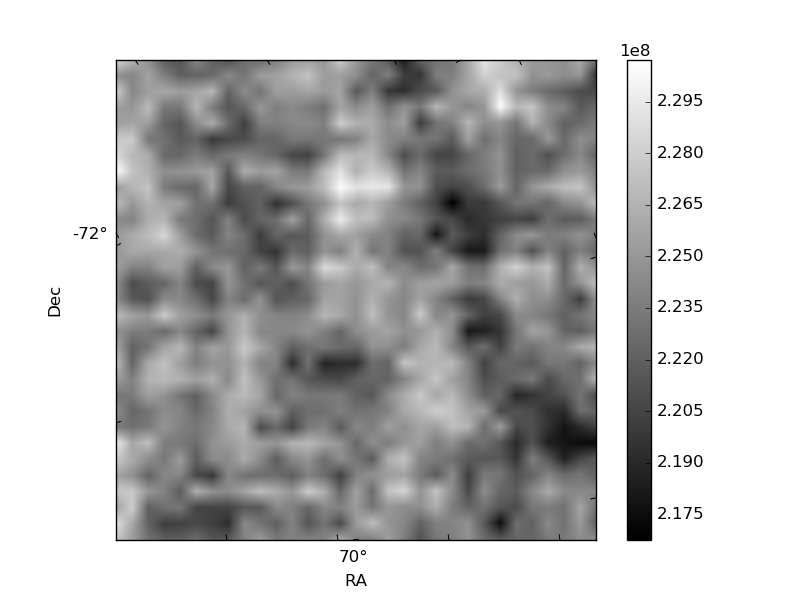
| Quadrant A | 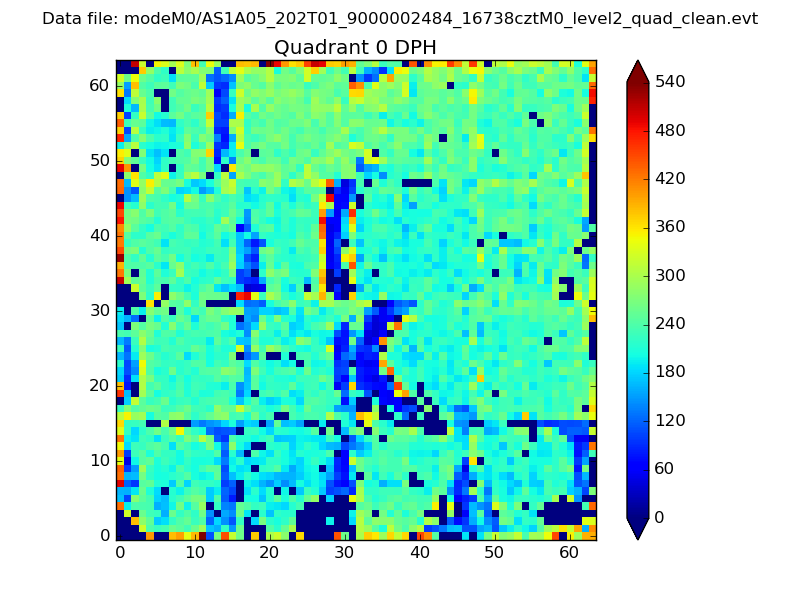 |
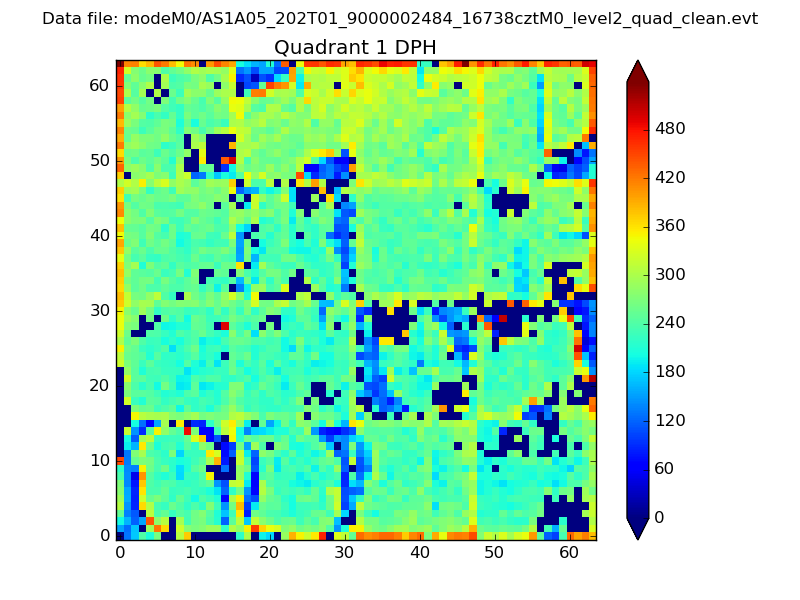 |
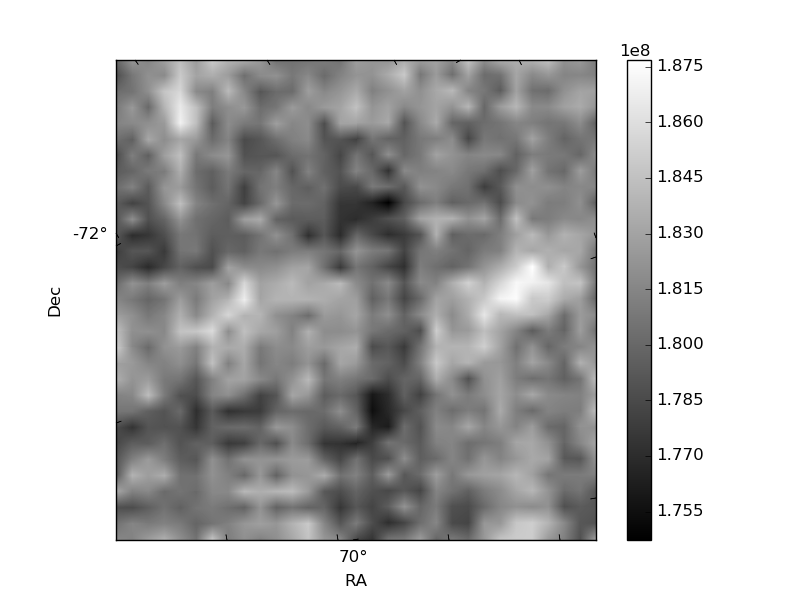
Quadrant B |
|---|---|---|---|
| Quadrant D | 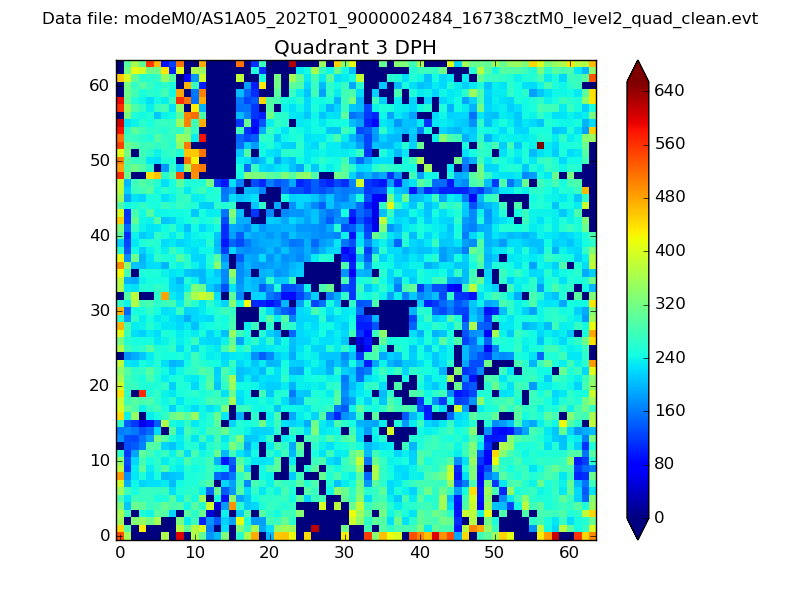 |
 |
Quadrant C |
| Plot type | Count rate plots | Images |
|---|---|---|
| Comparison with Poisson distribution Blue bars denote a histogram of data divided into 1 sec bins. Red curve is a Poisson curve with rate = median count rate of data. |
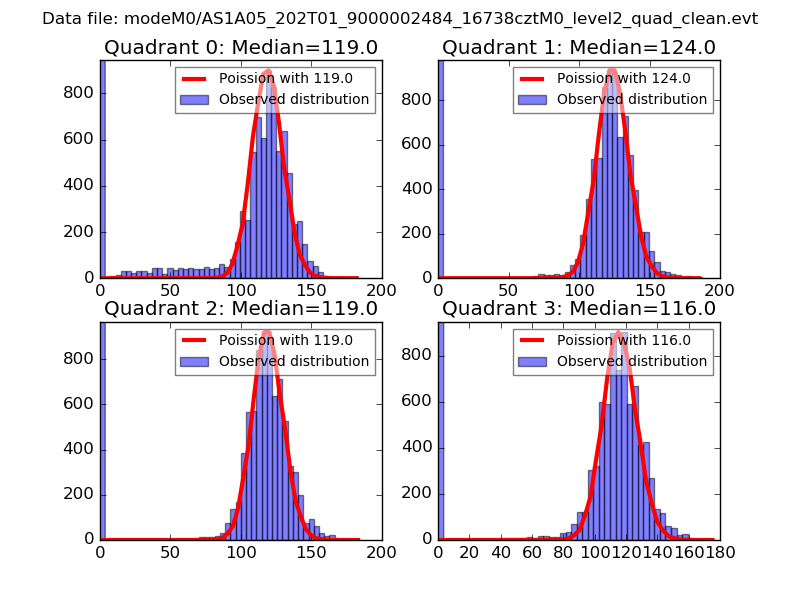 |
 |
| Quadrant-wise count rates Data is divided into 100 sec bins |
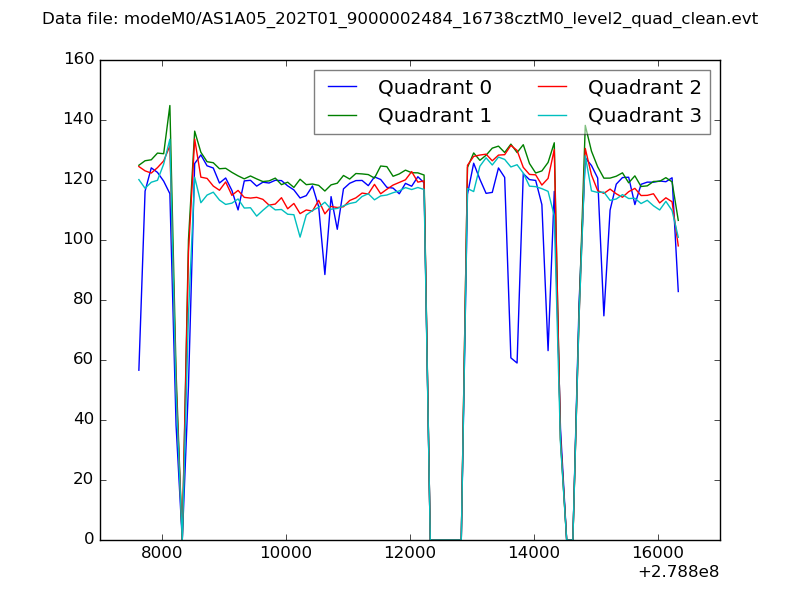 |
|
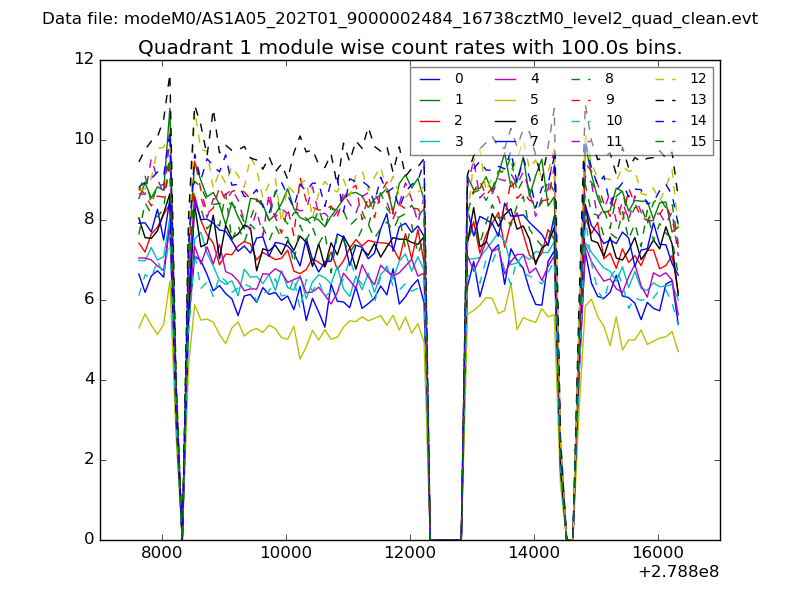
| Module-wise count rates for Quadrant A Data is divided into 100 sec bins |
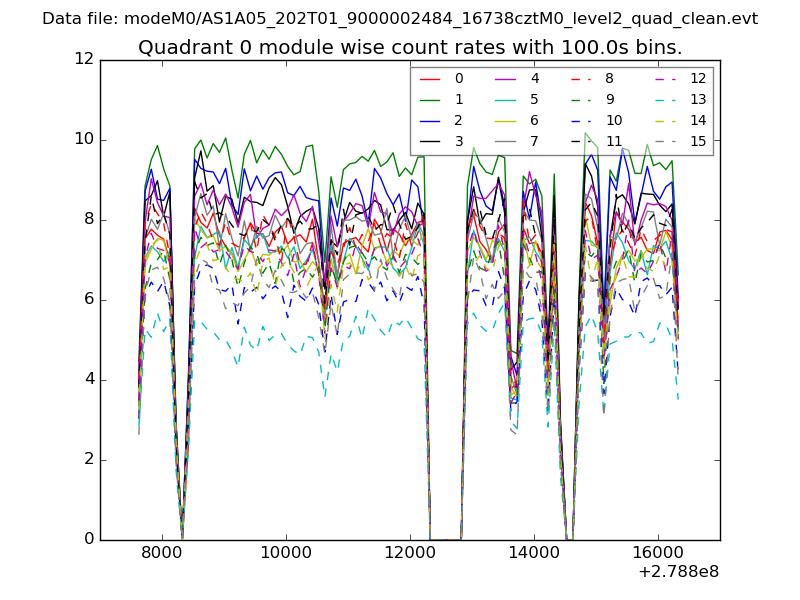 |
 |
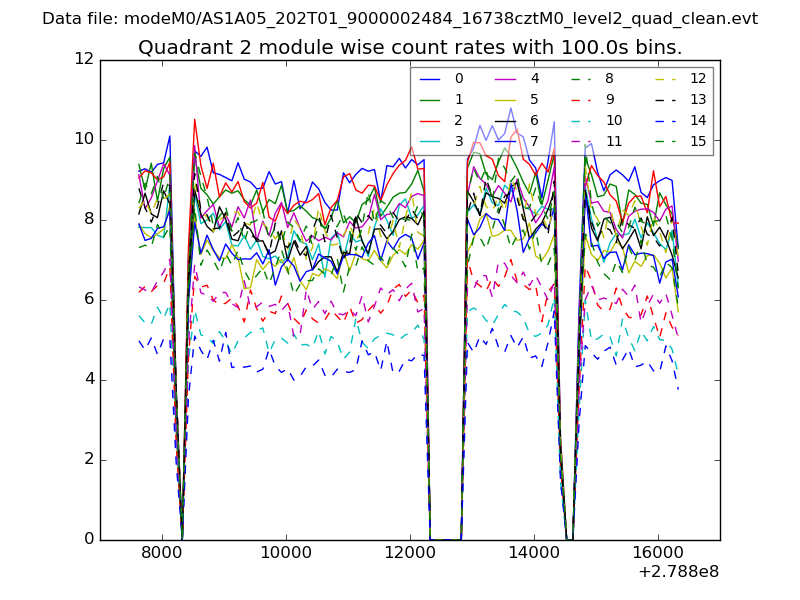
| Module-wise count rates for Quadrant B Data is divided into 100 sec bins |
 |
 |
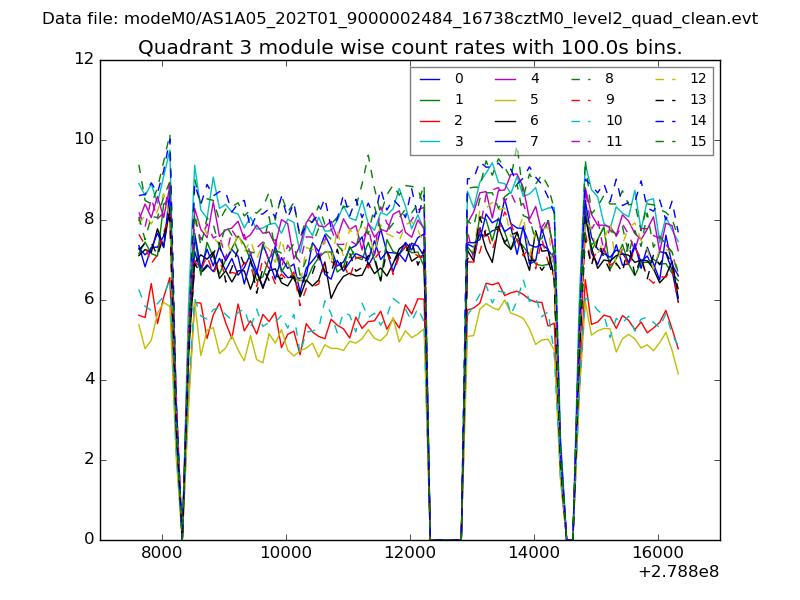
| Module-wise count rates for Quadrant C Data is divided into 100 sec bins |
 |
 |
| Module-wise count rates for Quadrant D Data is divided into 100 sec bins |
 |
 |
| Parameter | Plot |
|---|---|
| CZT HV Monitor | 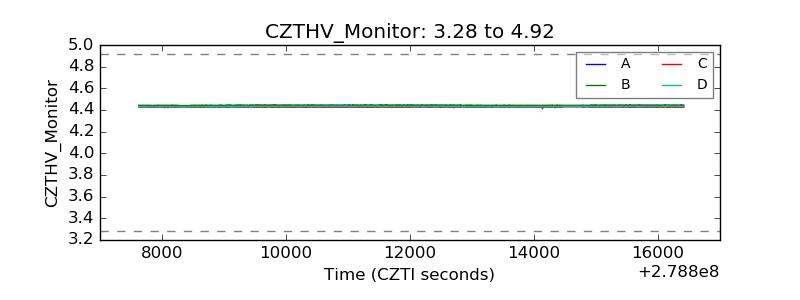 |
| D_VDD | 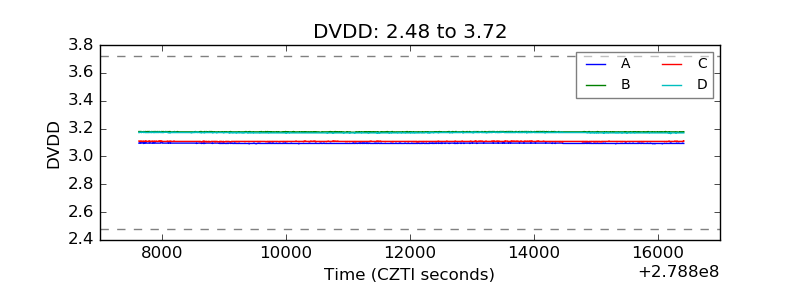 |
| Temperature 1 | 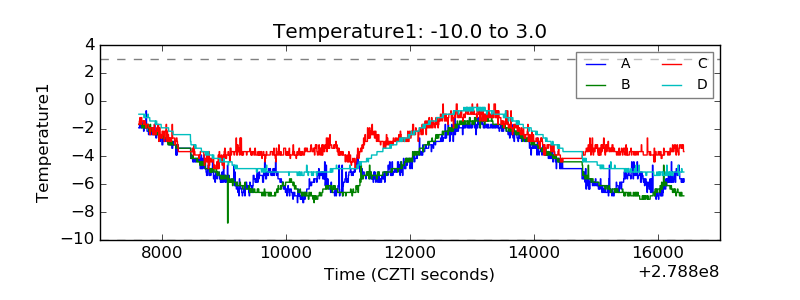 |
| Veto HV Monitor | 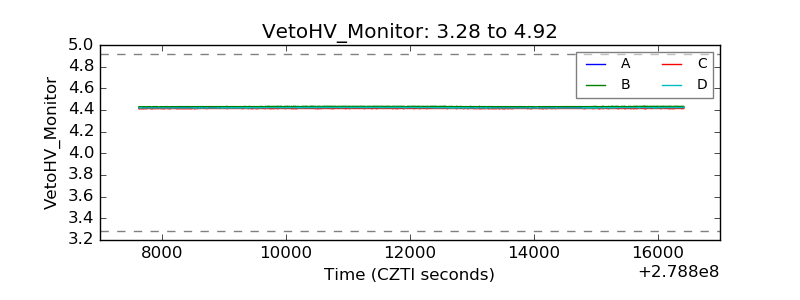 |
| Veto LLD | 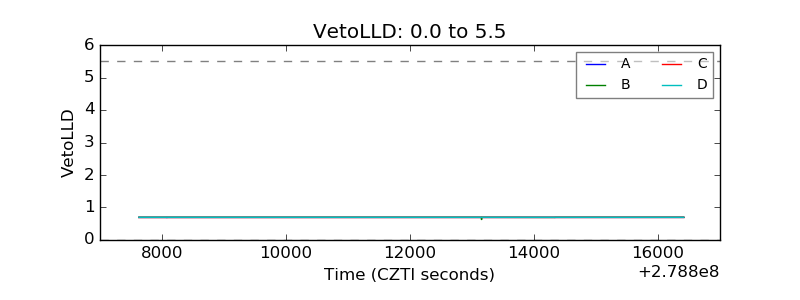 |
| Alpha Counter | 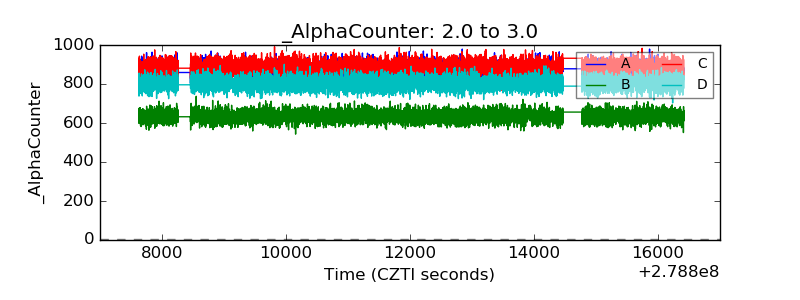 |
| _CPM_Rate | 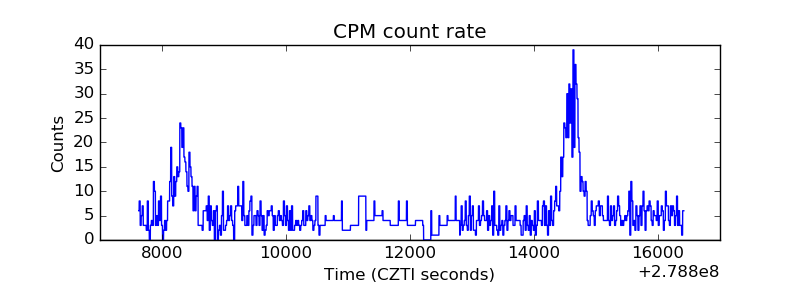 |
| CZT Counter | 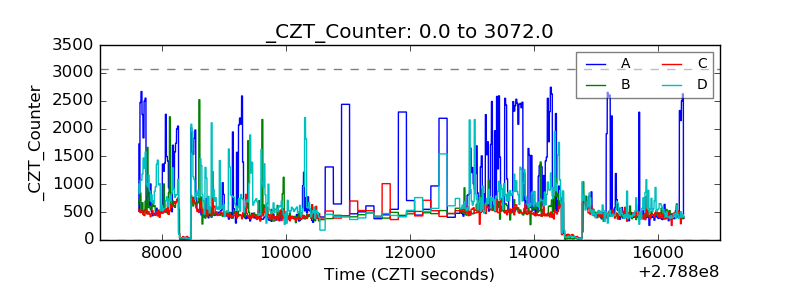 |
| +2.5 Volts monitor | 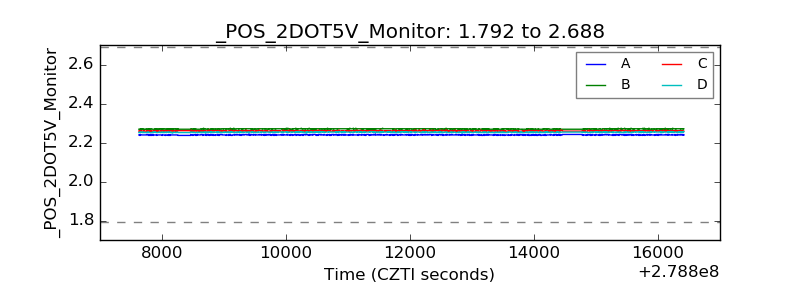 |
| +5 Volts monitor | 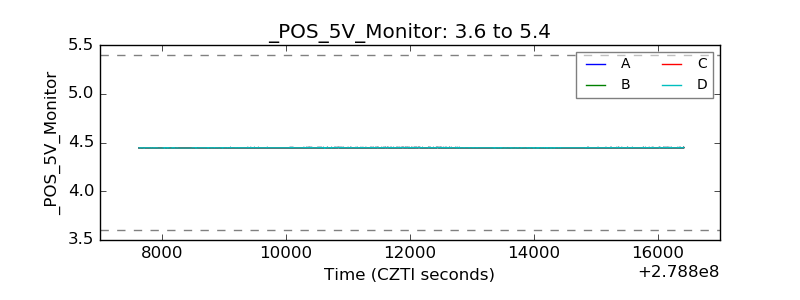 |
| _ROLL_ROT | 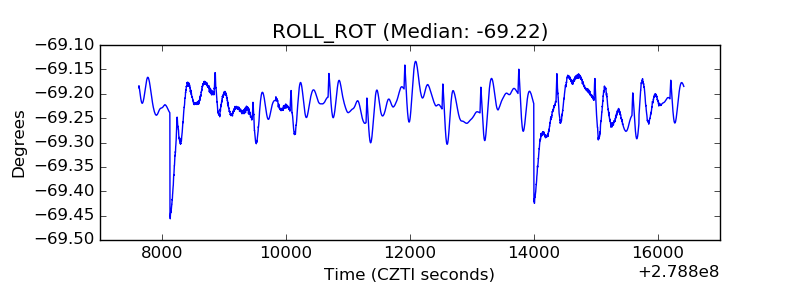 |
| _Roll_DEC | 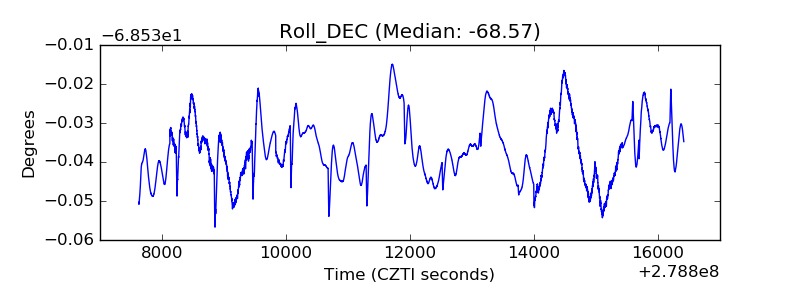 |
| _Roll_RA | 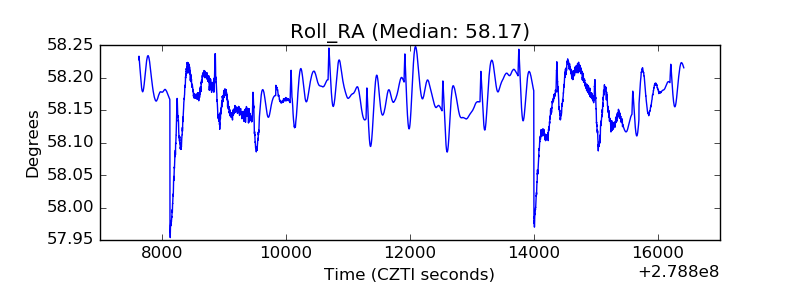 |
| Veto Counter | 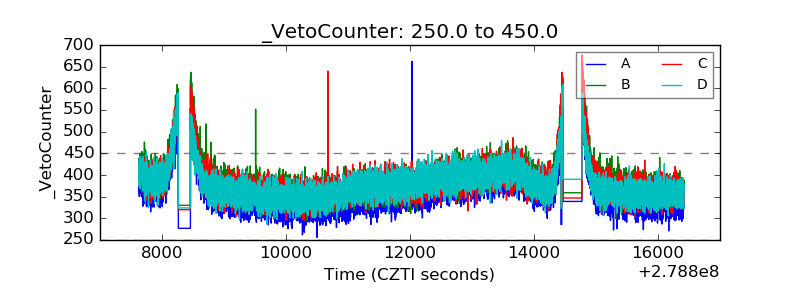 |